Downloaded 926 times

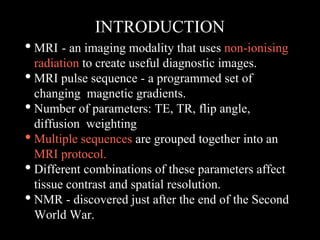
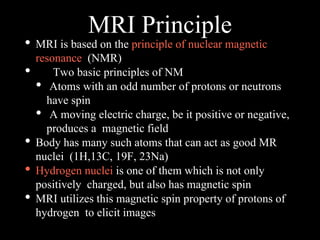
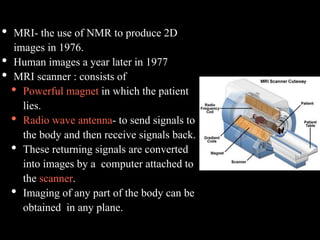
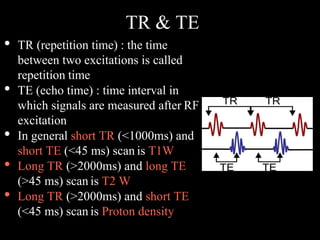
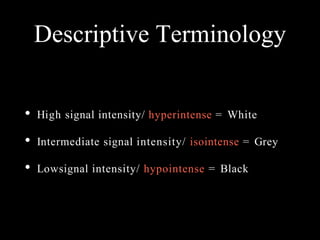
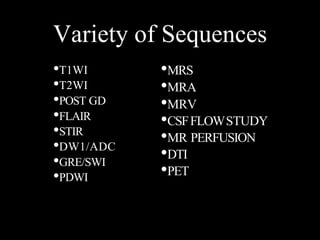
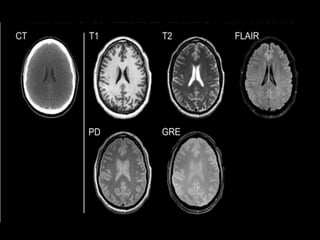
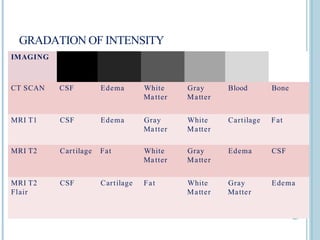
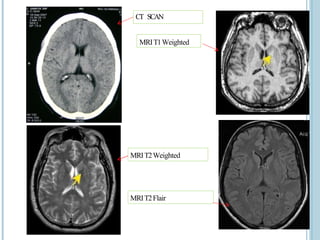
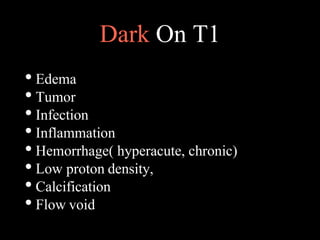
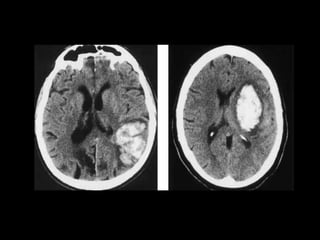
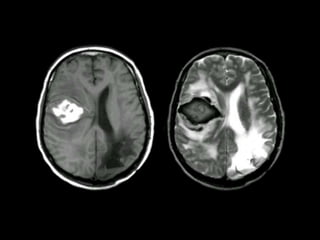
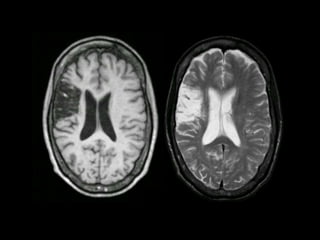


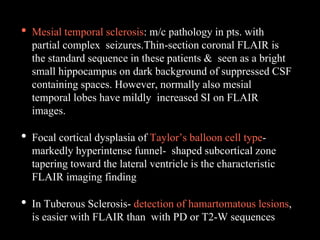


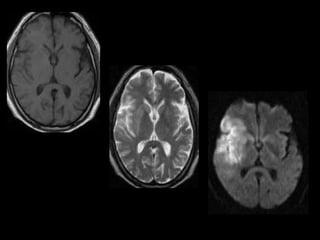

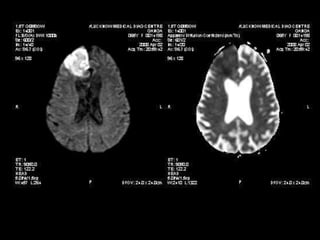
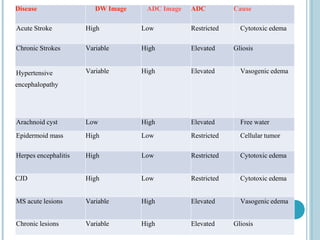

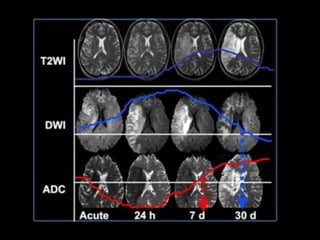


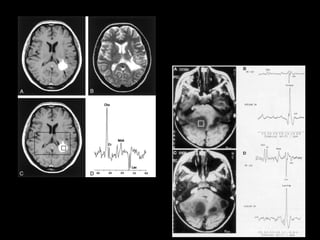
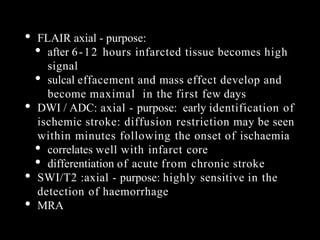
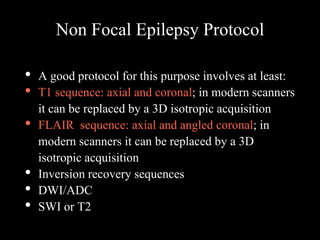
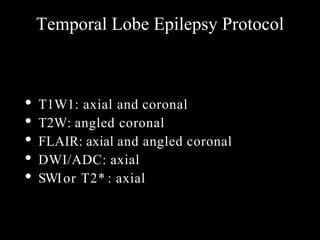
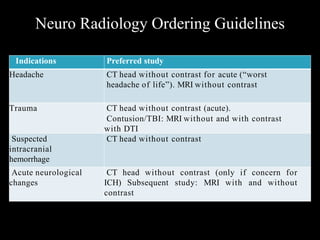


The document presents an overview of MRI sequences, their identification, and clinical significance focused on neuroimaging. It explains the principles of MRI, including pulse sequences, parameters influencing tissue contrast, and various imaging techniques like diffusion-weighted imaging and functional MRI. Key clinical applications of these sequences in diagnosing conditions such as strokes, tumors, and other neurological disorders are also discussed.


![PERI-PROSTHETIC FRACTURE NAIL-PLATE CONSTRUCT [NPC].pptx](https://cdn.slidesharecdn.com/ss_thumbnails/drarunkumardrmohamedashrafperiprostheticfrasturenail-plateconstructnpc-260209164459-7e9d15a1-thumbnail.jpg?width=640&height=640&fit=bounds)


![CTEV [ clubfoot] DR ARUN LAL ,DR MOHAMED ASHRAF travancore medical college k...](https://cdn.slidesharecdn.com/ss_thumbnails/ctevclubfootdrarunlaldrmohamedashraftravancoremedicalcollegekollamkeralaindia-260208063247-18fc466c-thumbnail.jpg?width=640&height=640&fit=bounds)


