Download as PDF, PPTX


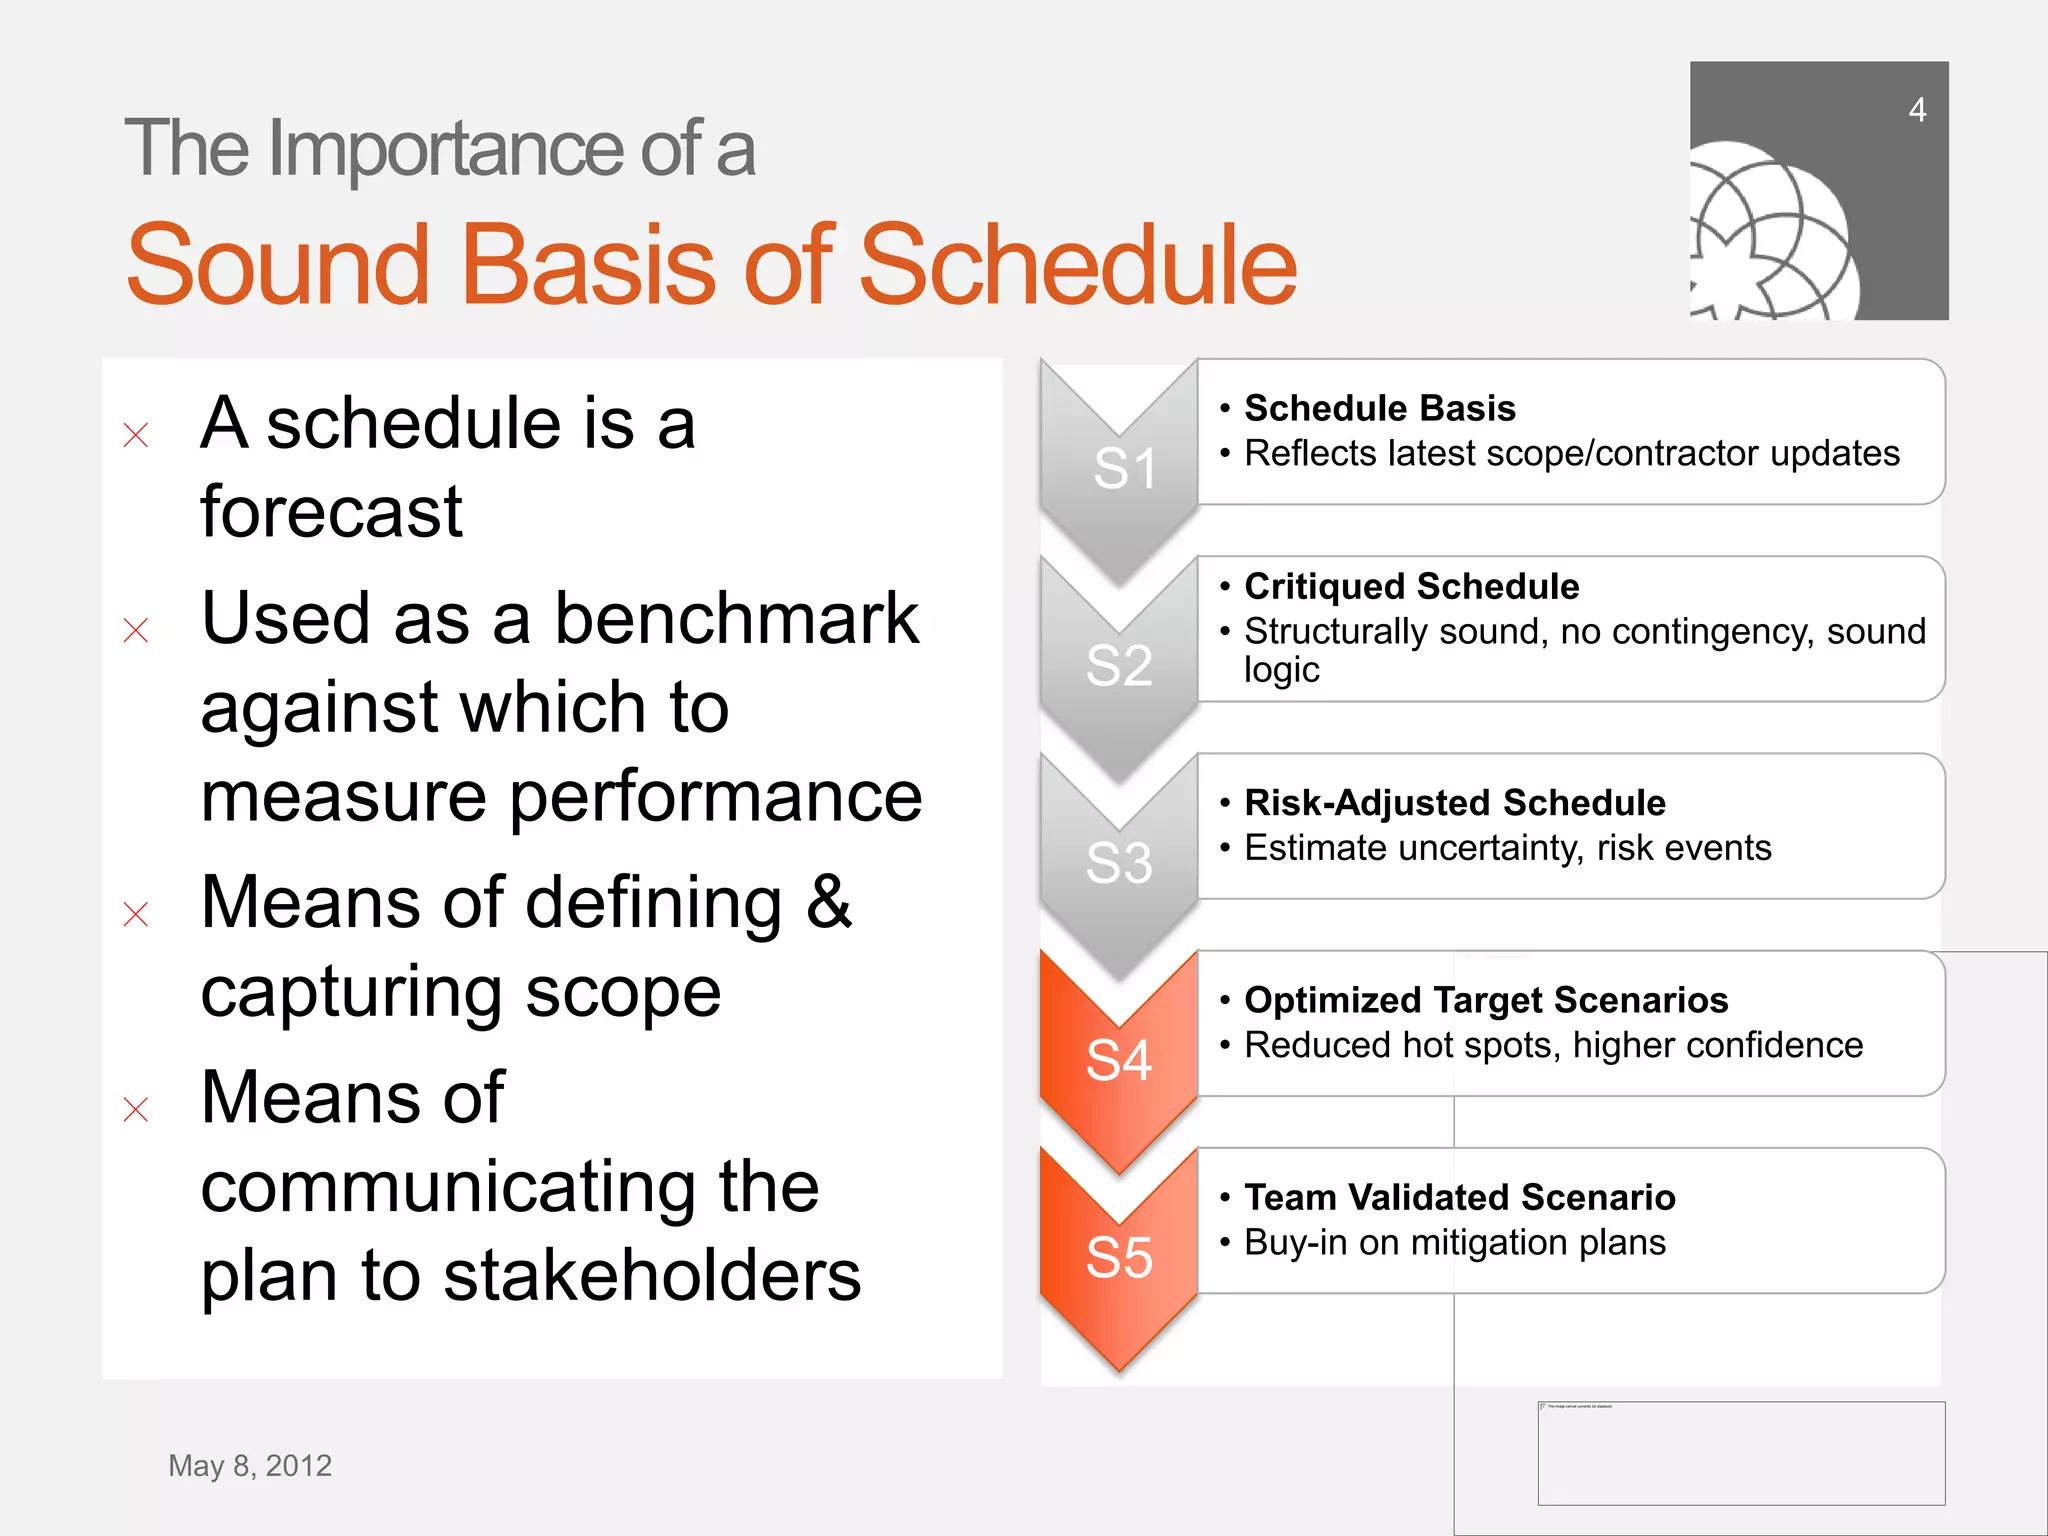
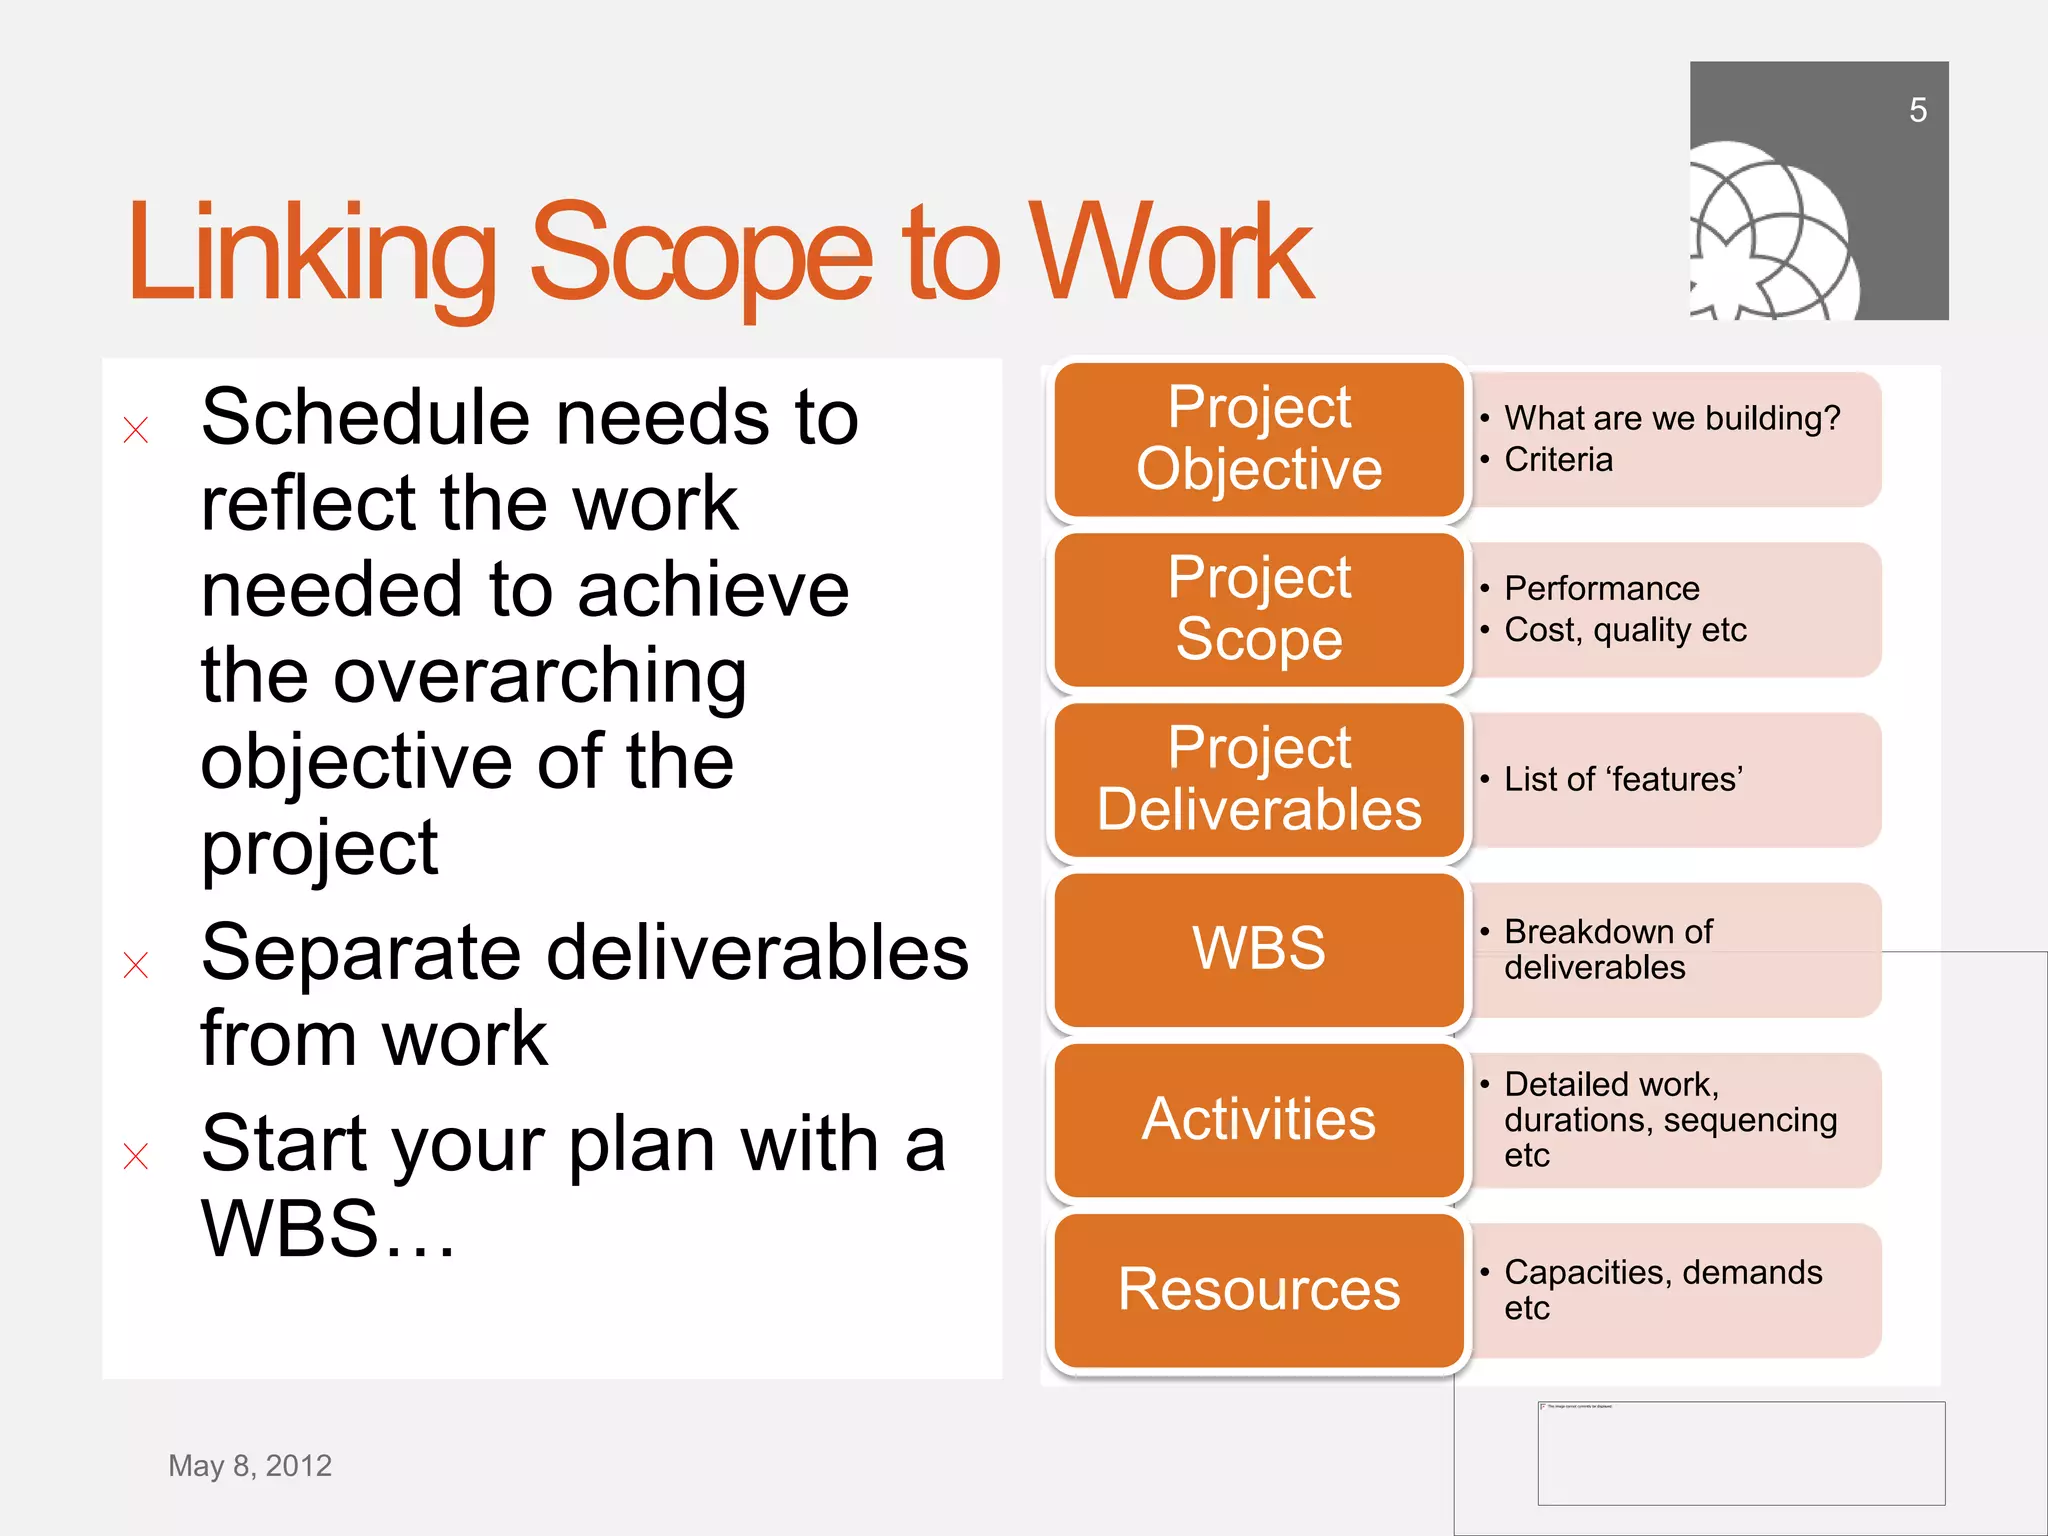
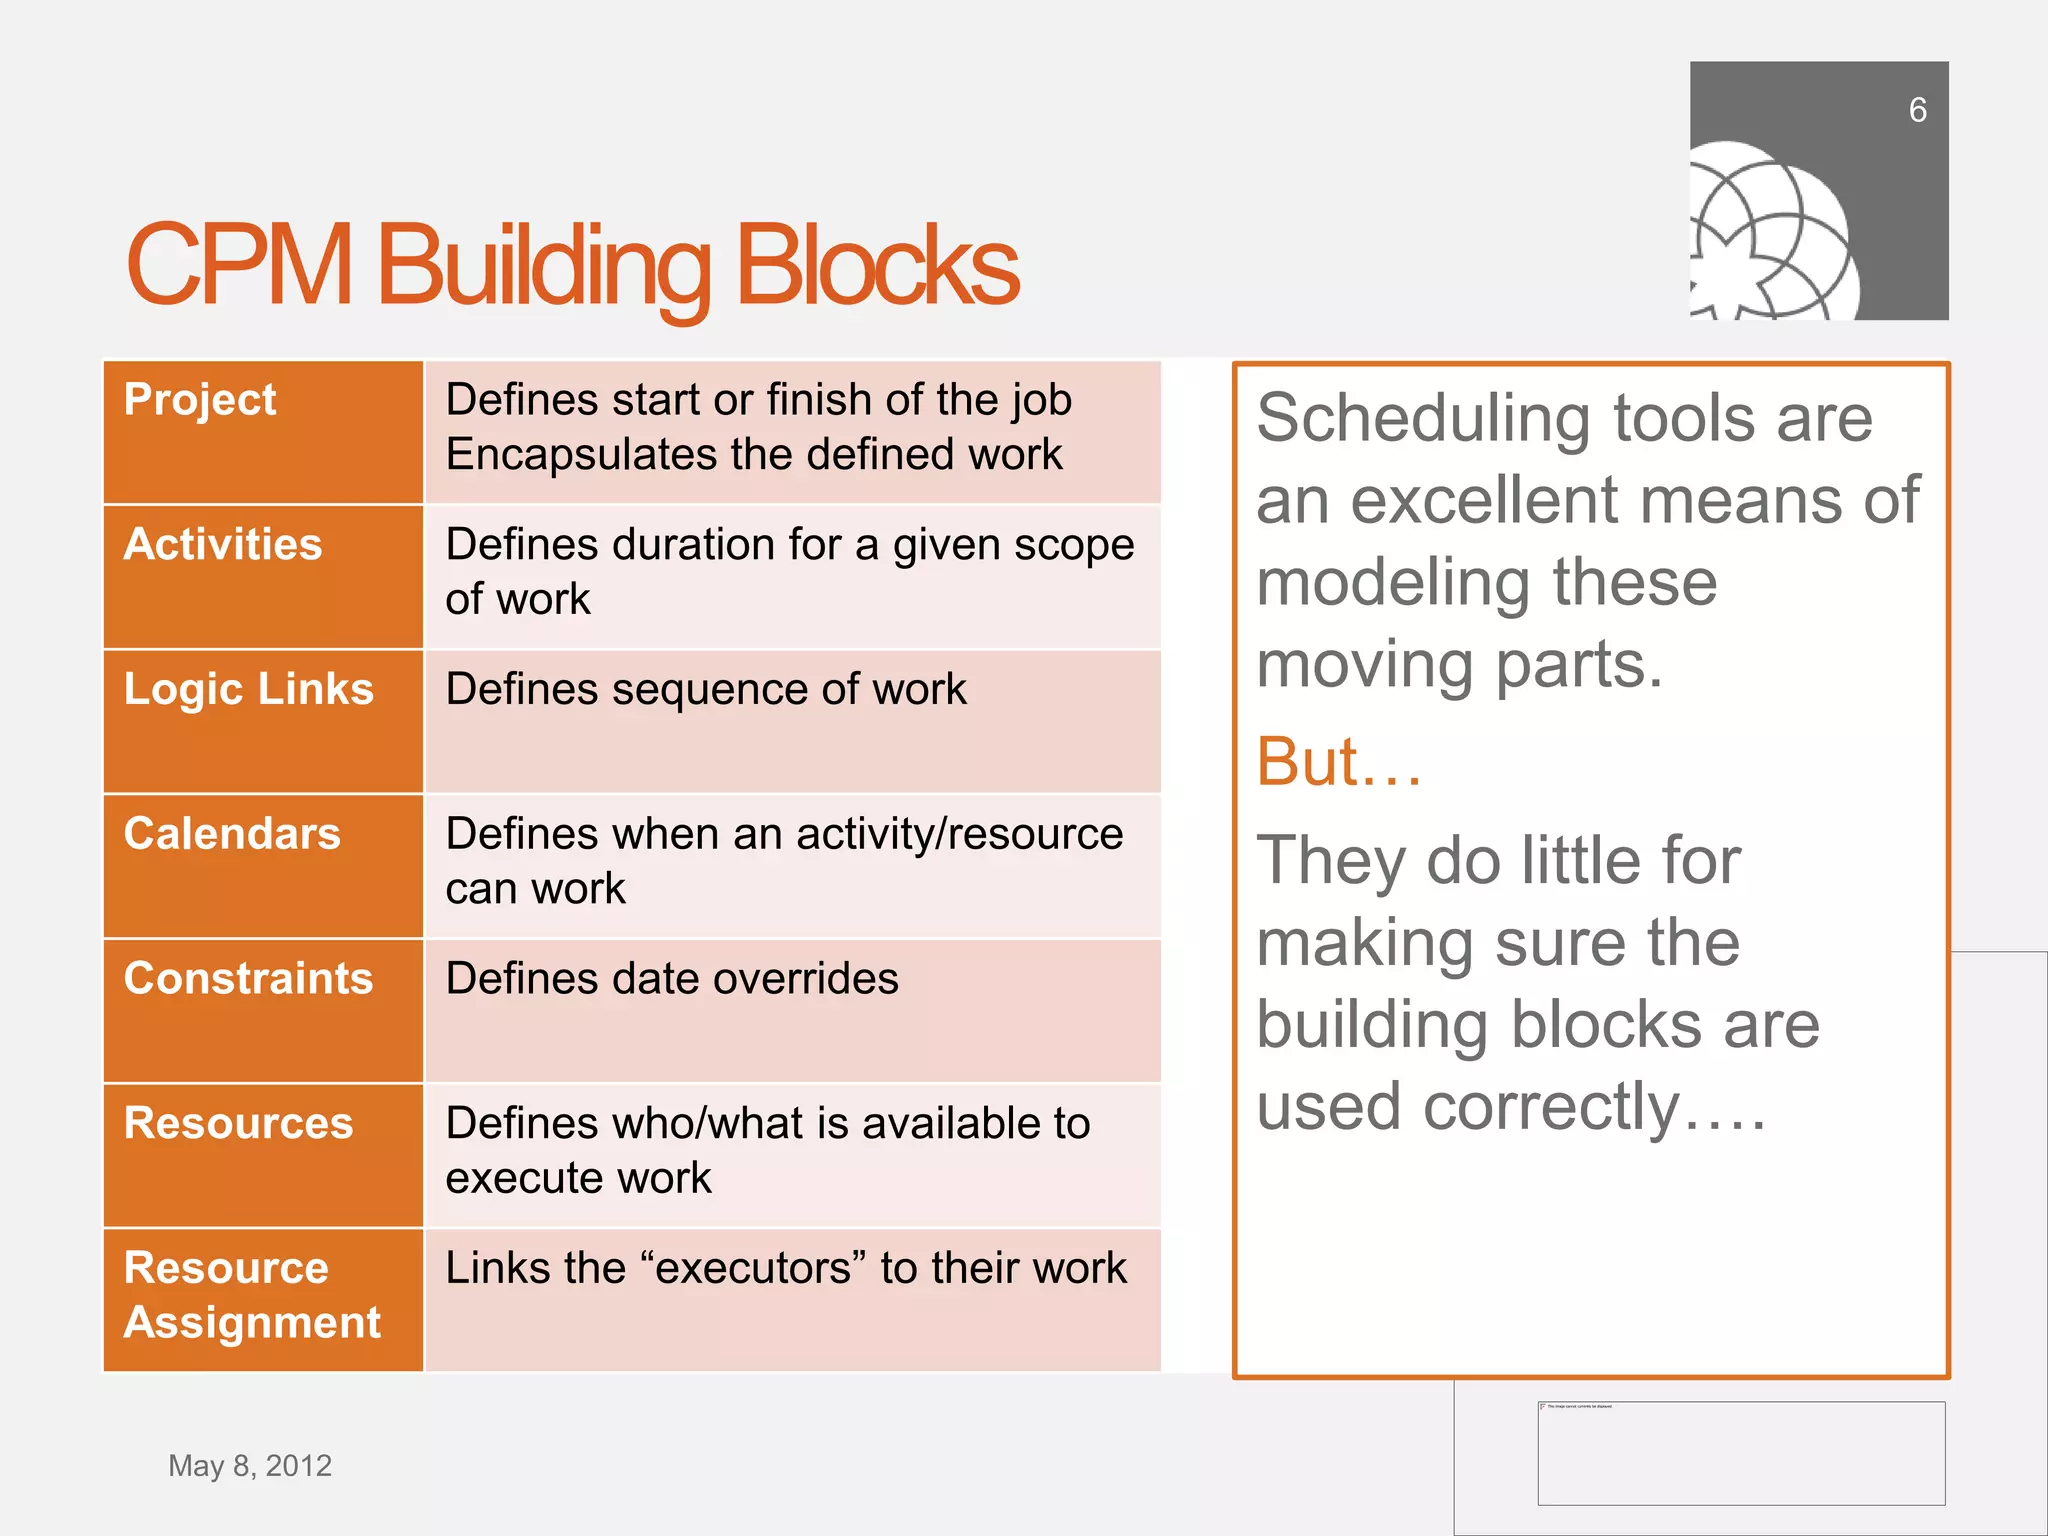


The document discusses the importance of building a sound schedule in project management using schedule metric analysis, emphasizing a robust schedule basis that reflects project scope and performance. It introduces key metrics and analysis tools to assess schedule quality, execution, and forensics, highlighting industry standards and compliance metrics. The conclusion stresses that effective scheduling tools and objective metric analysis are essential for ensuring project success.


