Download as PDF, PPTX

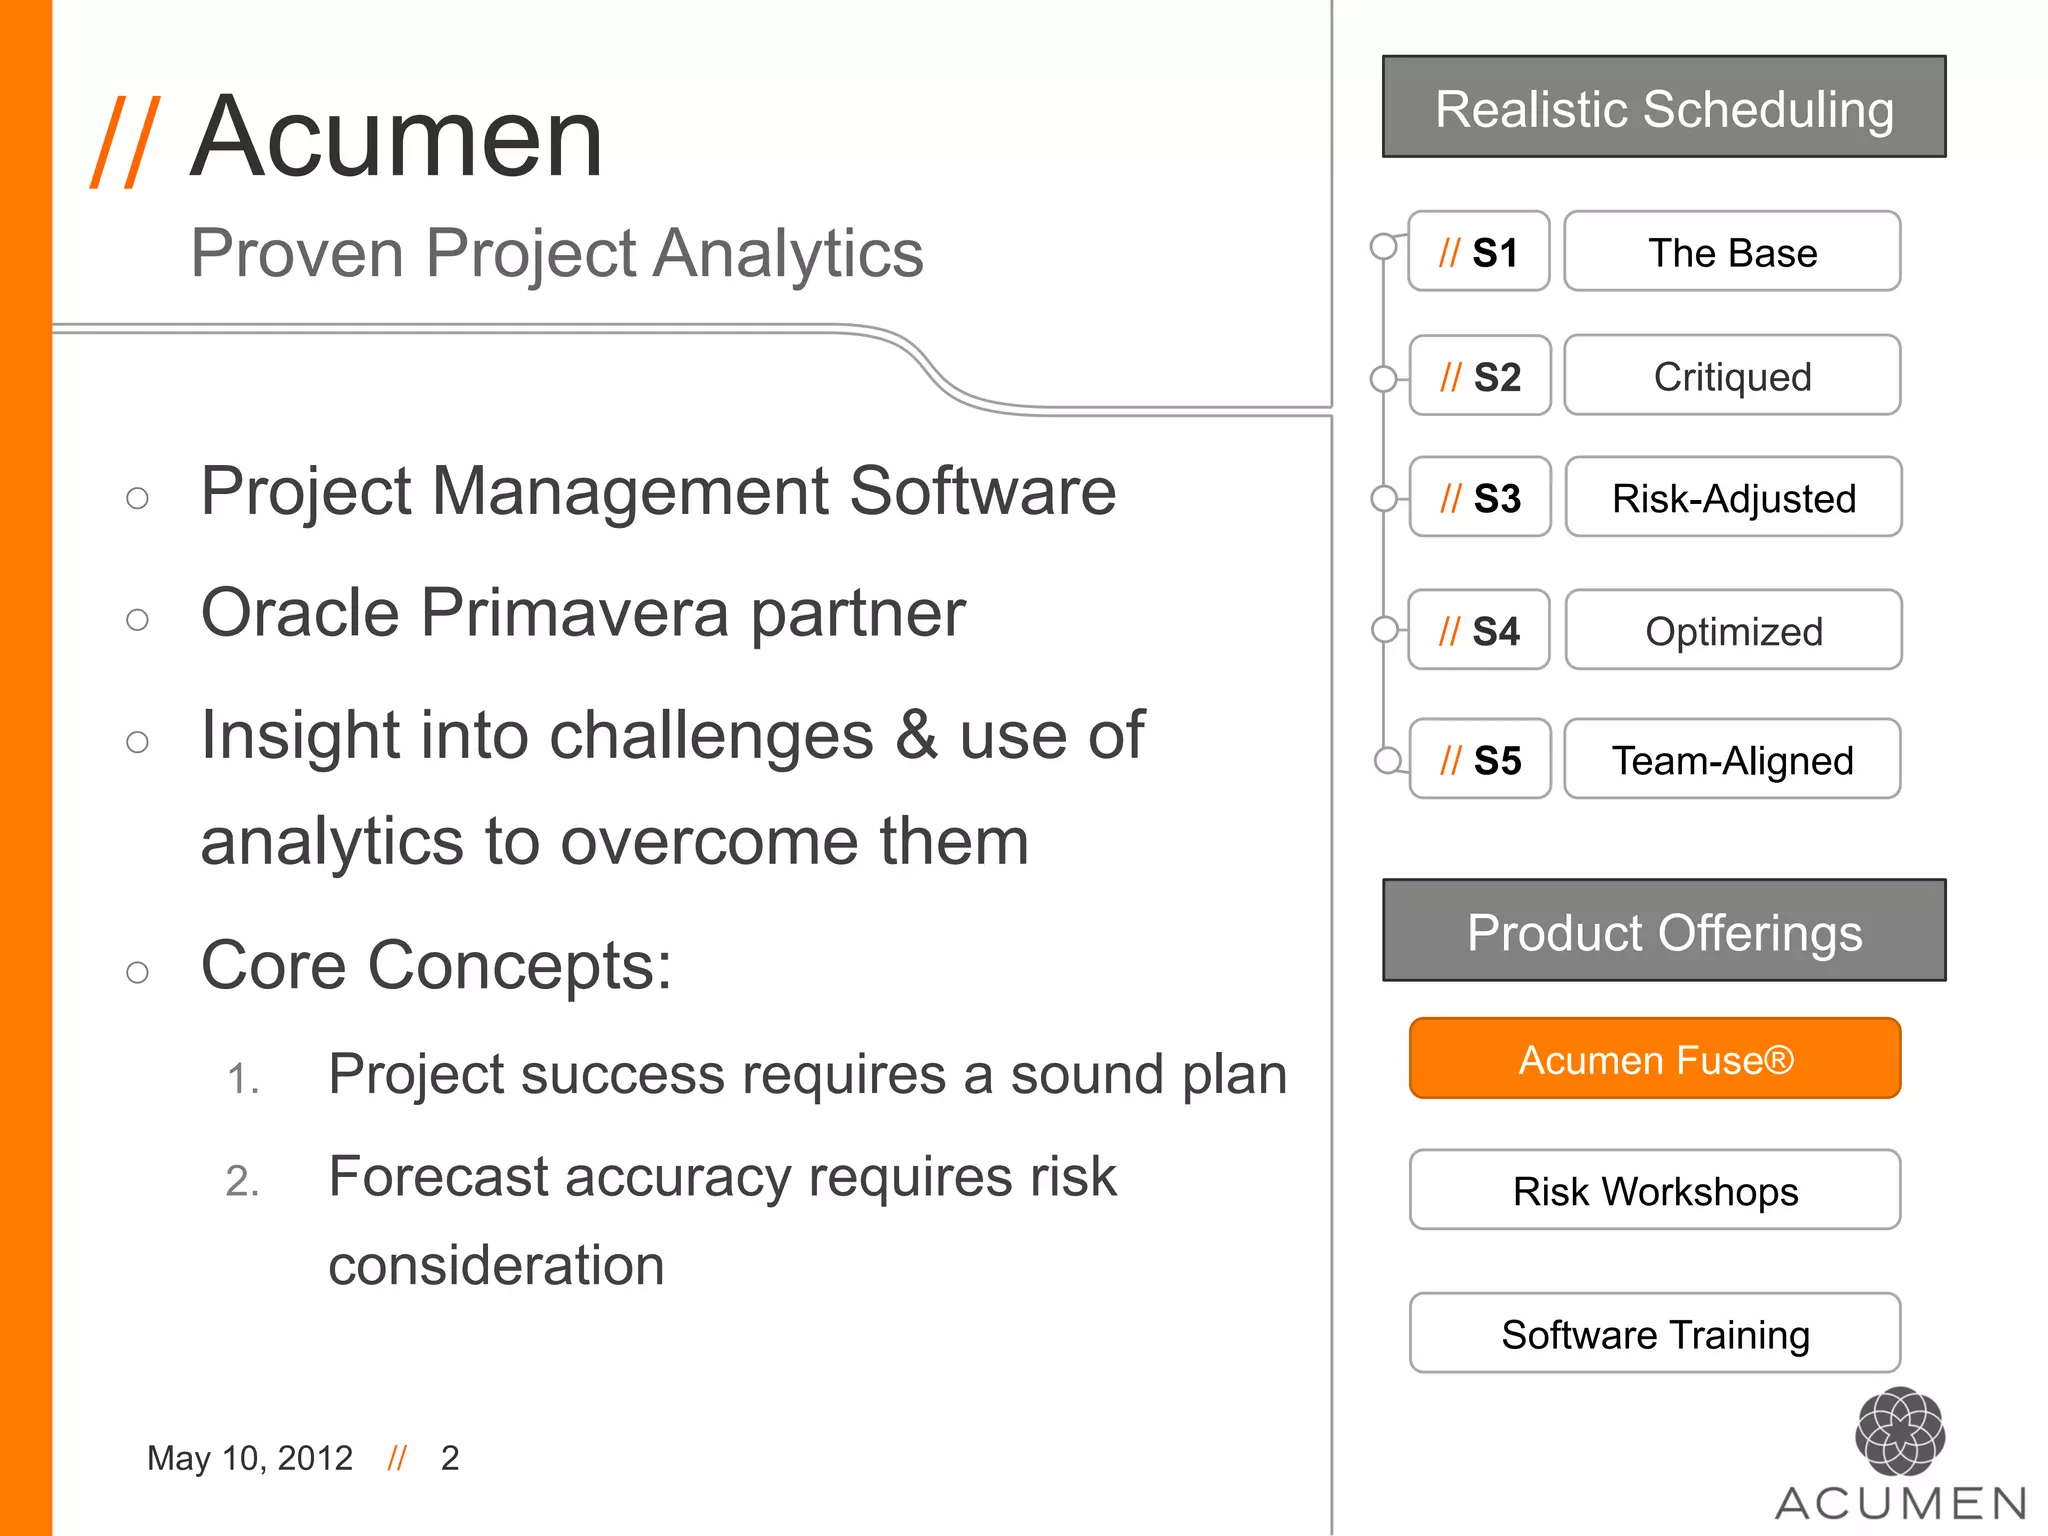
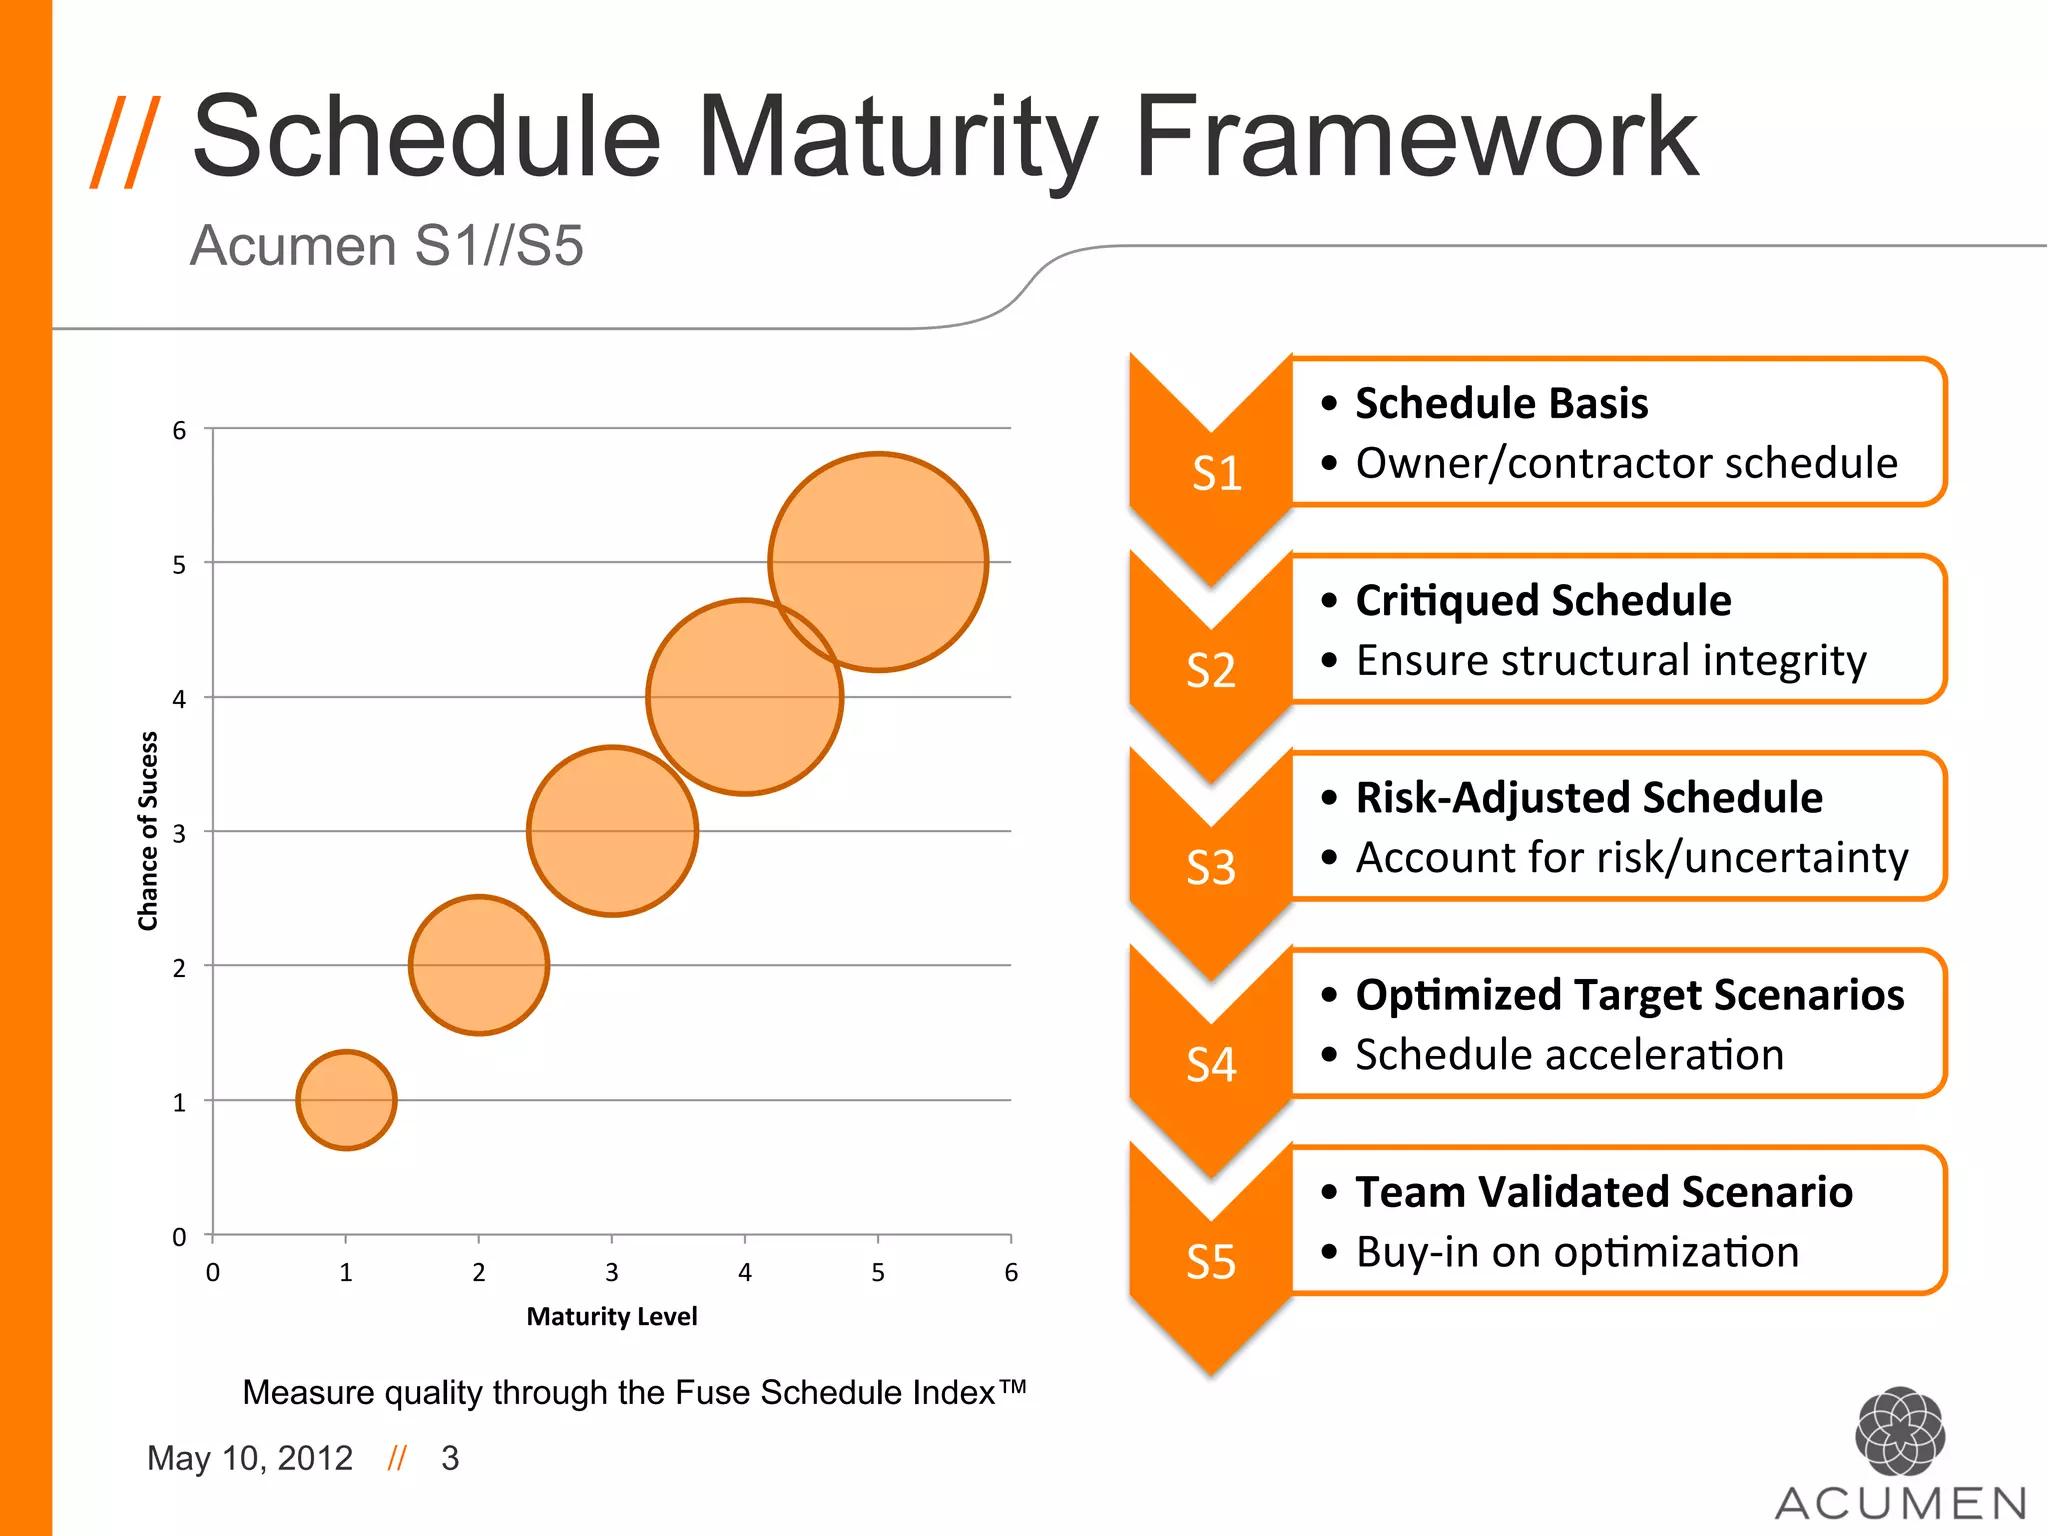
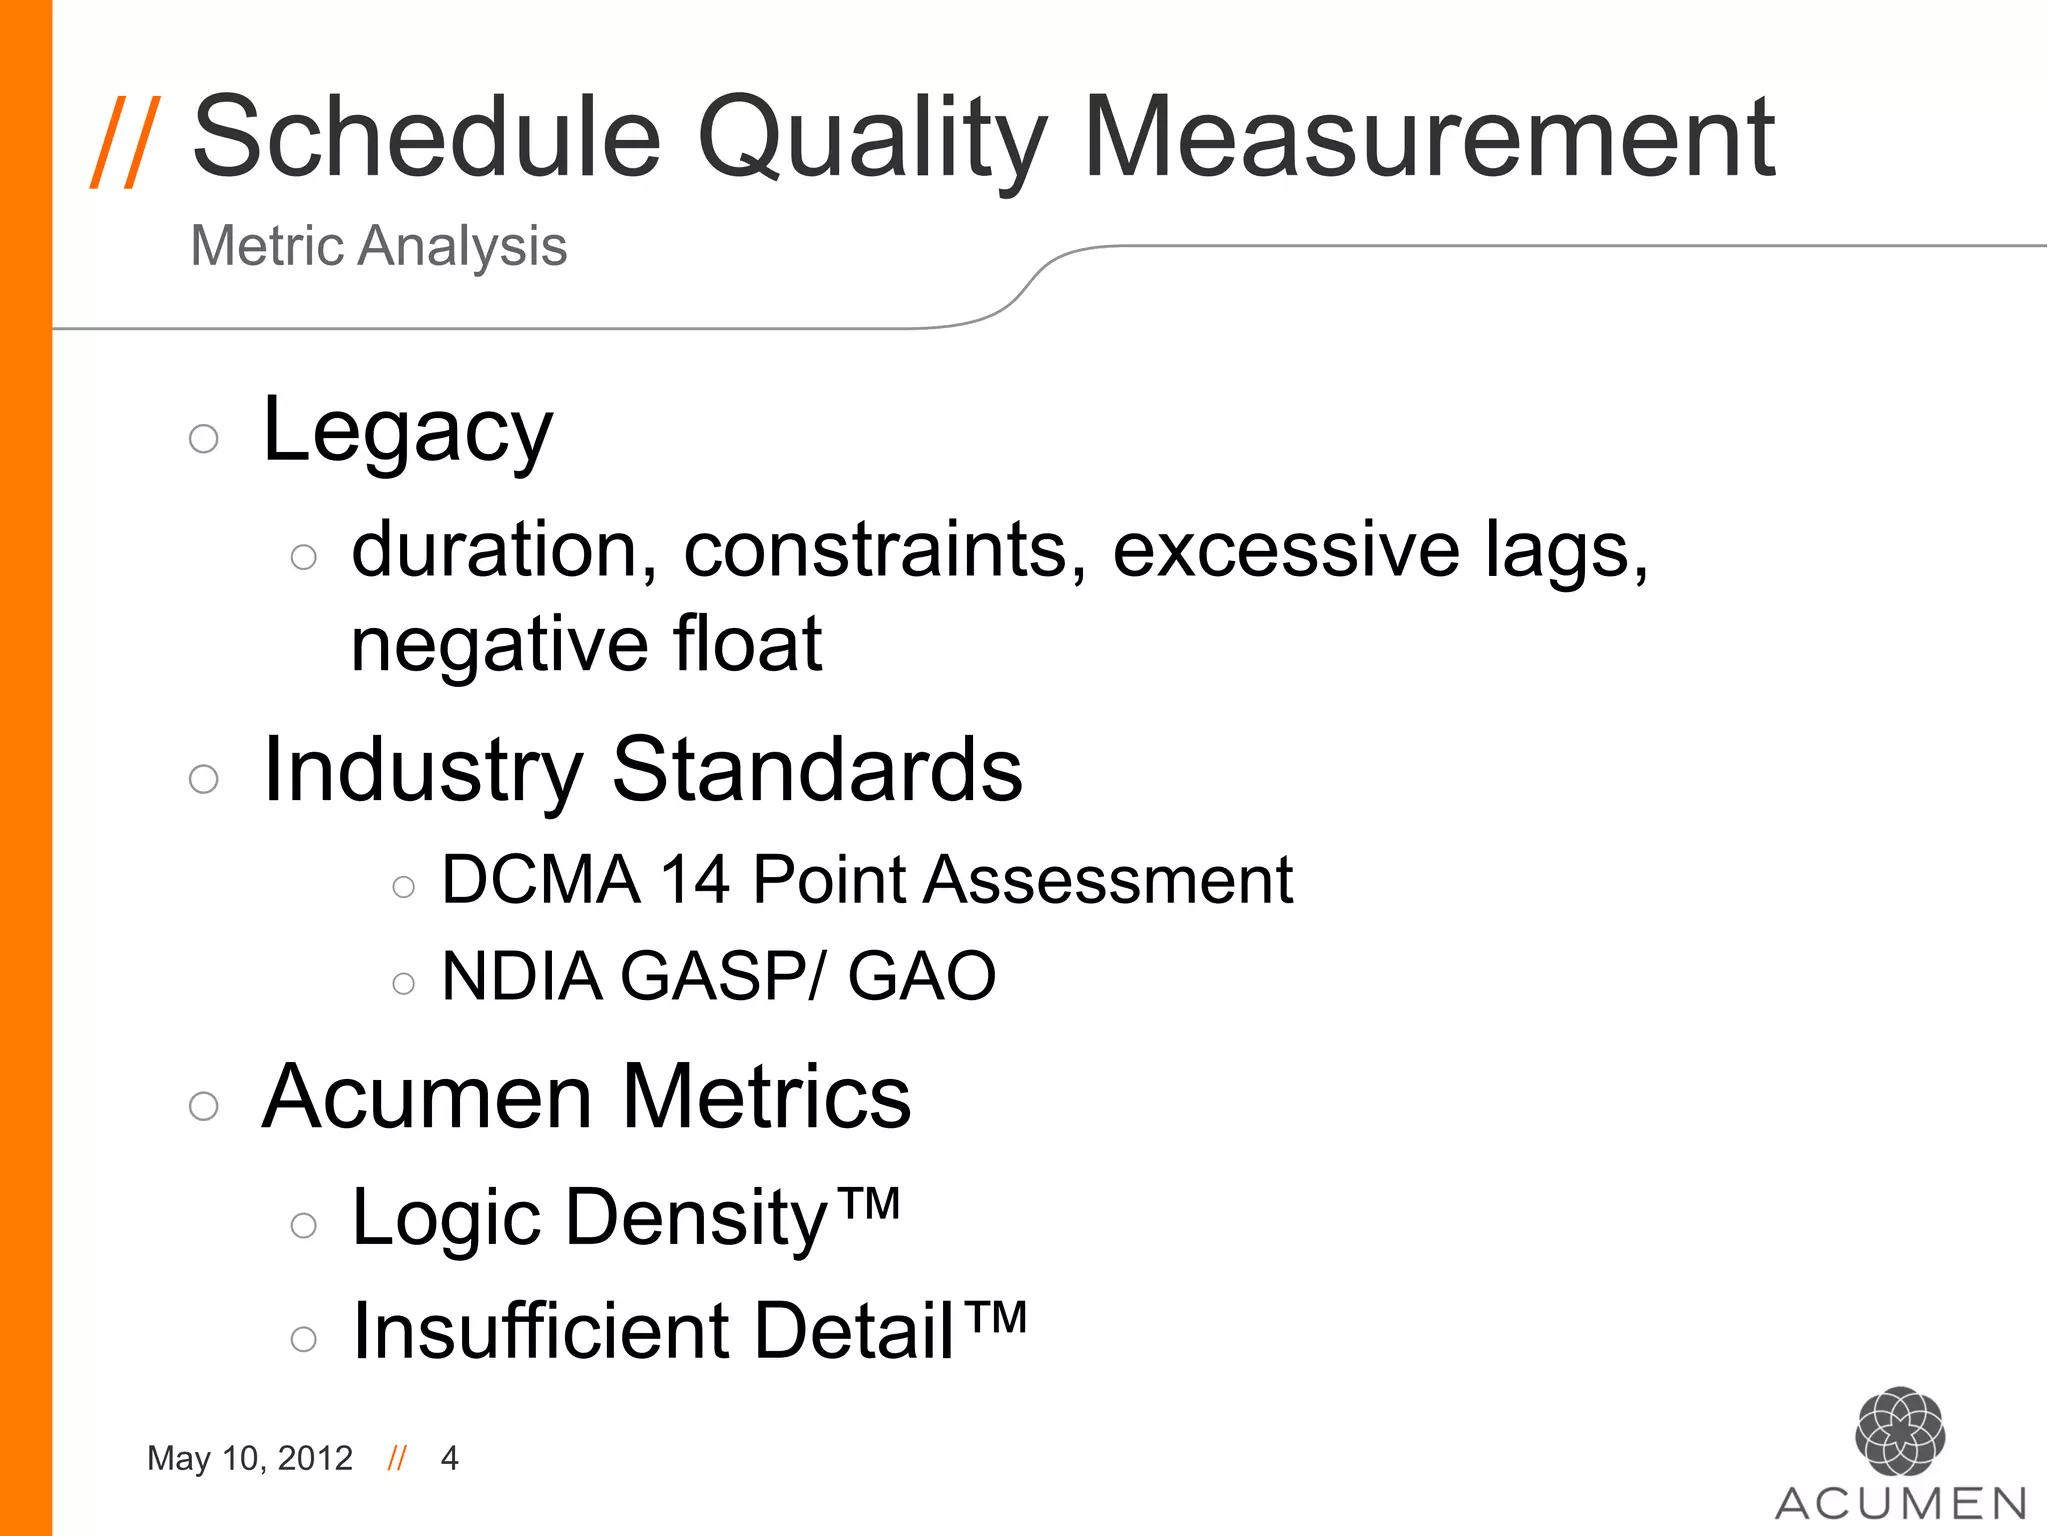
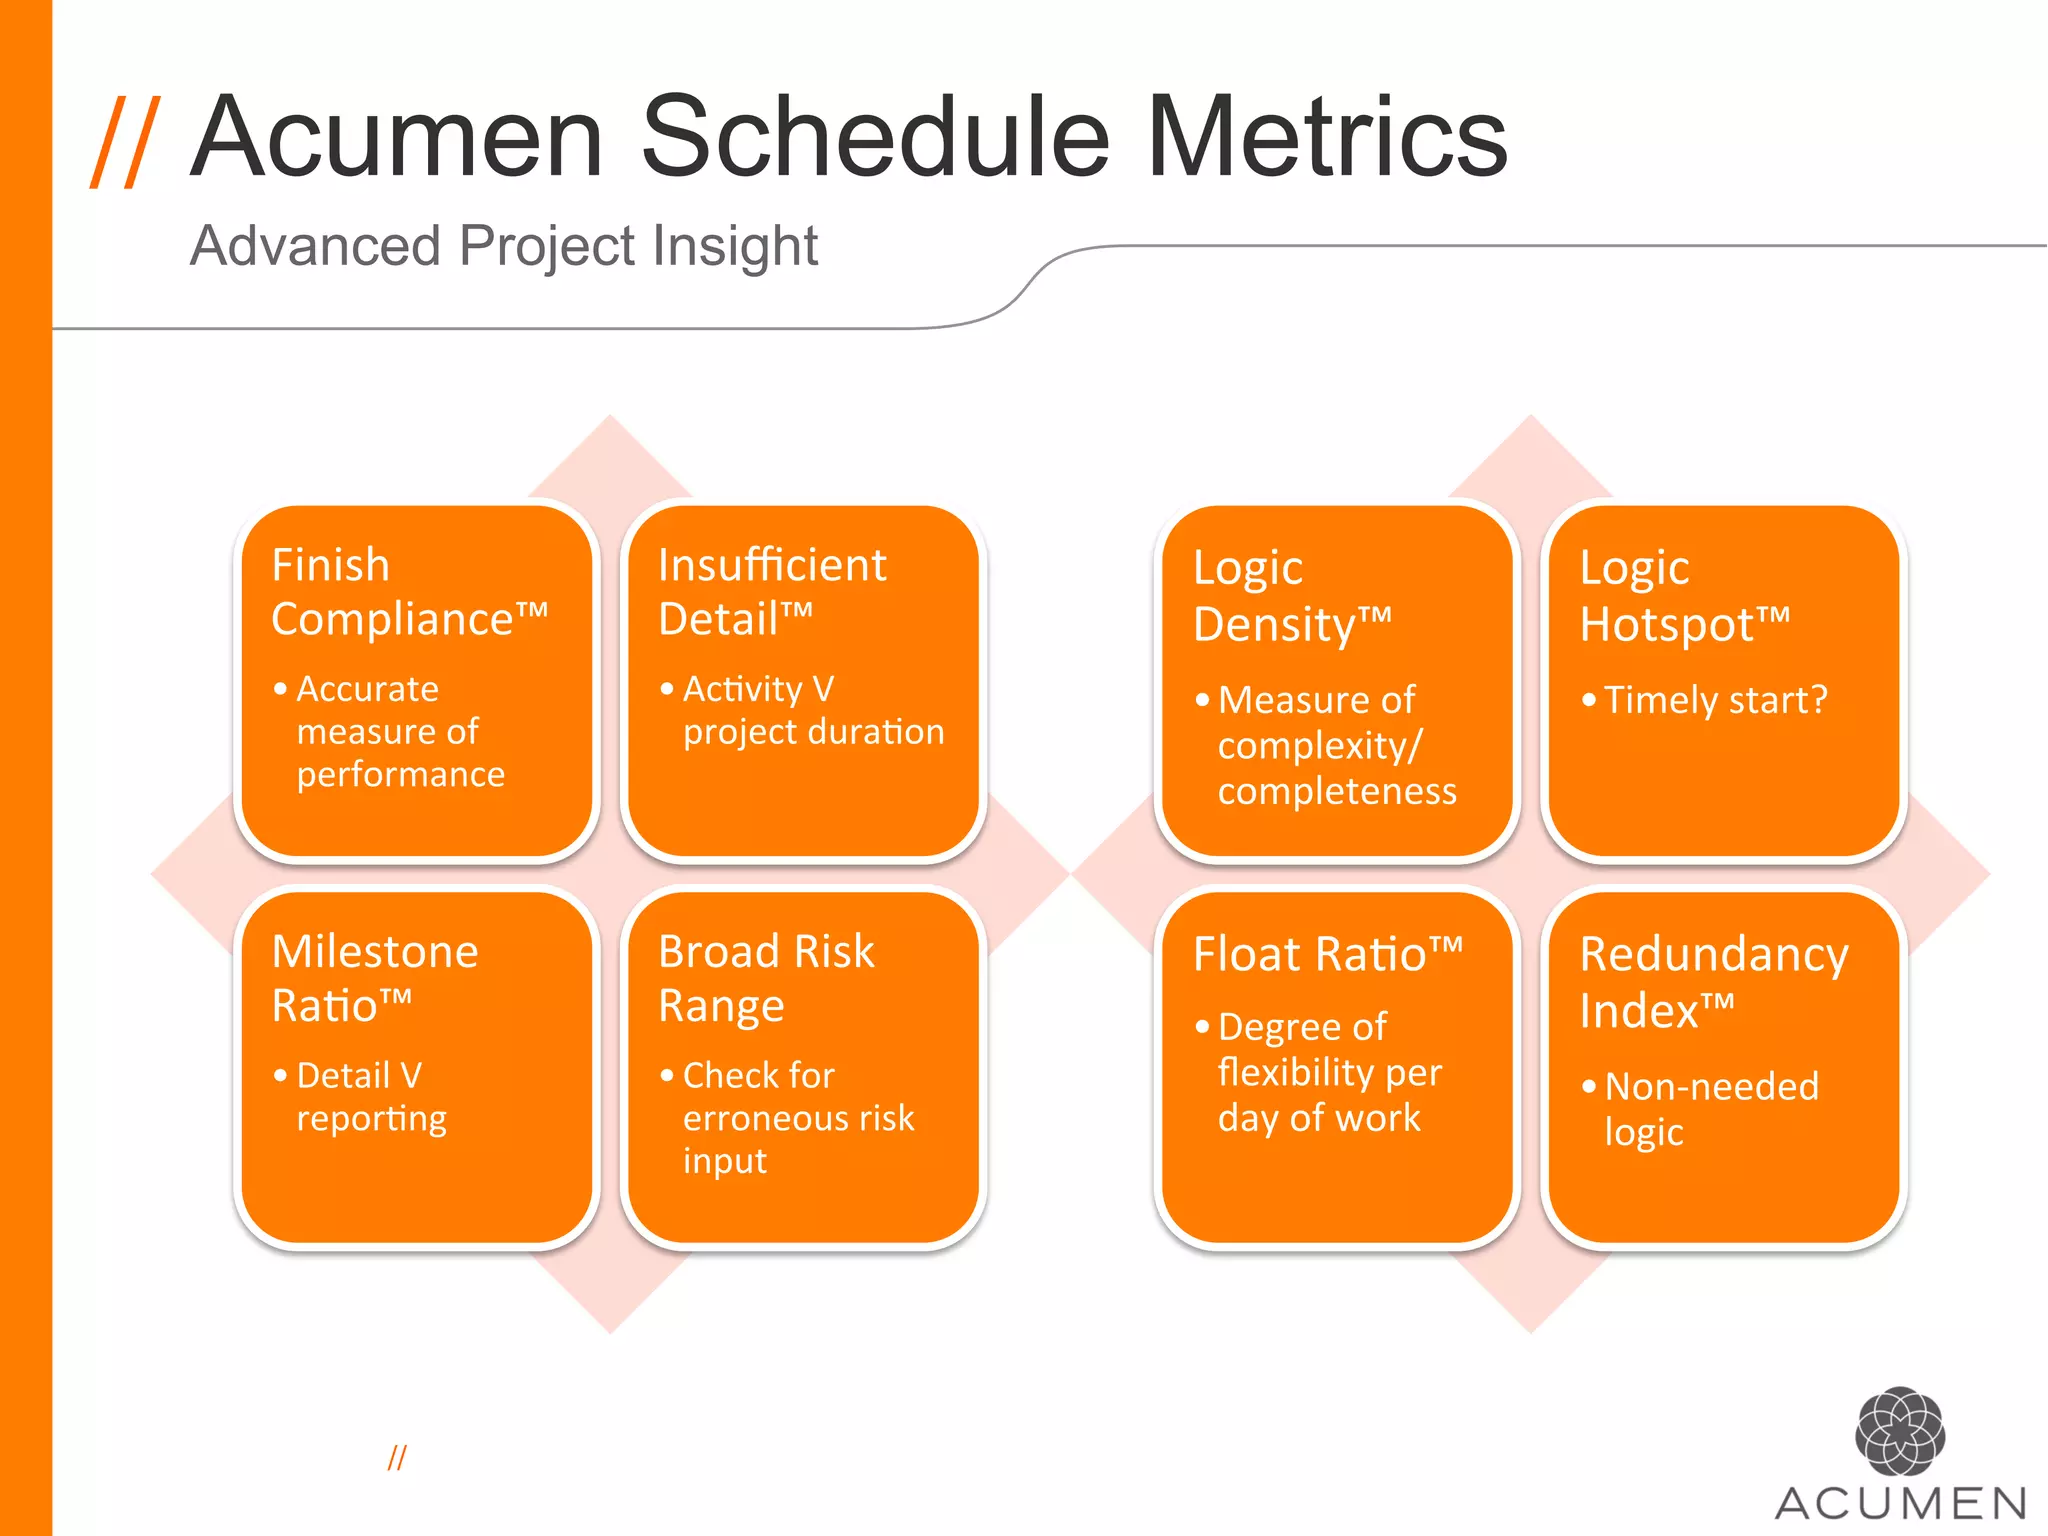

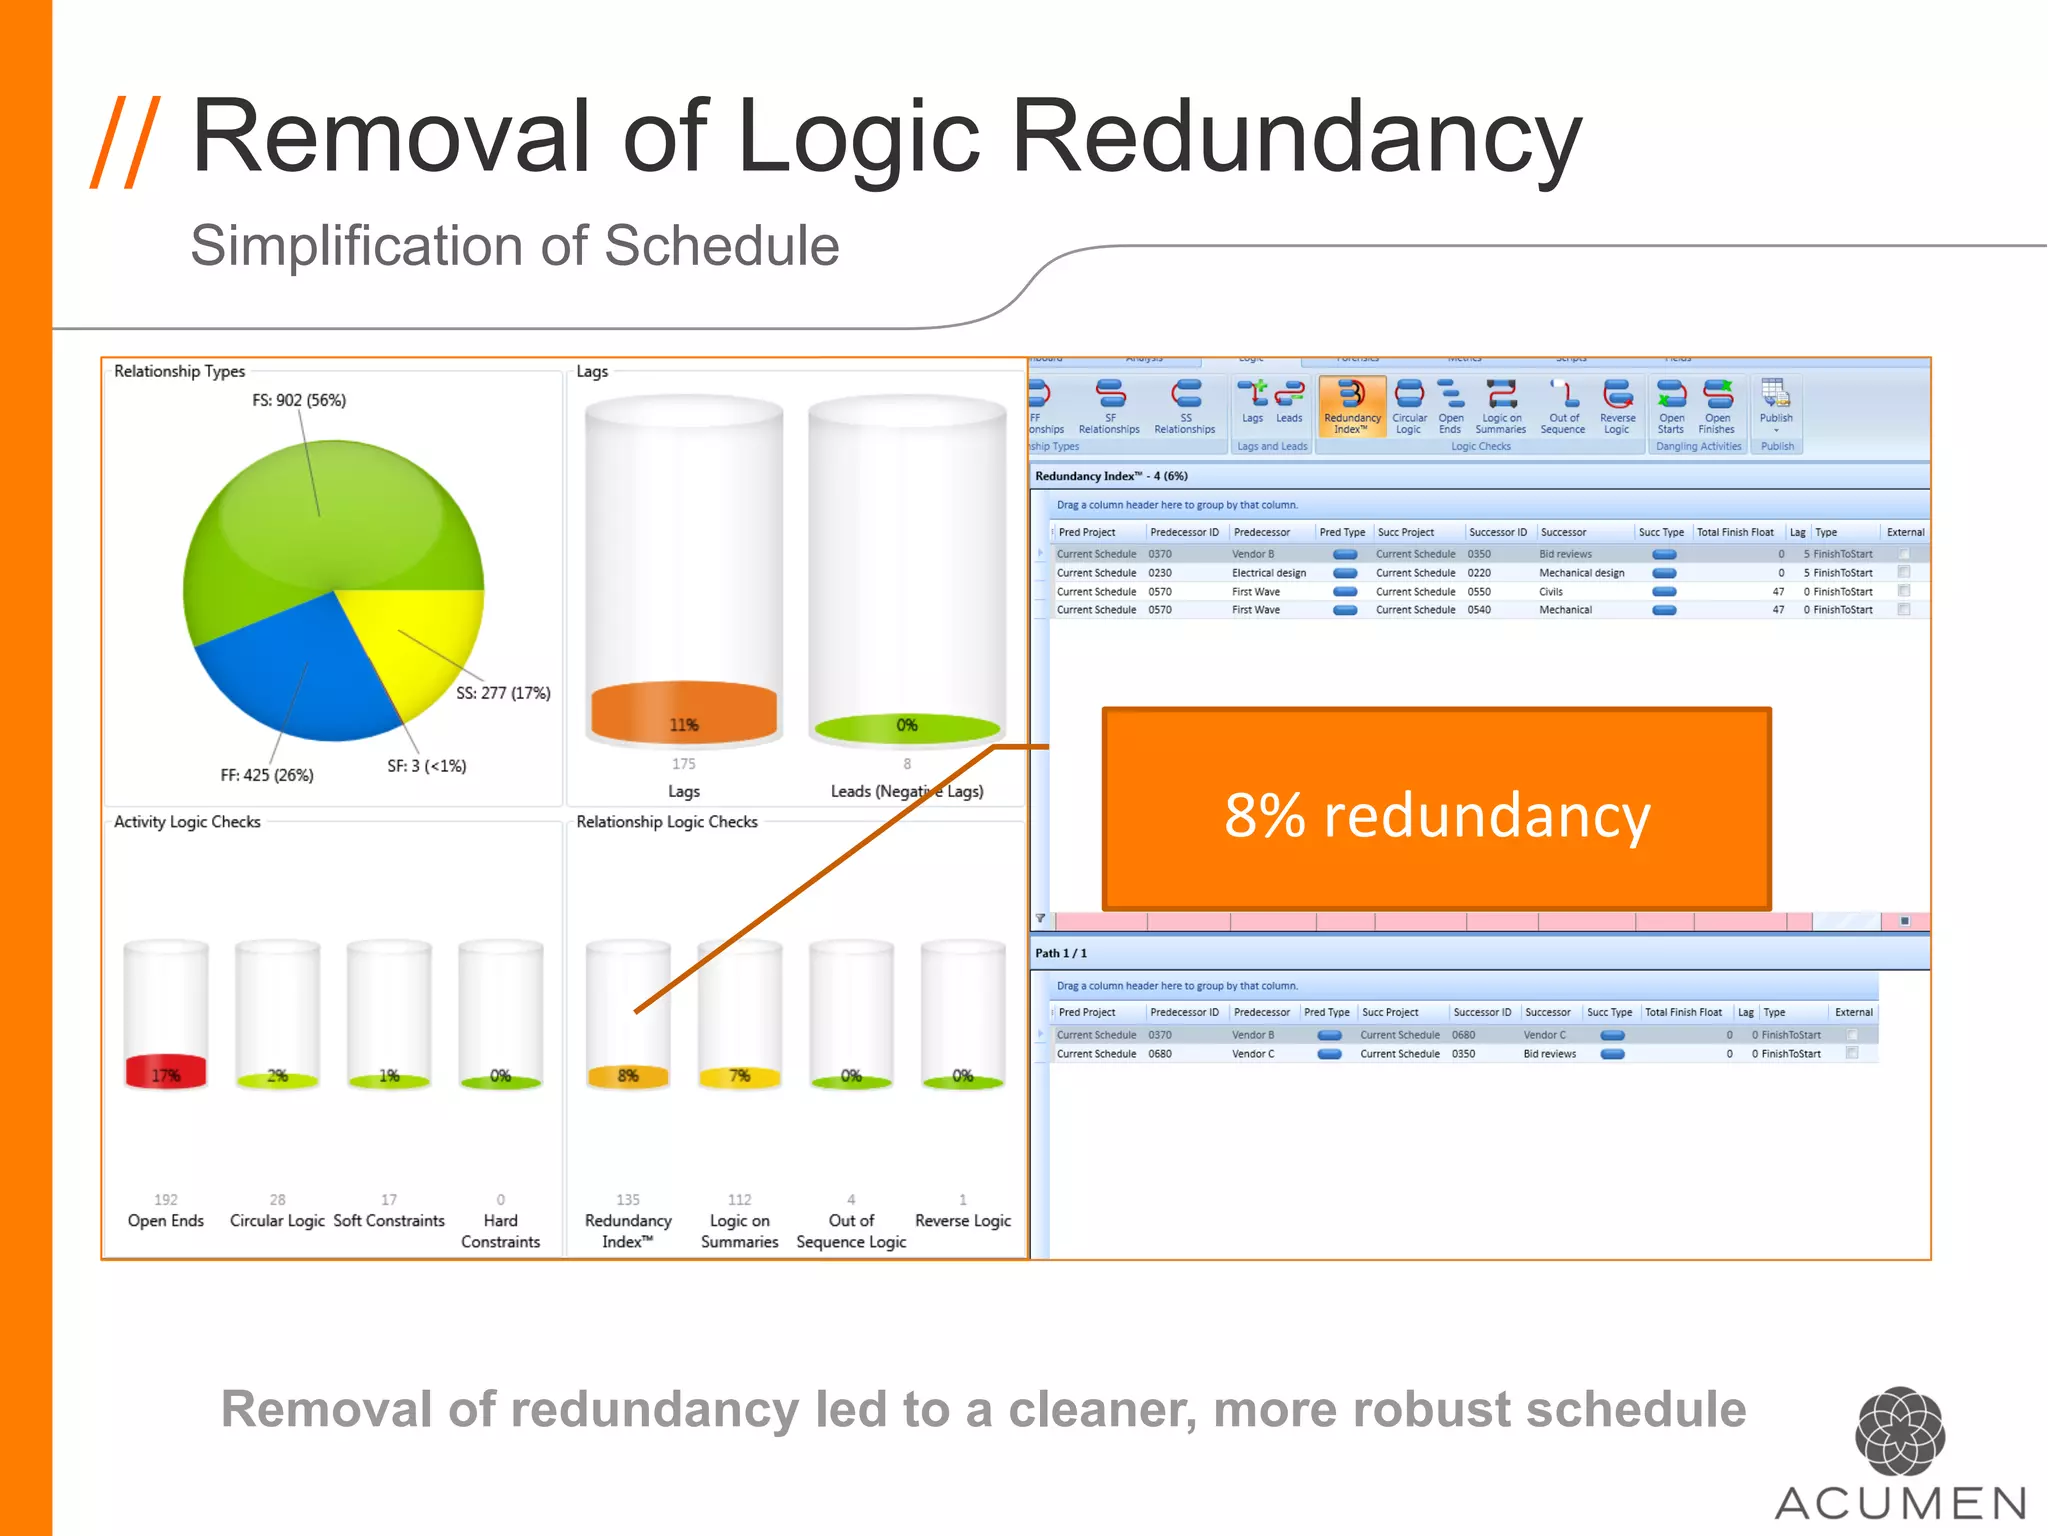
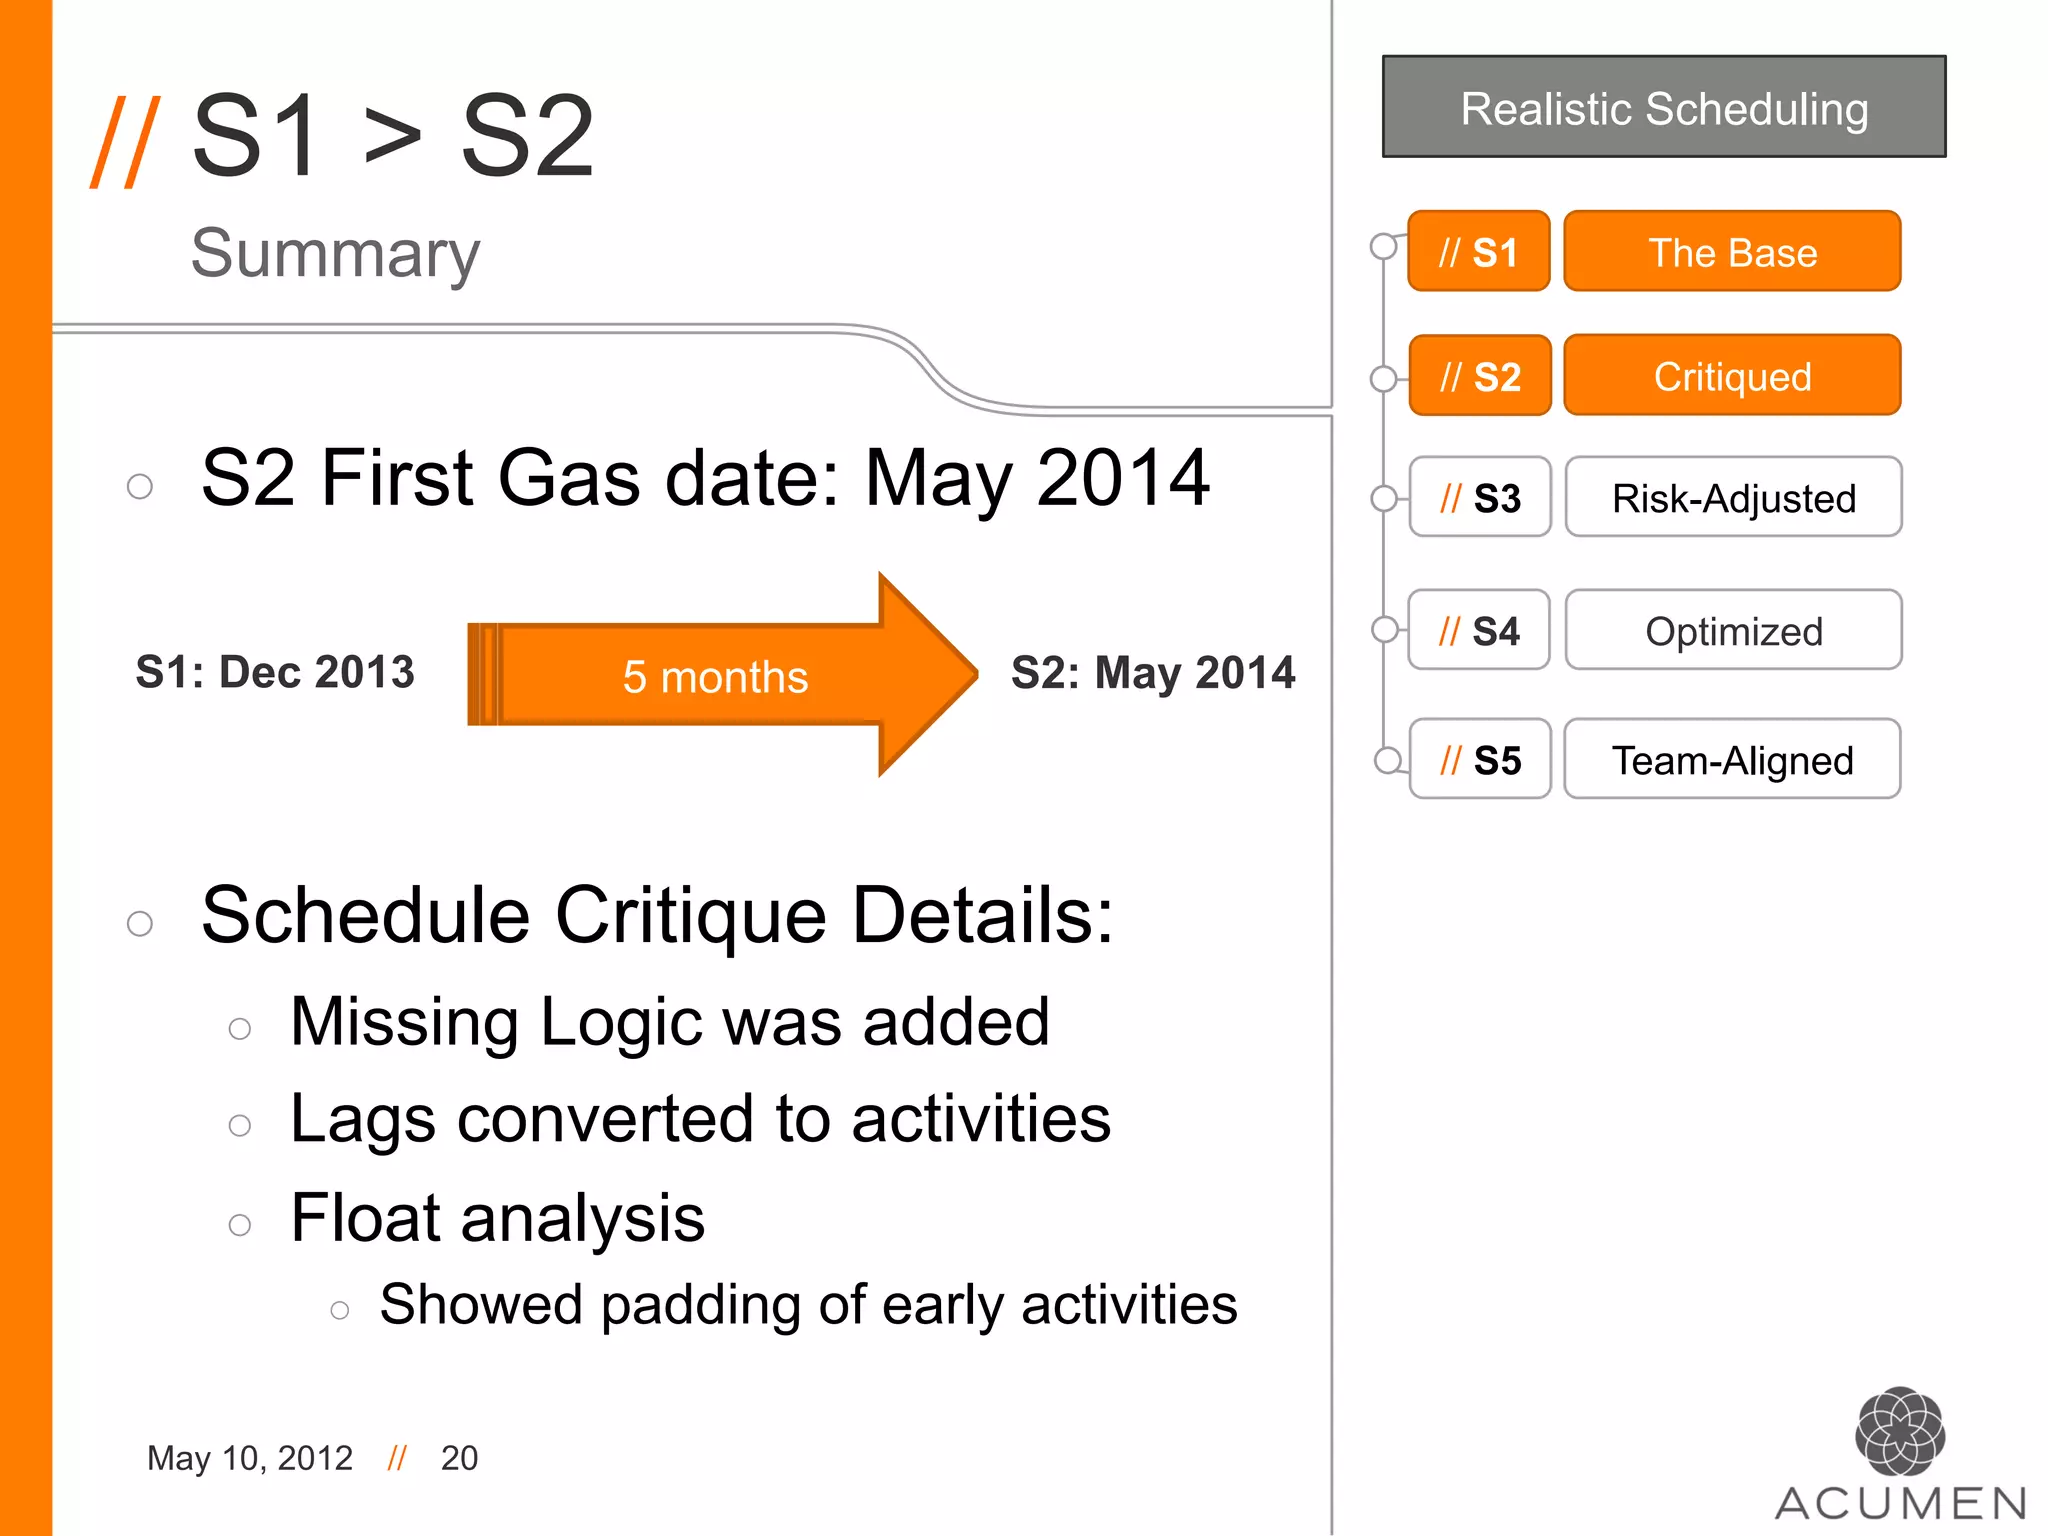
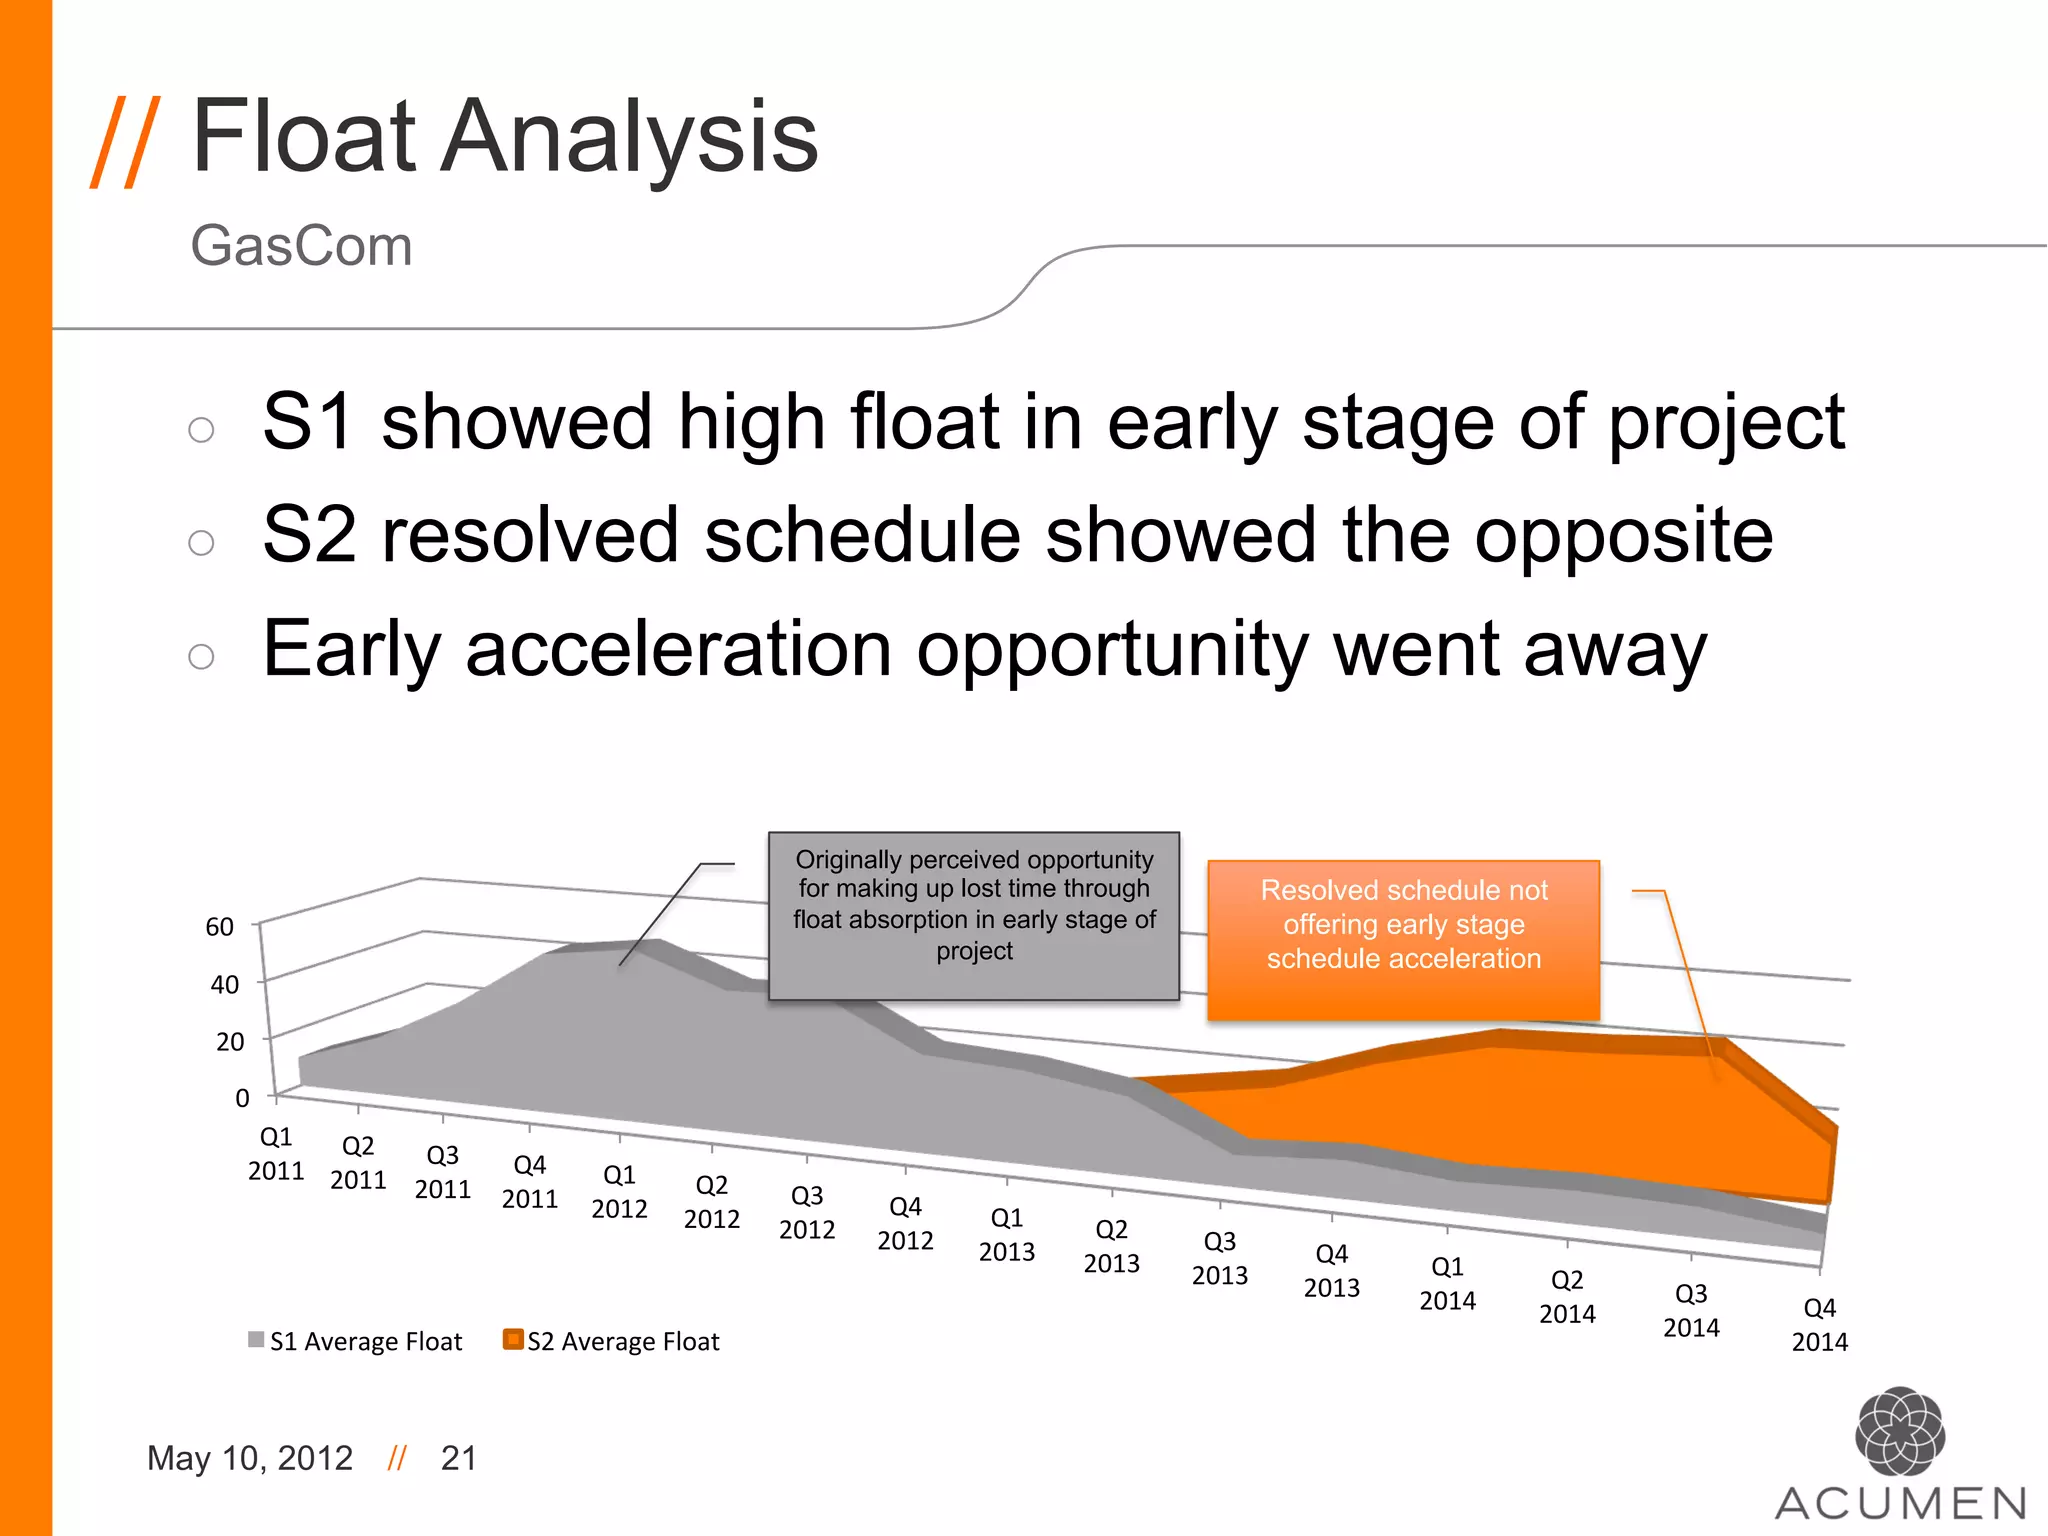
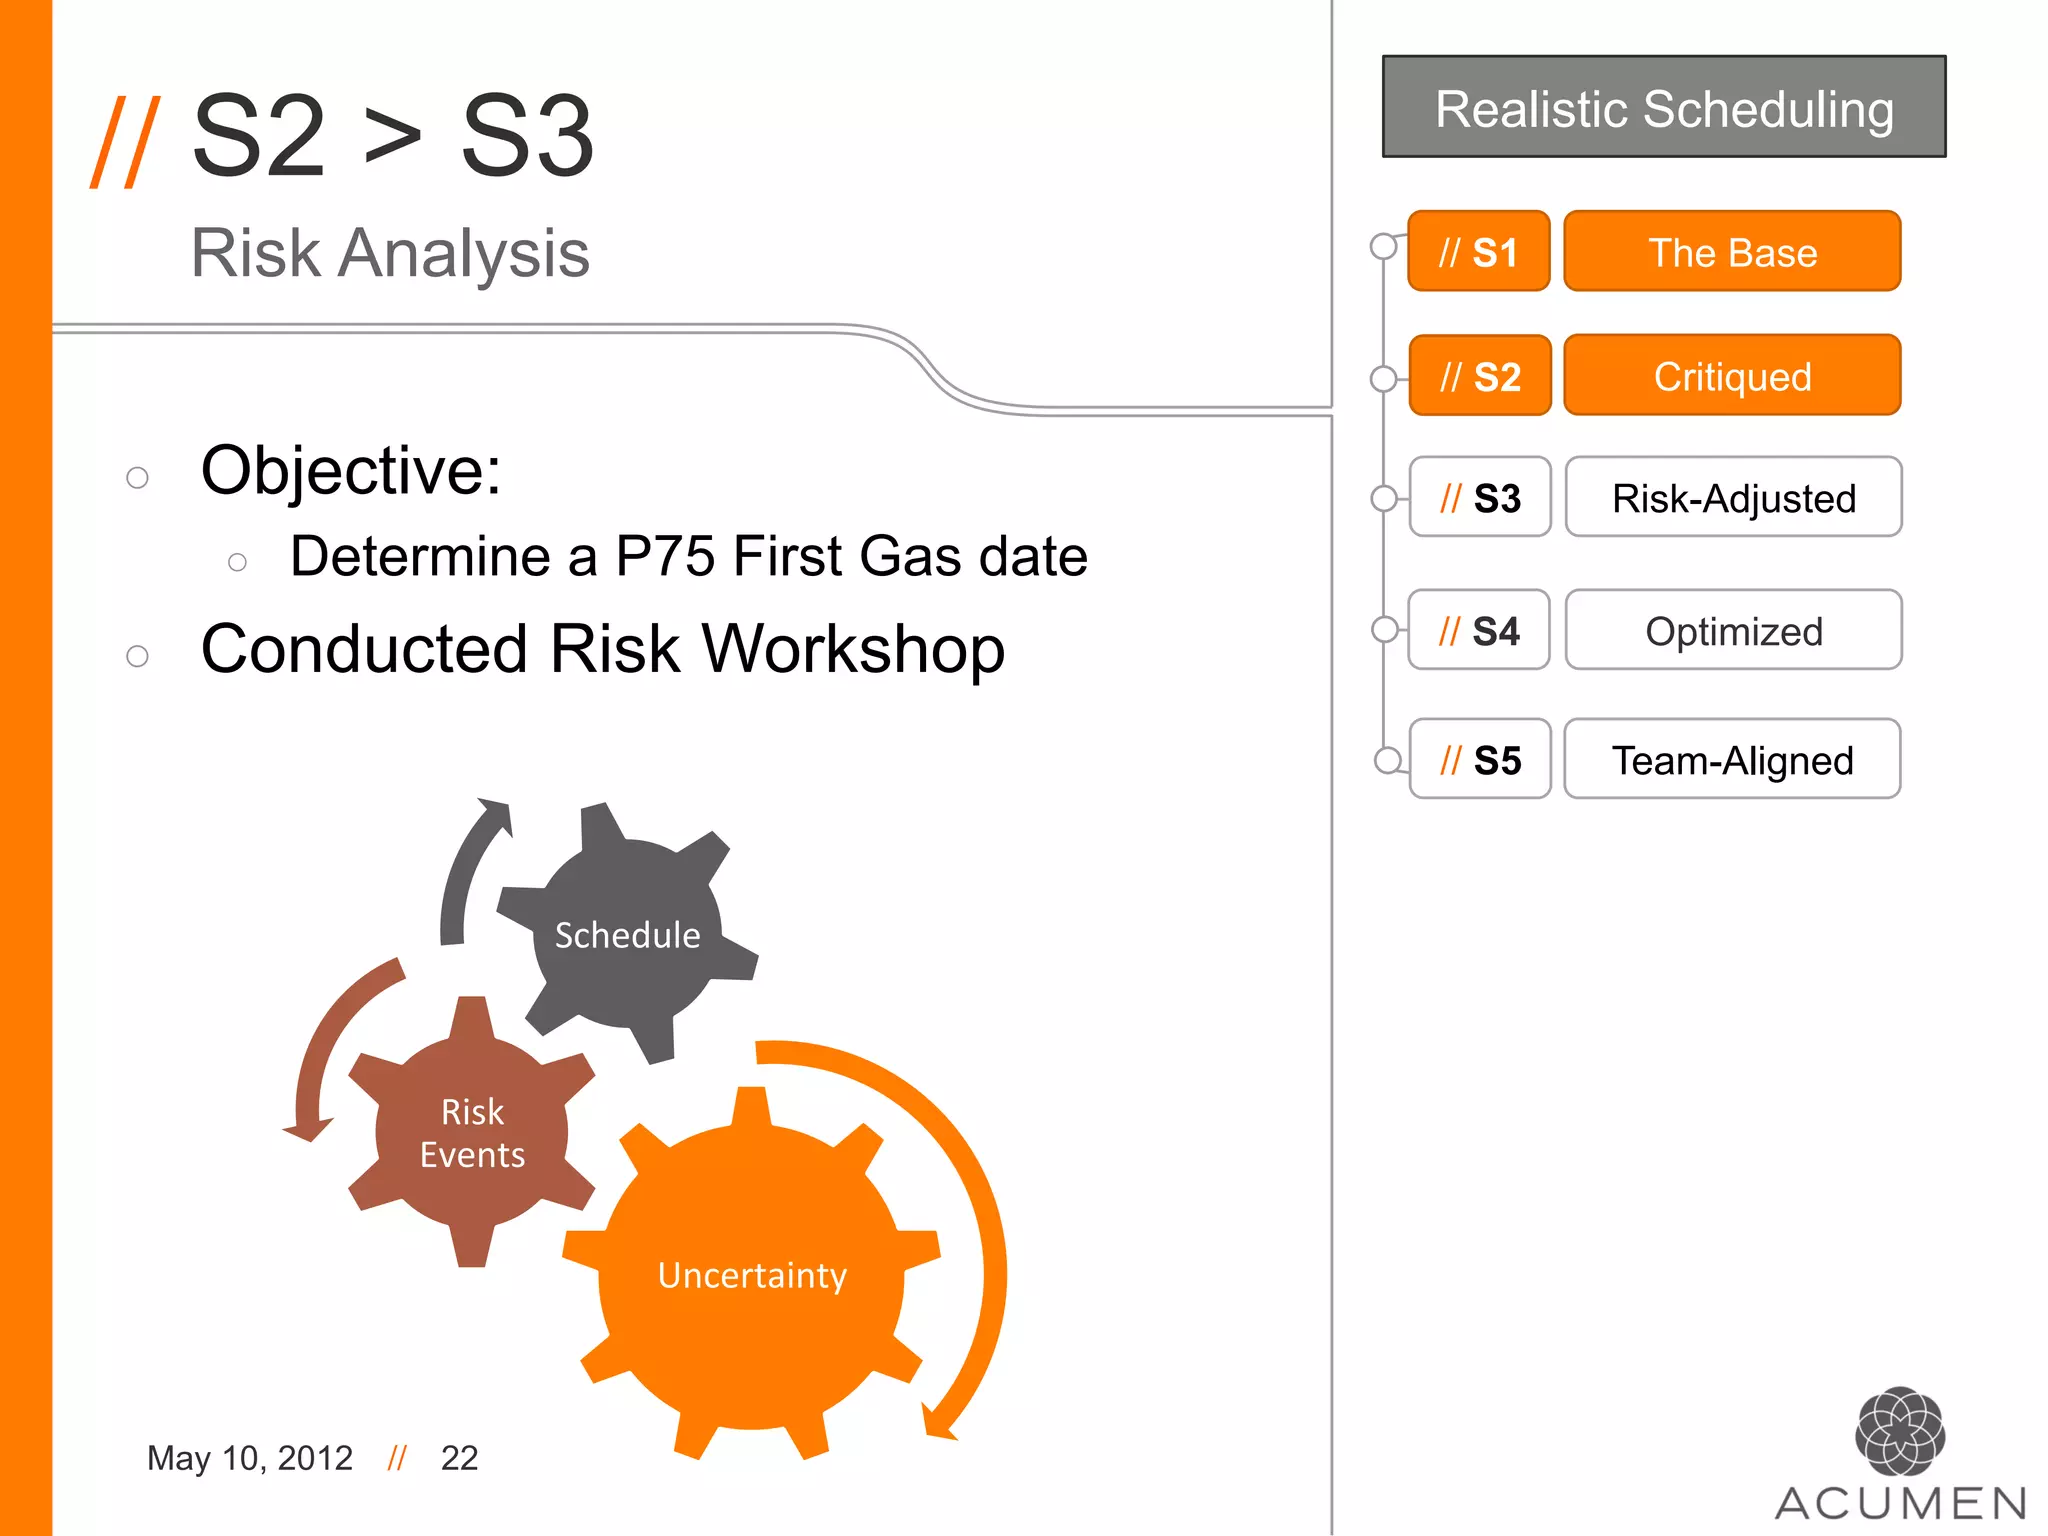
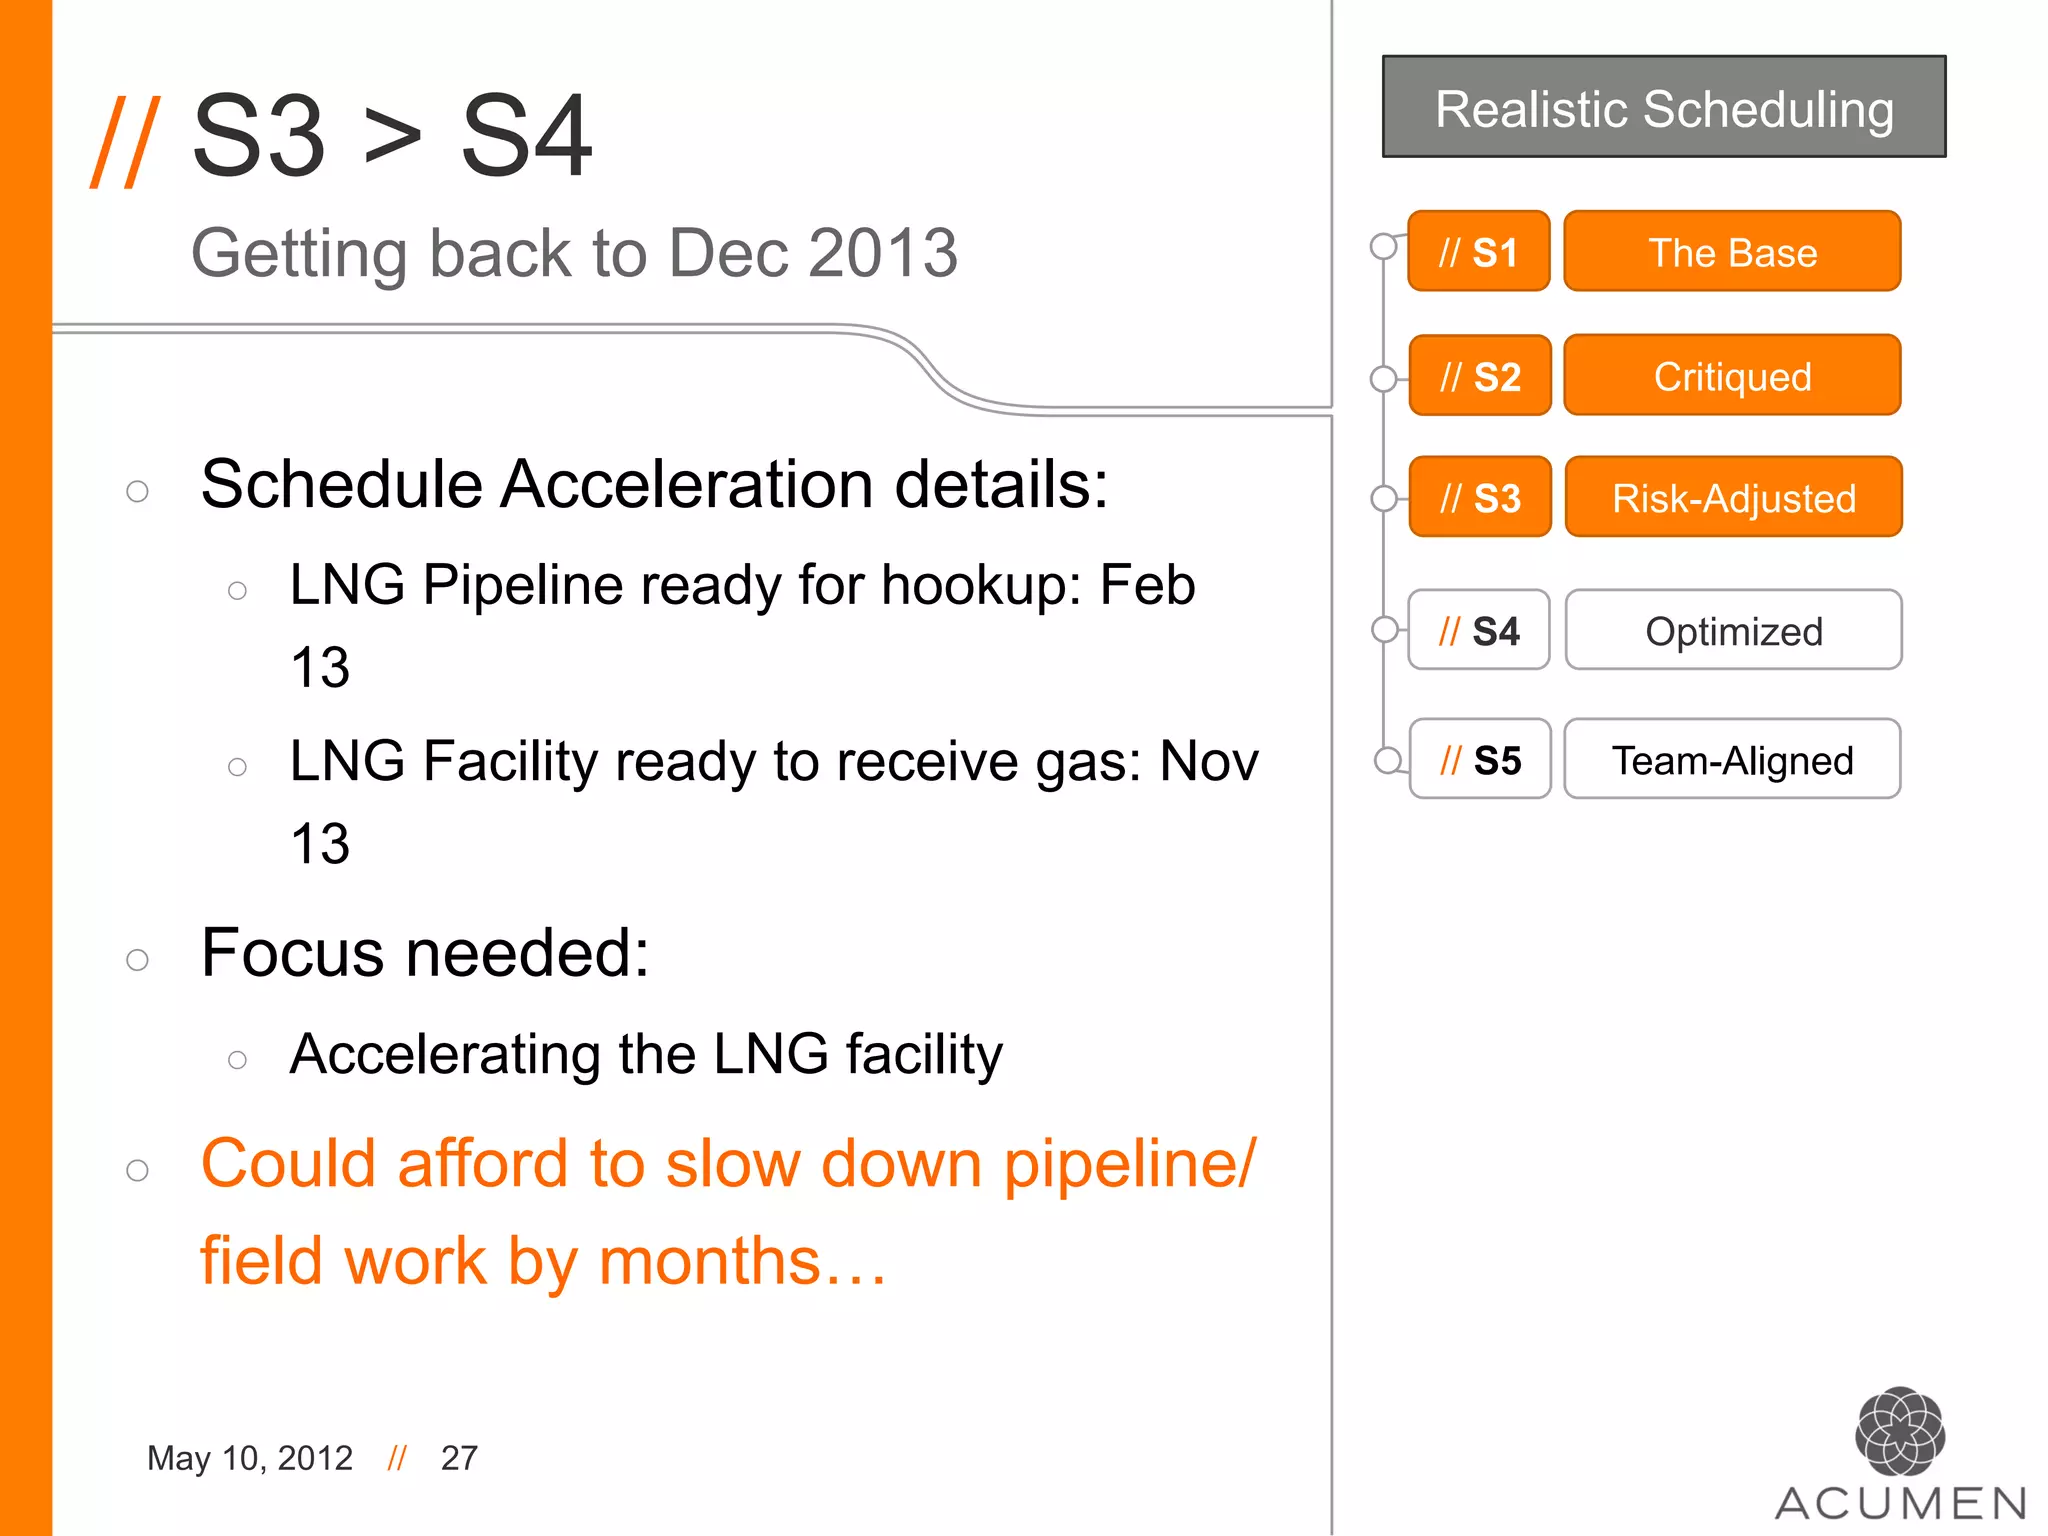
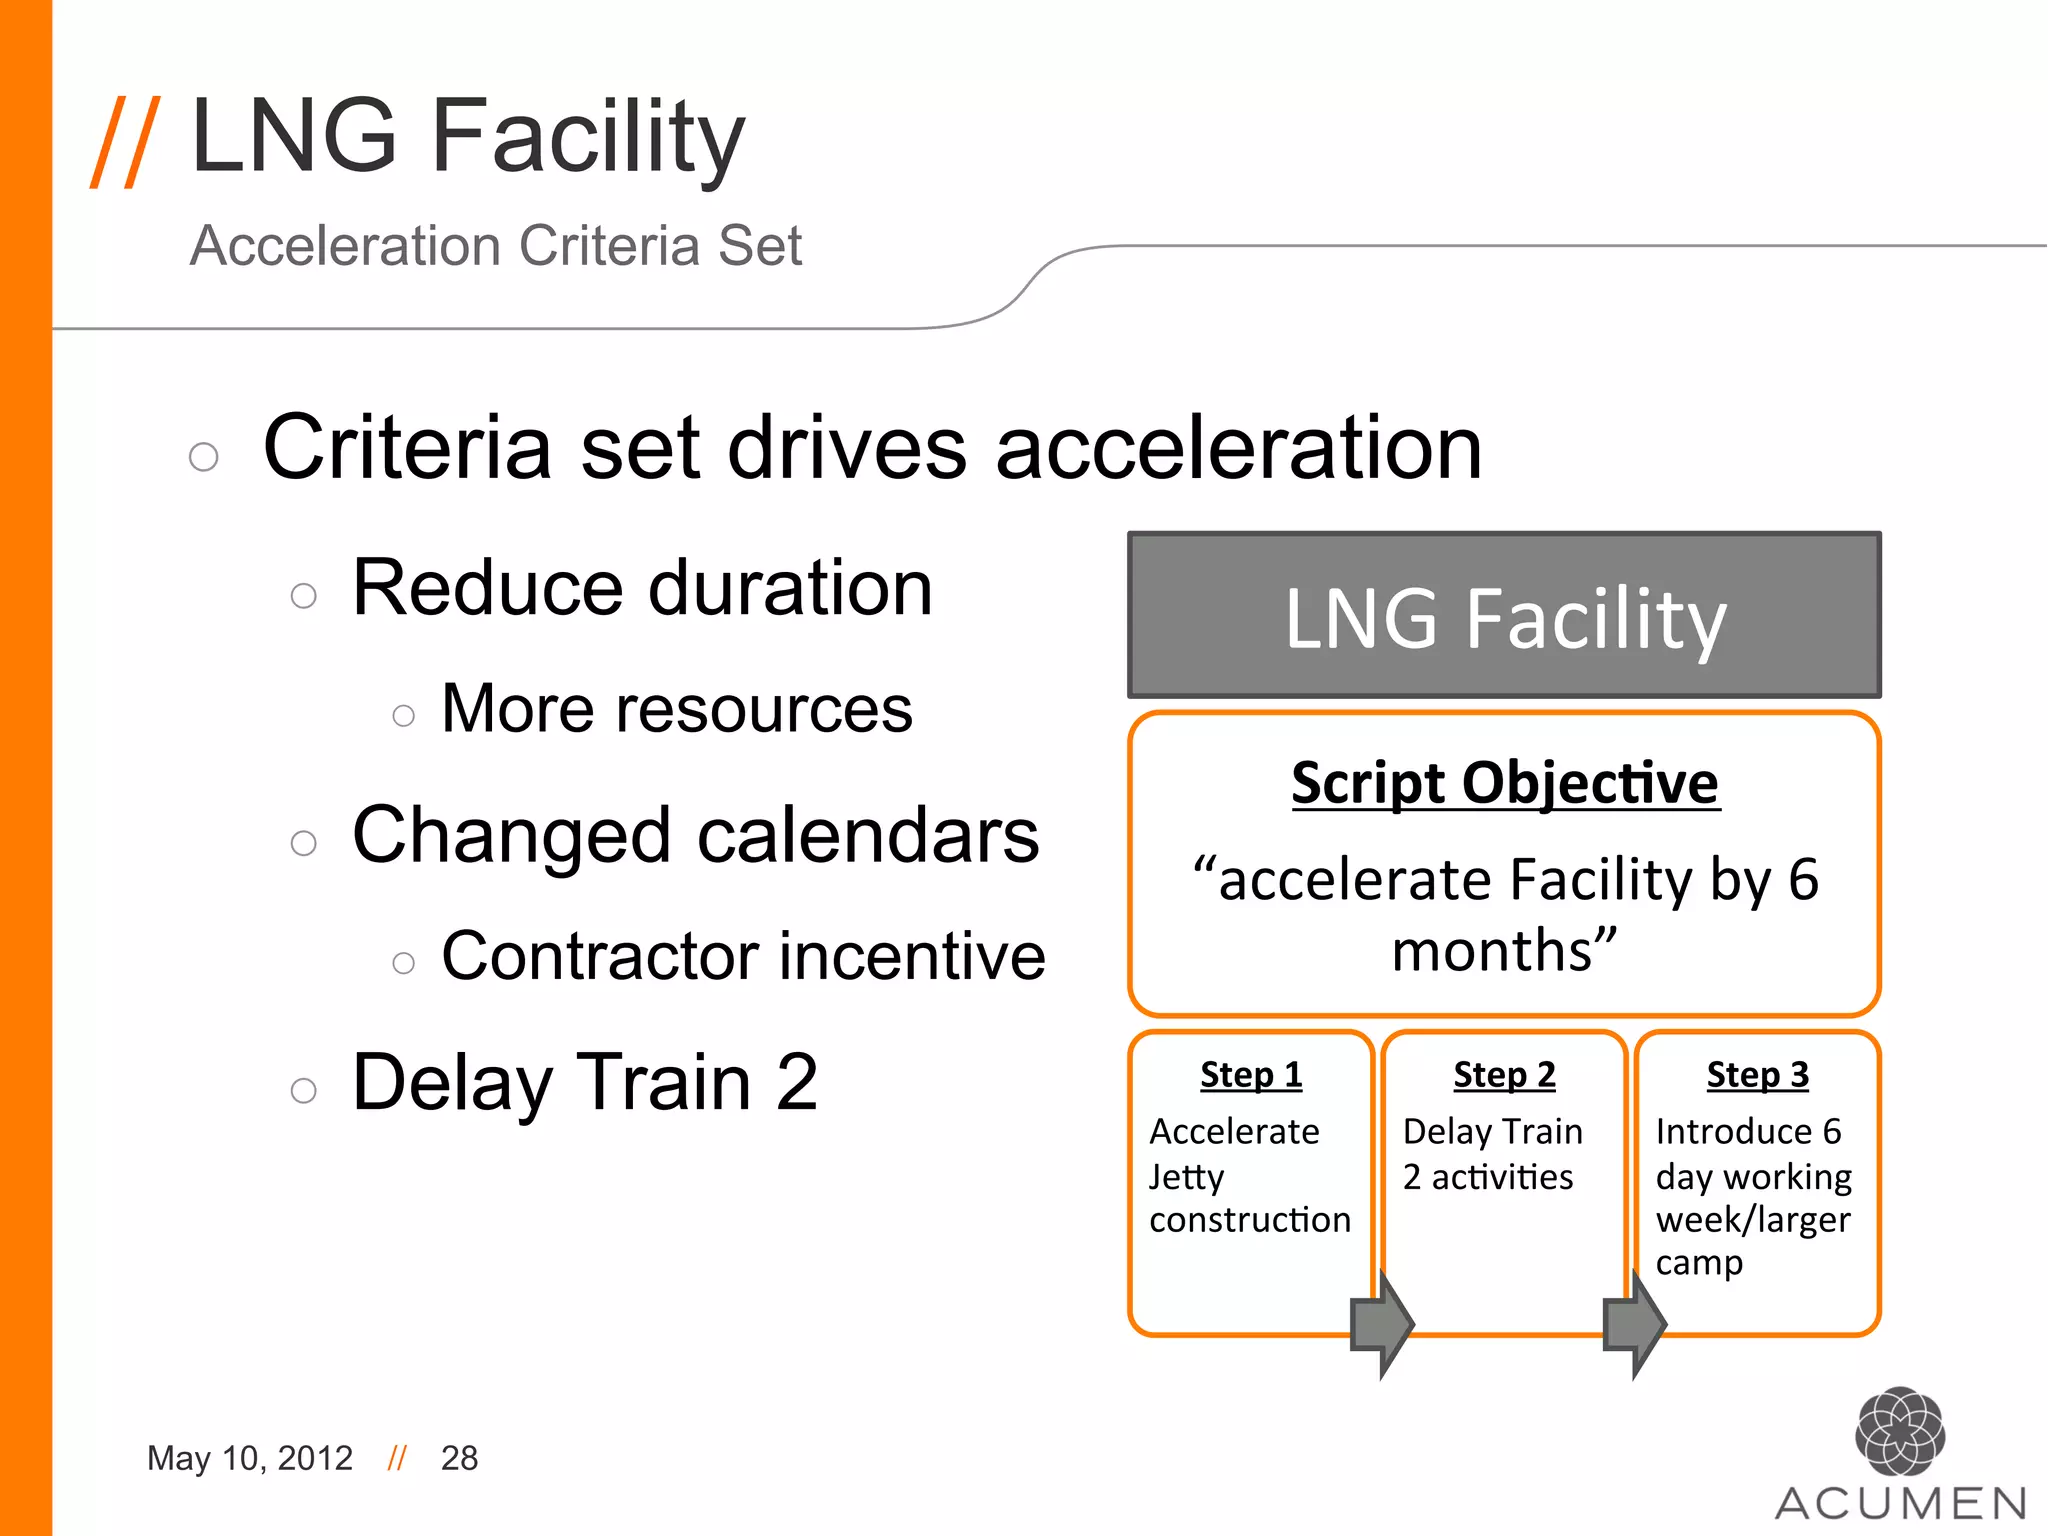
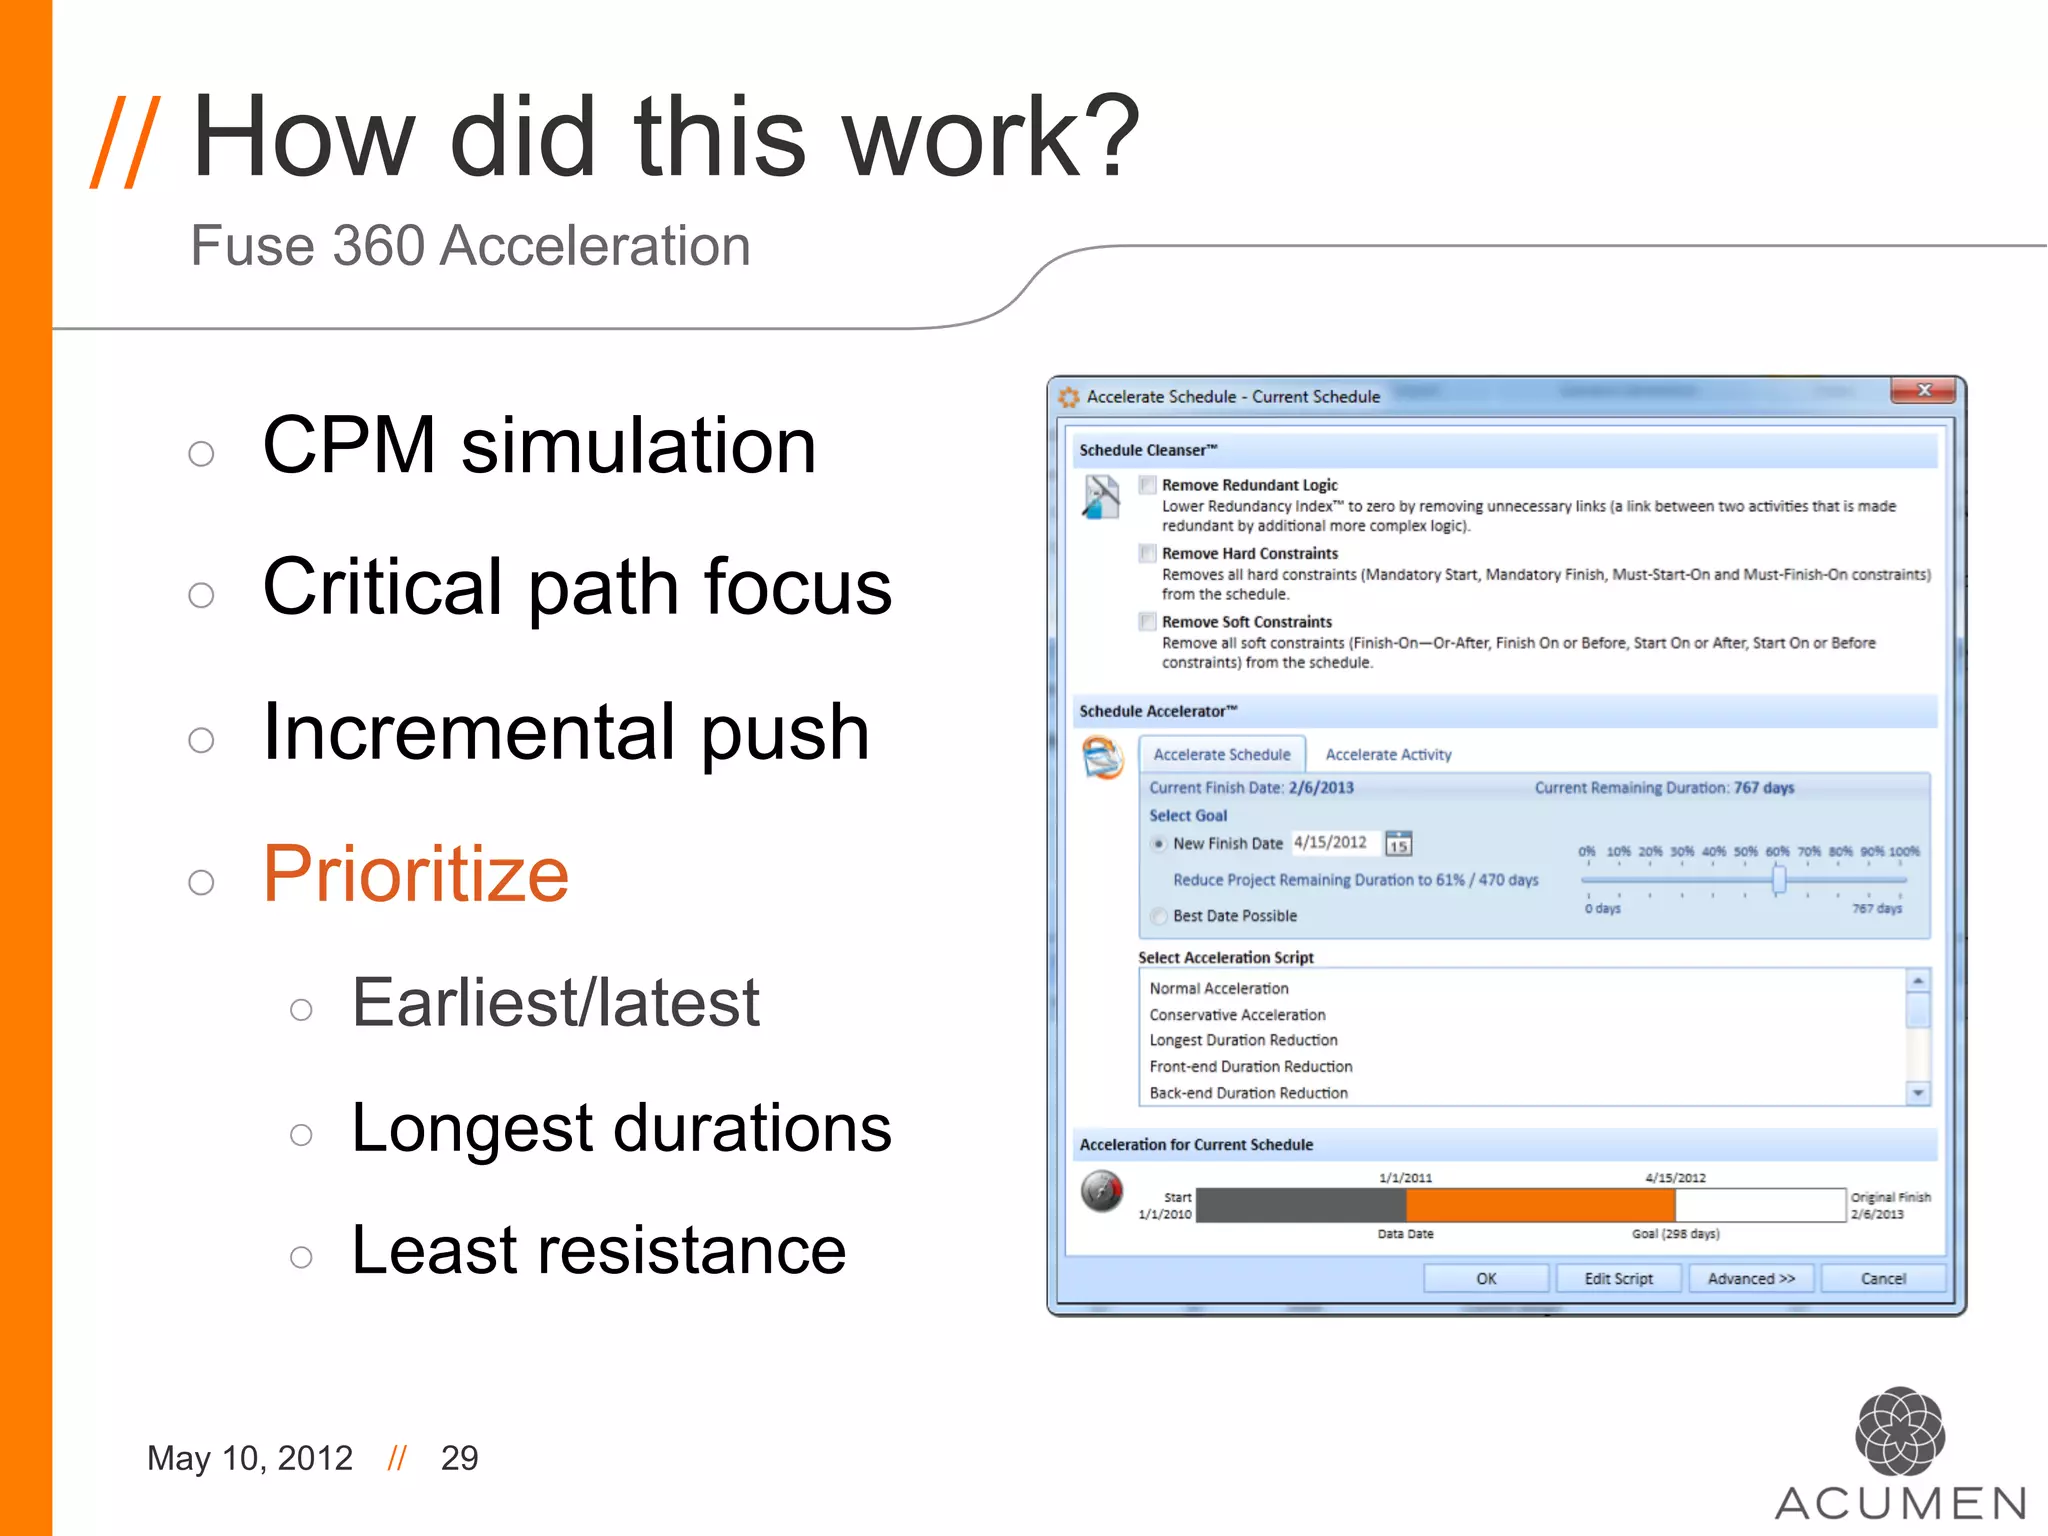
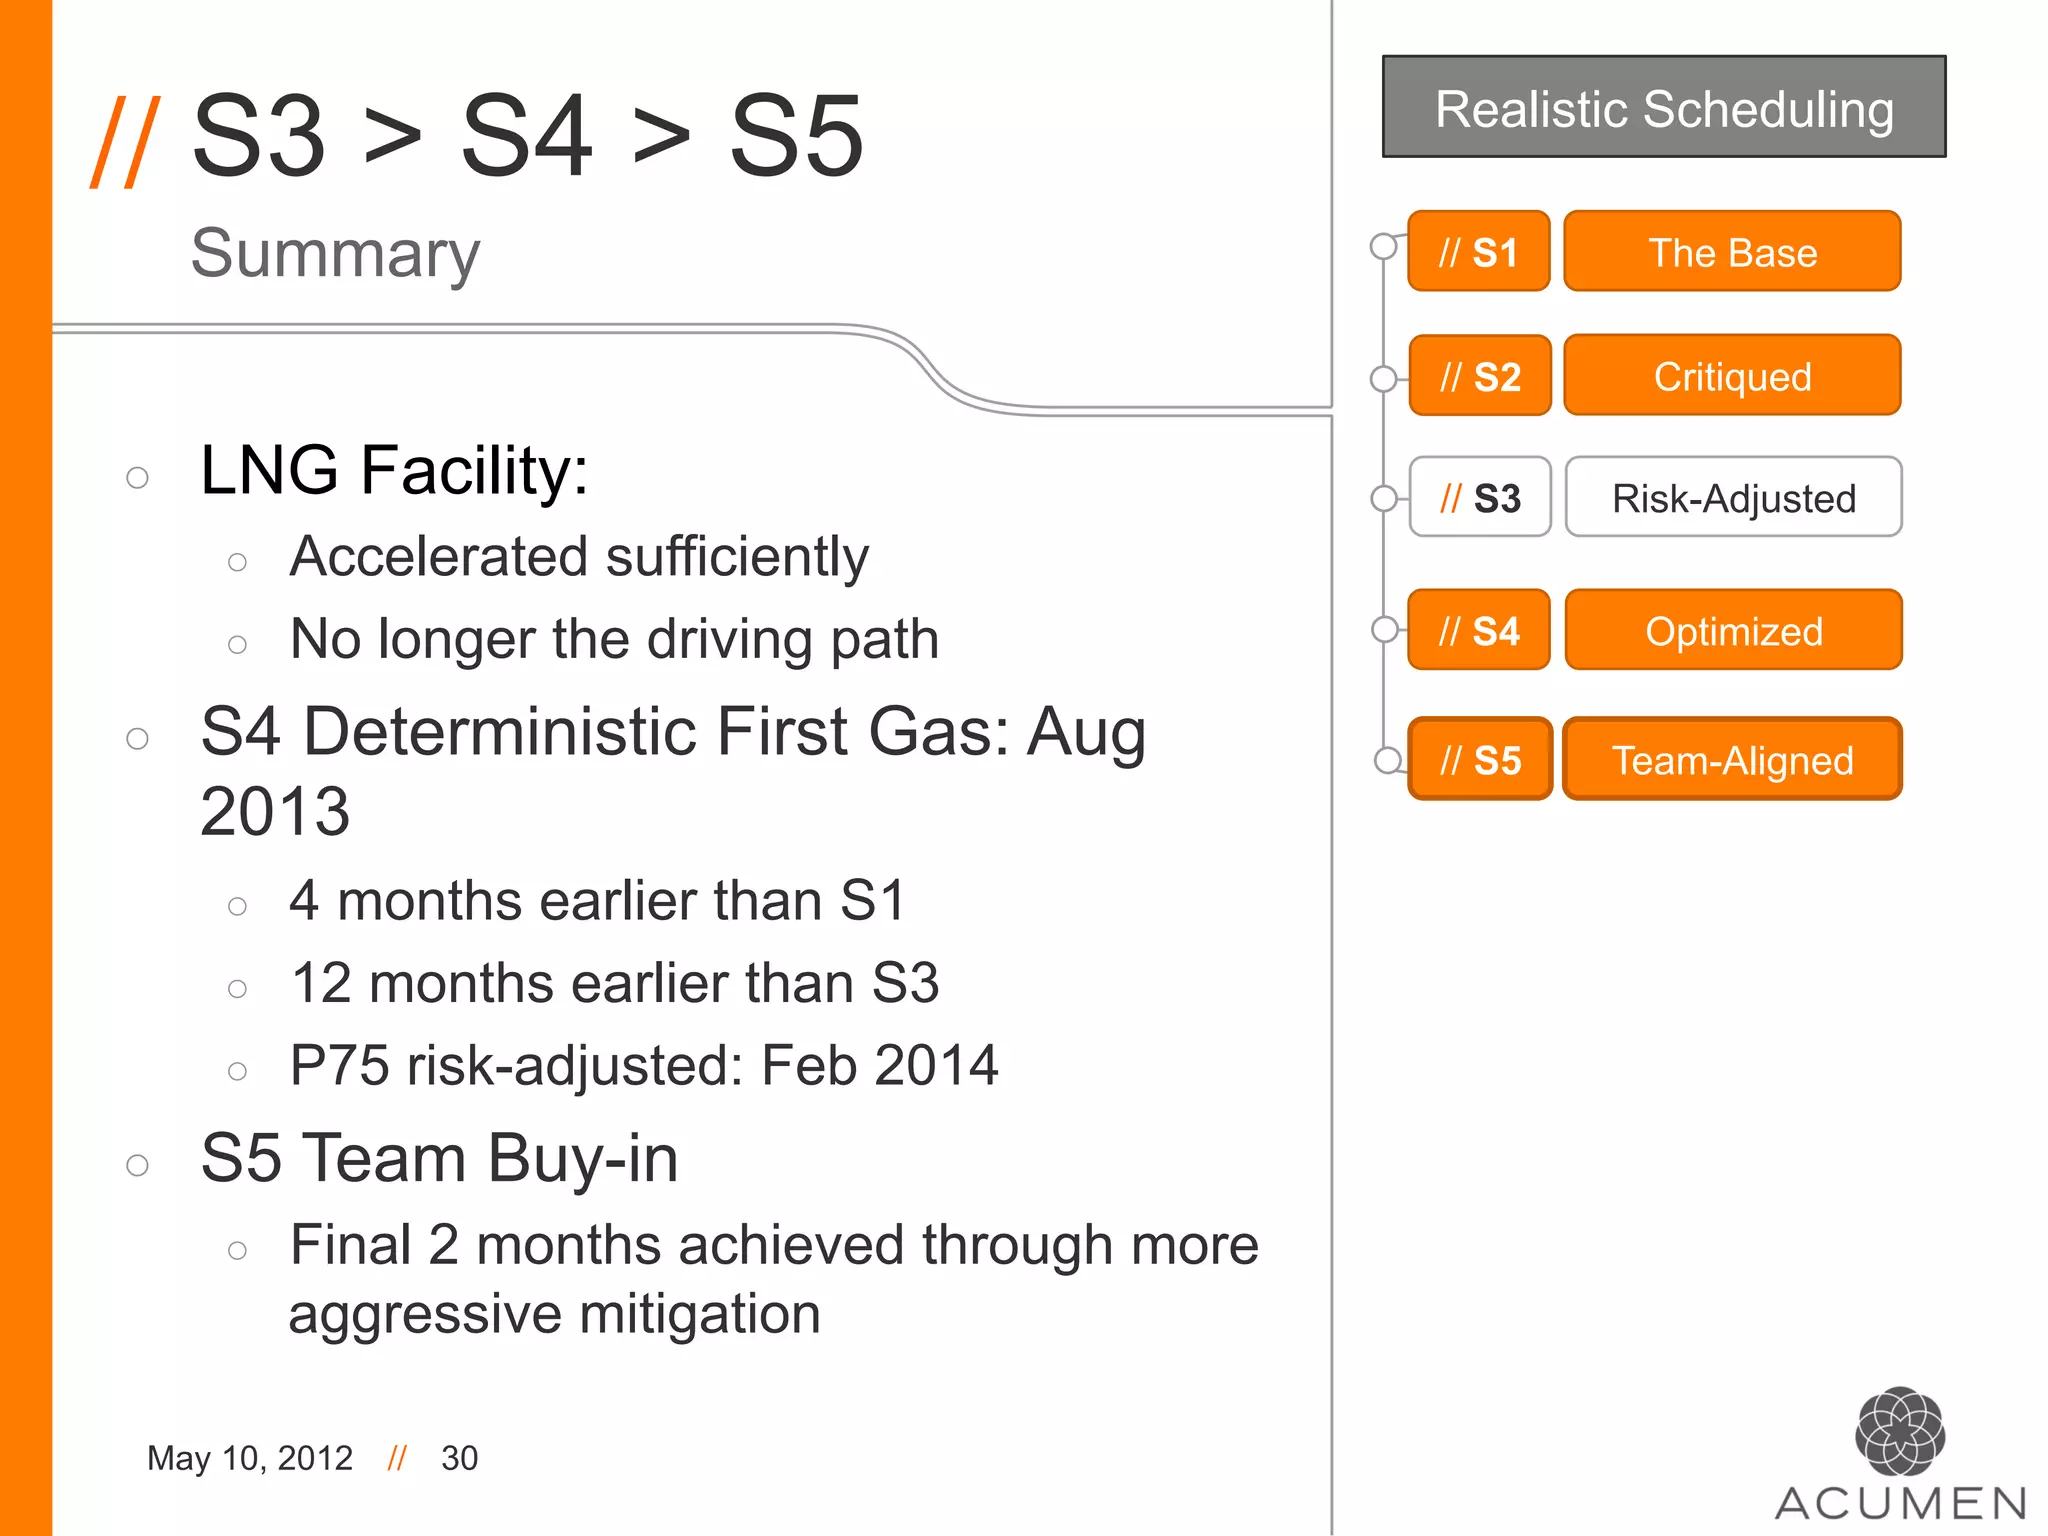


The document discusses project scheduling and management strategies, emphasizing the importance of realistic scheduling, risk-adjusted forecasting, and the use of Acumen's software tools for schedule optimization. It outlines methodologies for measuring schedule quality and compliance, along with case studies showcasing the implementation of these strategies to improve project outcomes. Ultimately, it highlights how effective planning and analytics can drive project success and on-time completion.


![NG BB 53 Process Control [Compatibility Mode]](https://cdn.slidesharecdn.com/ss_thumbnails/6906860-thumbnail.jpg?width=640&height=640&fit=bounds)


