Downloaded 266 times

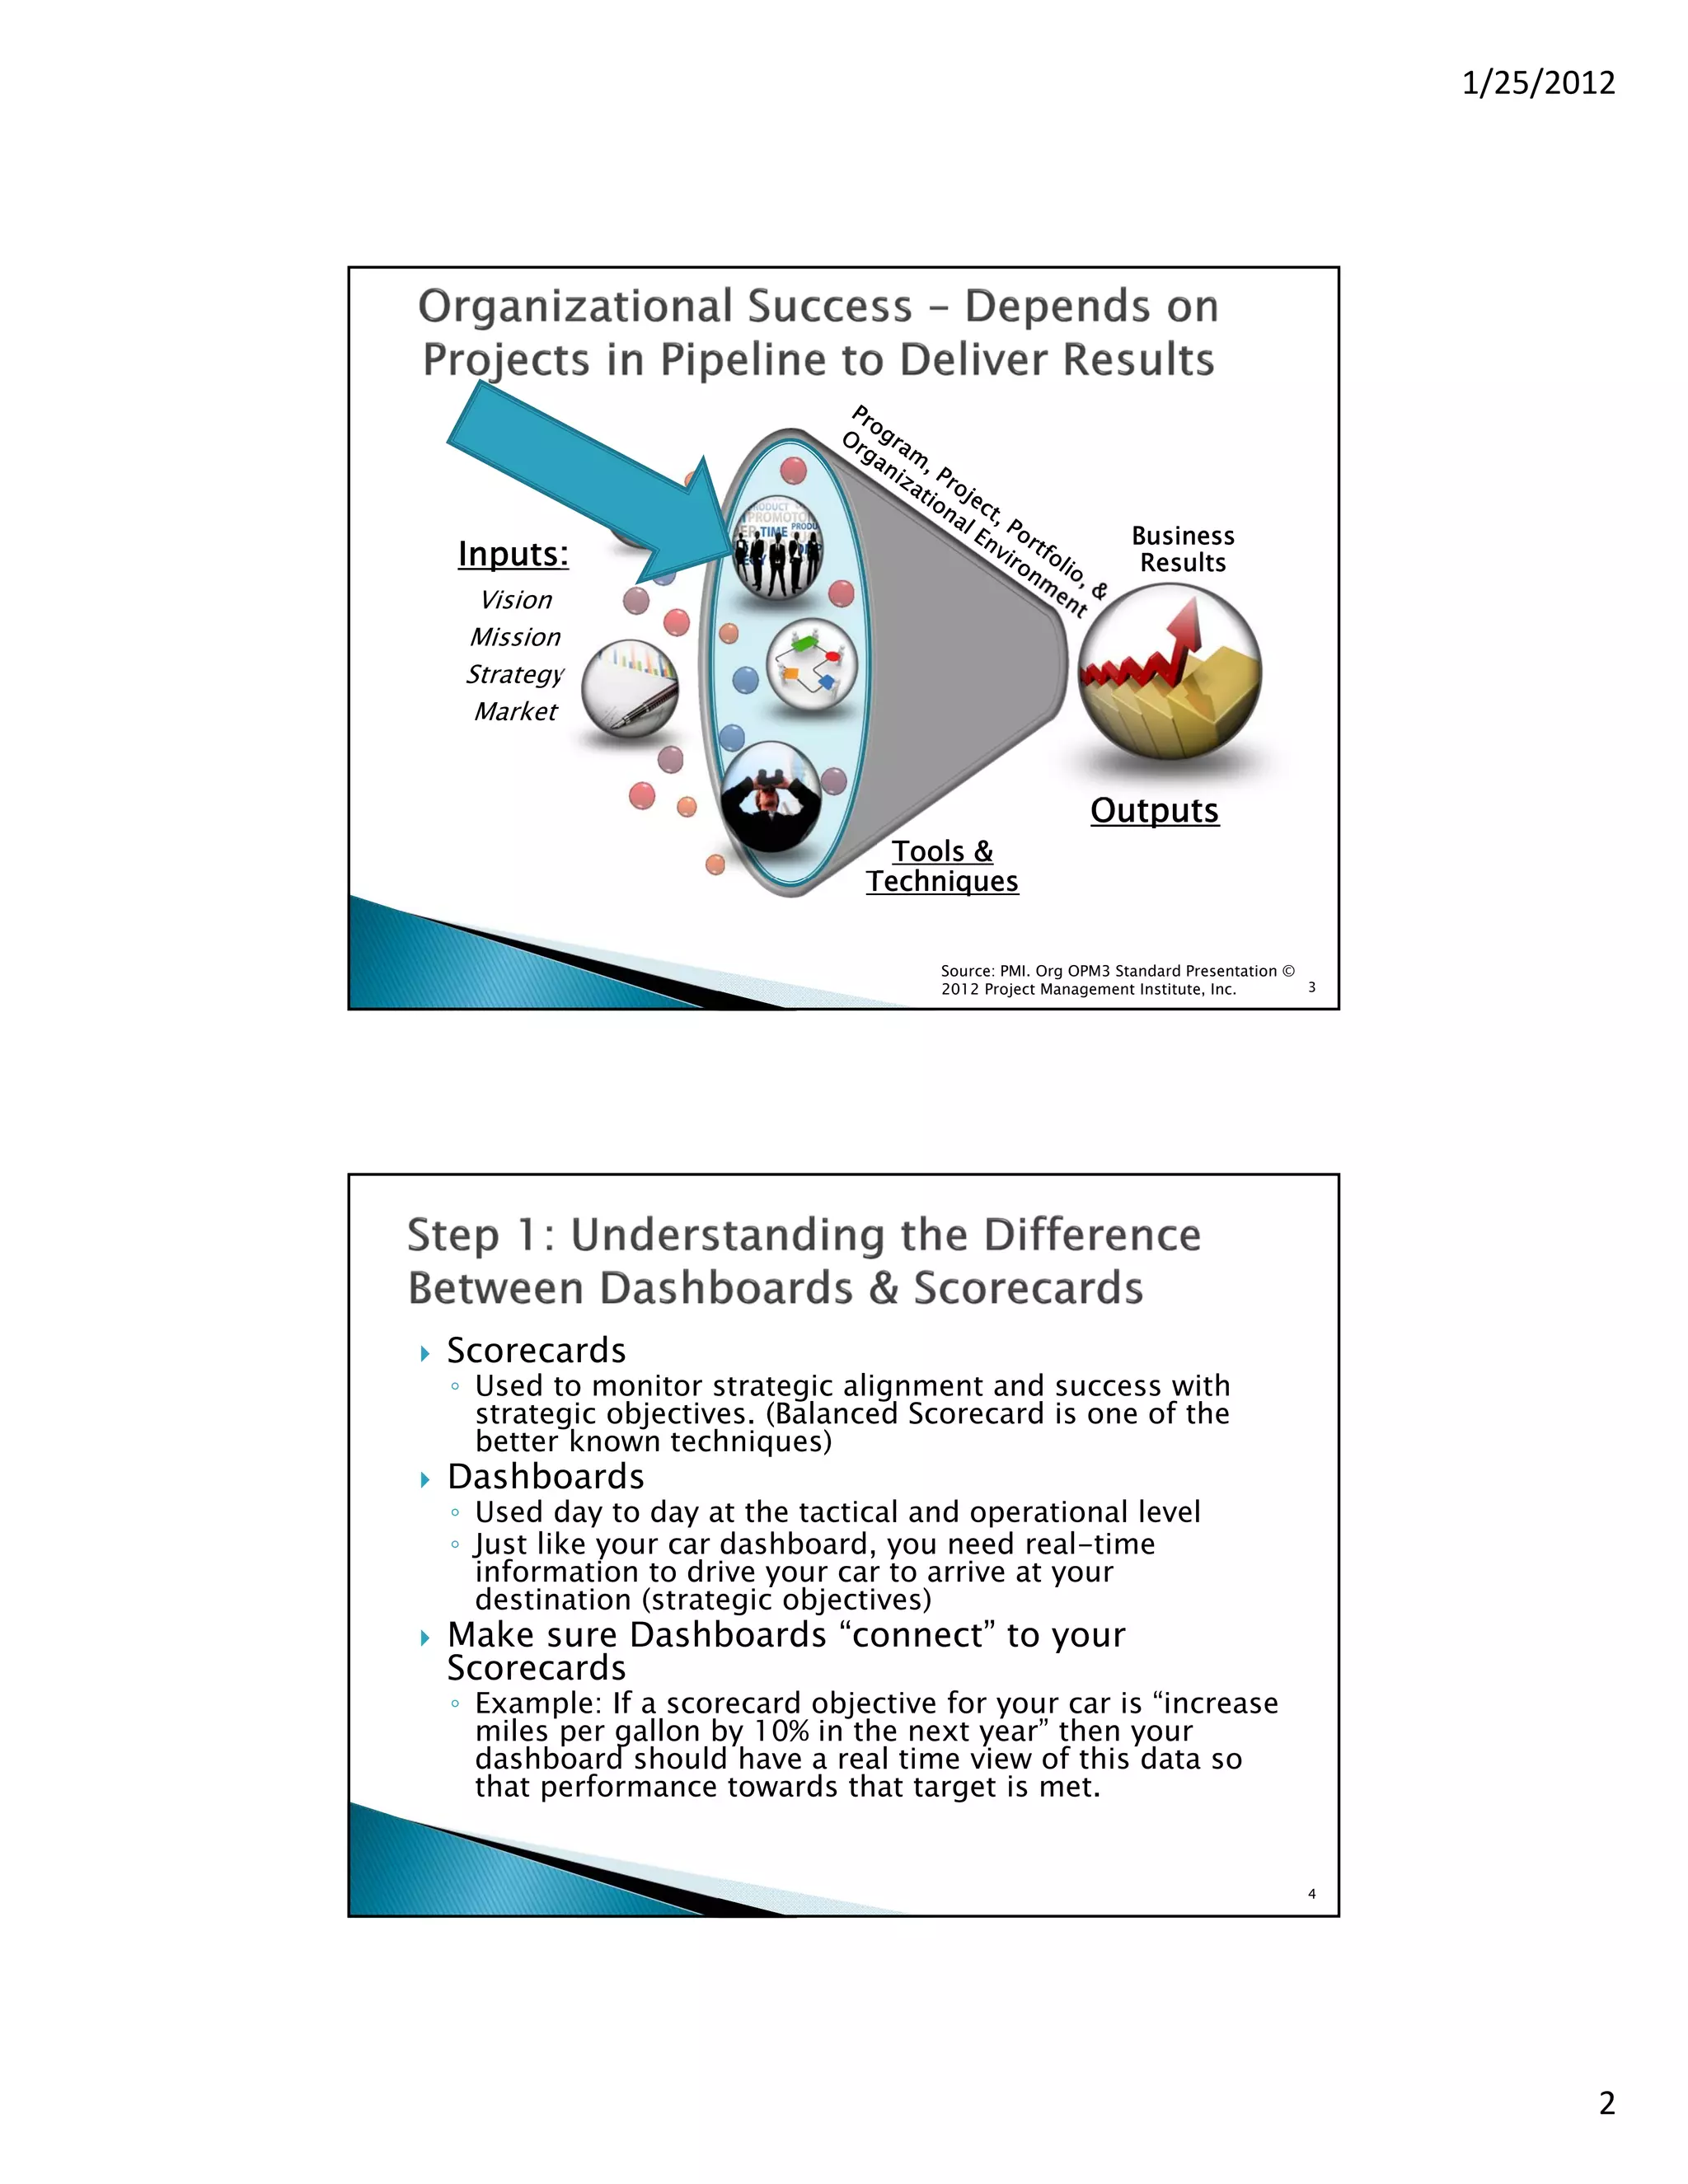
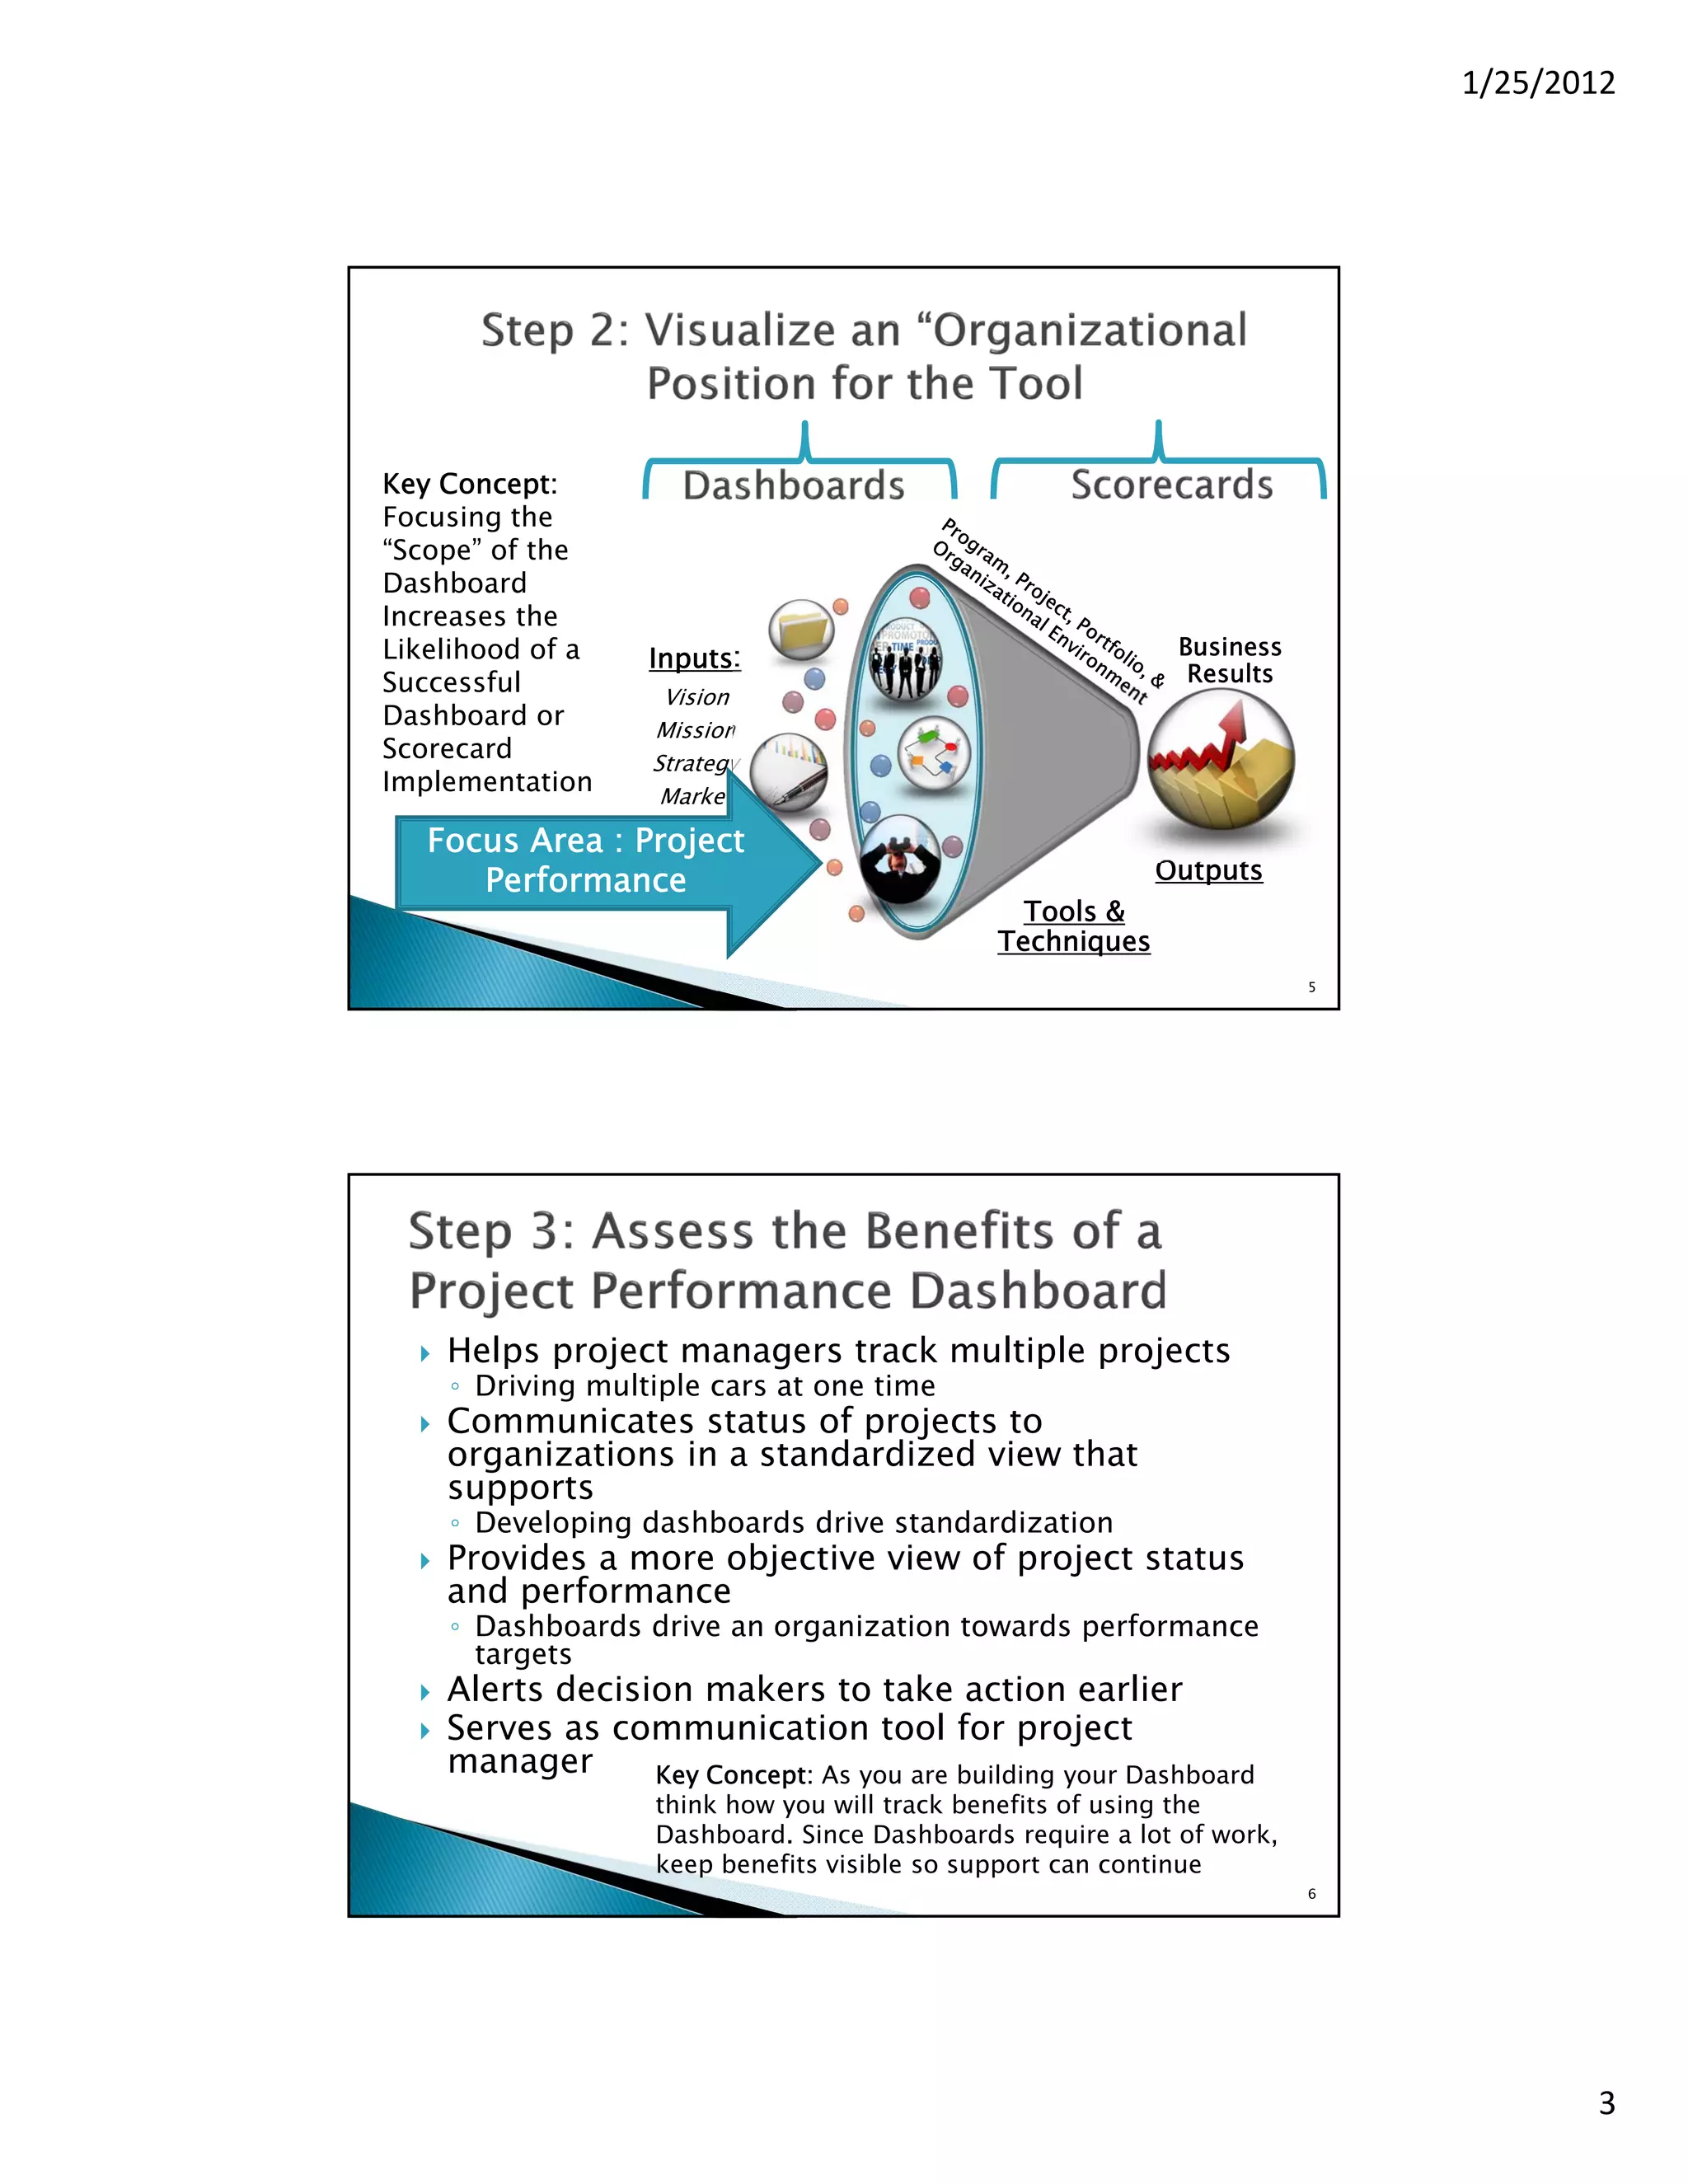
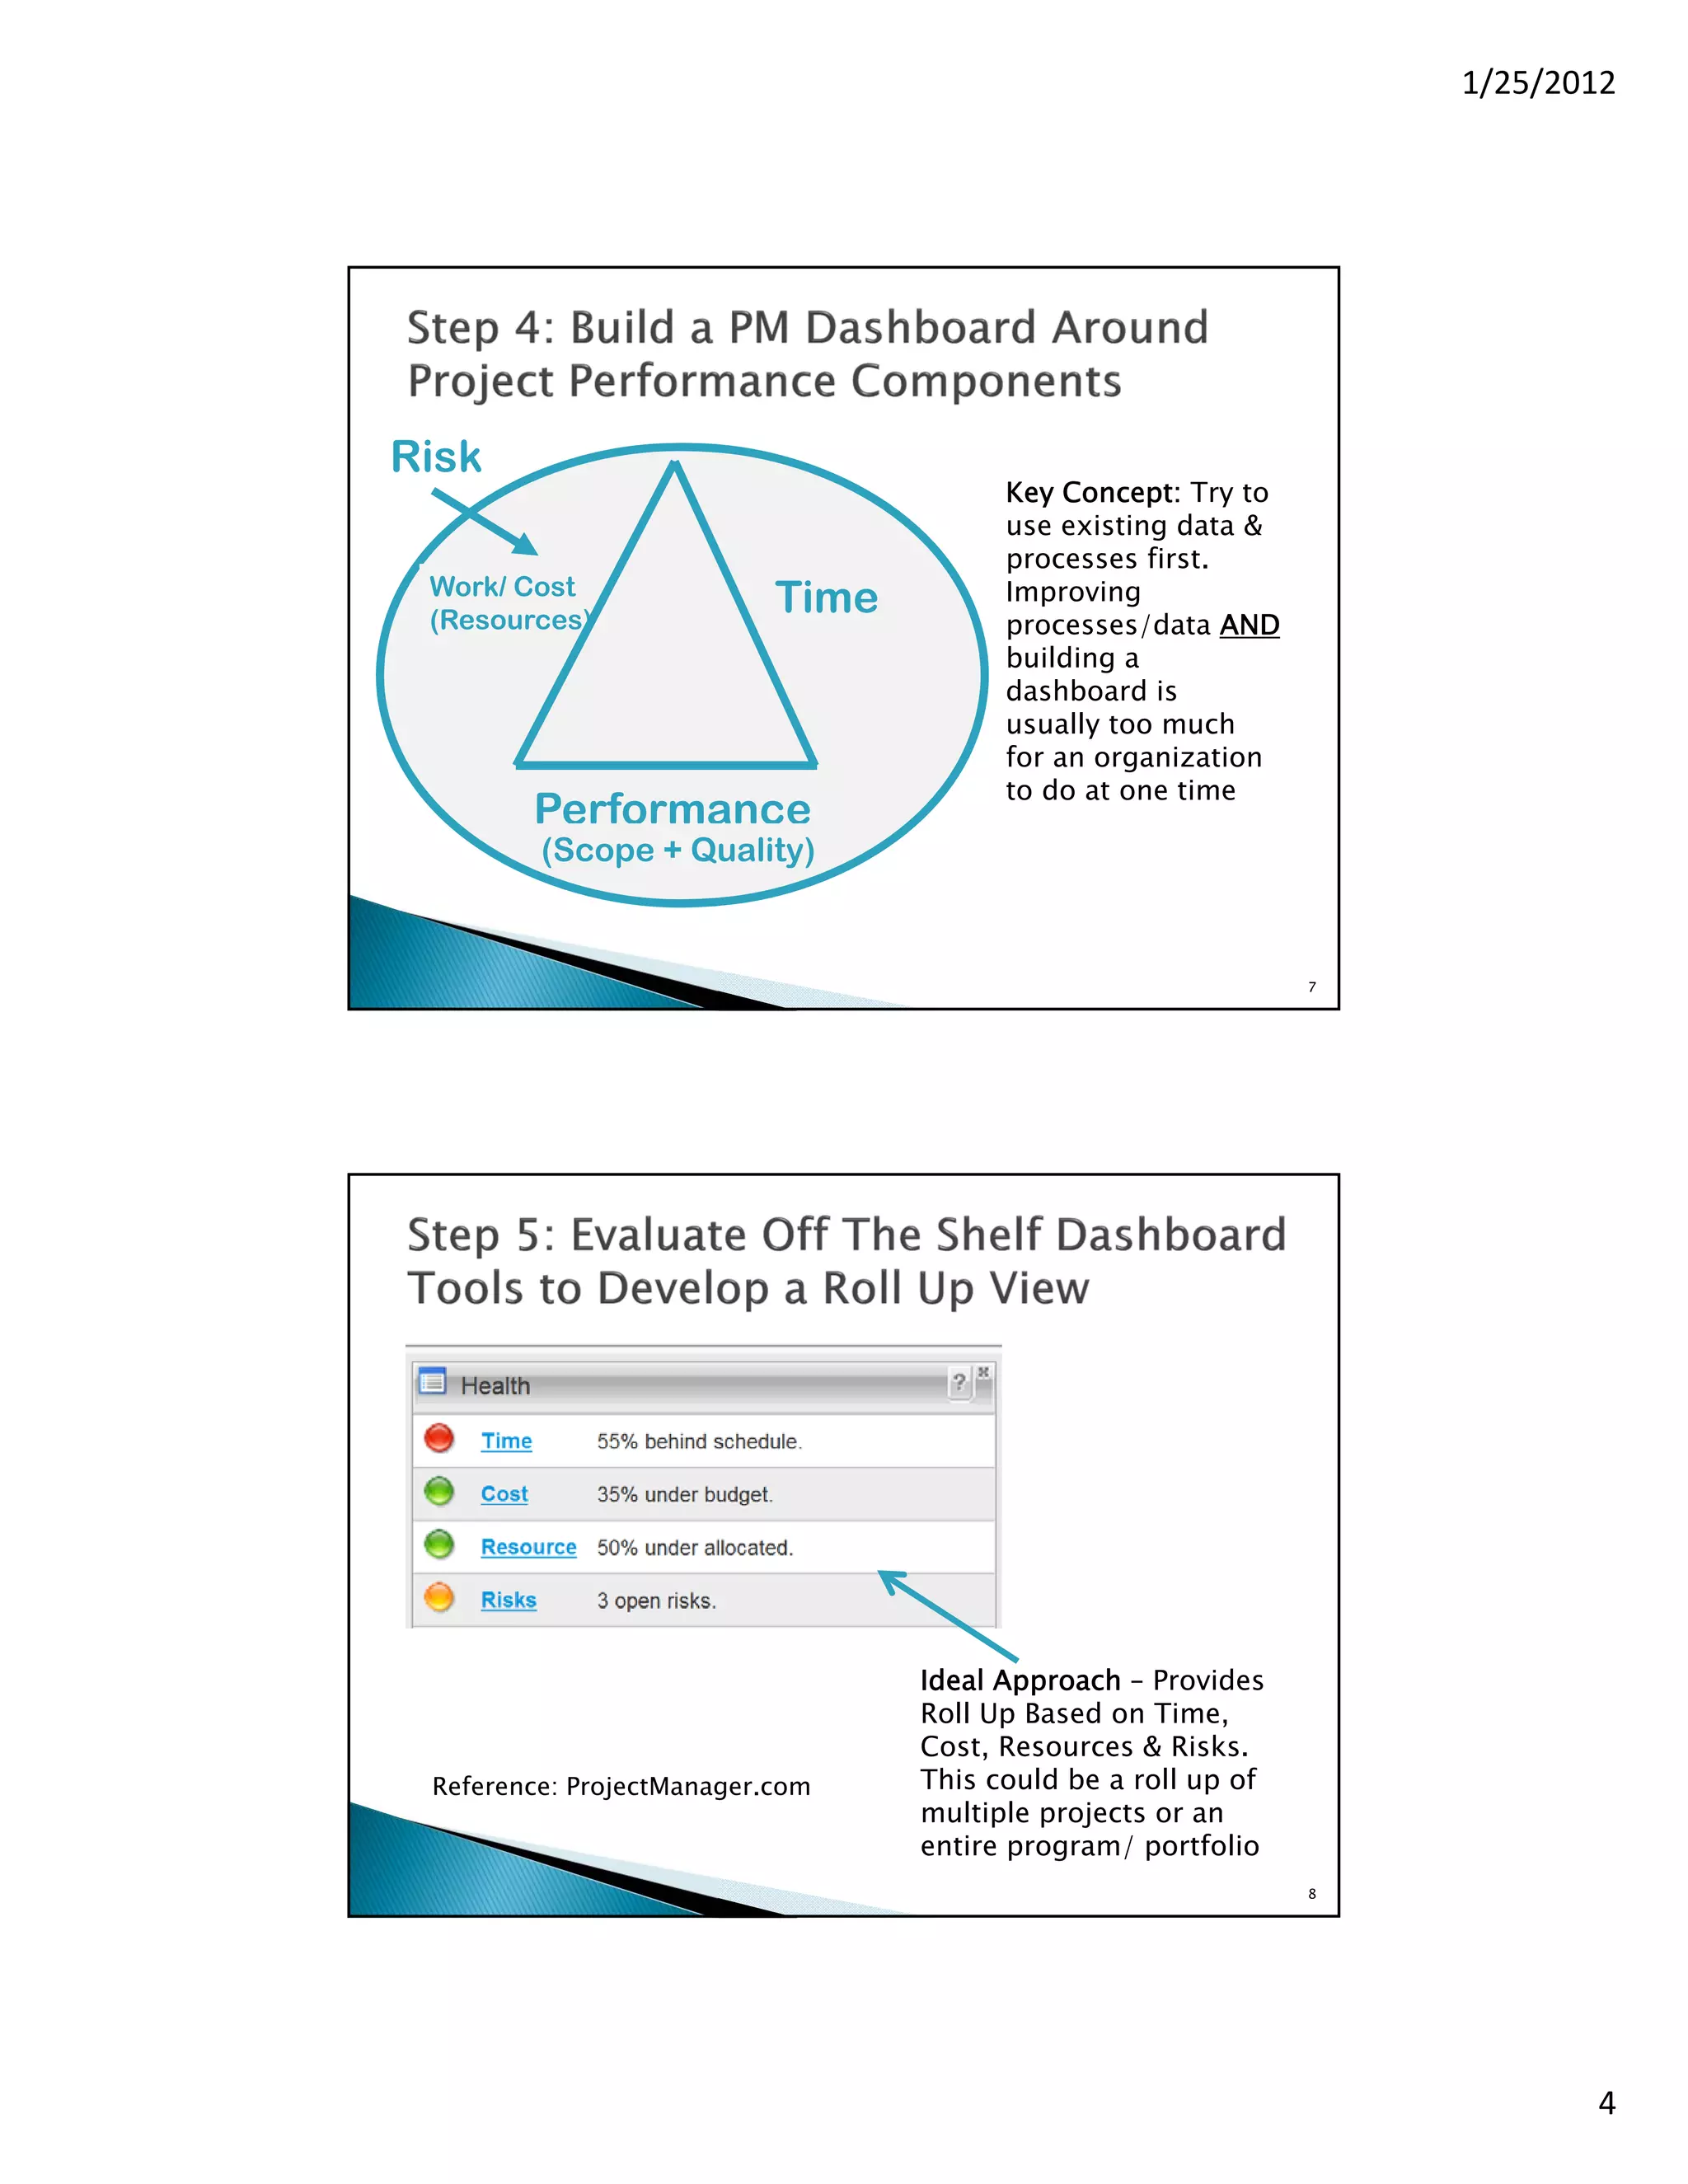
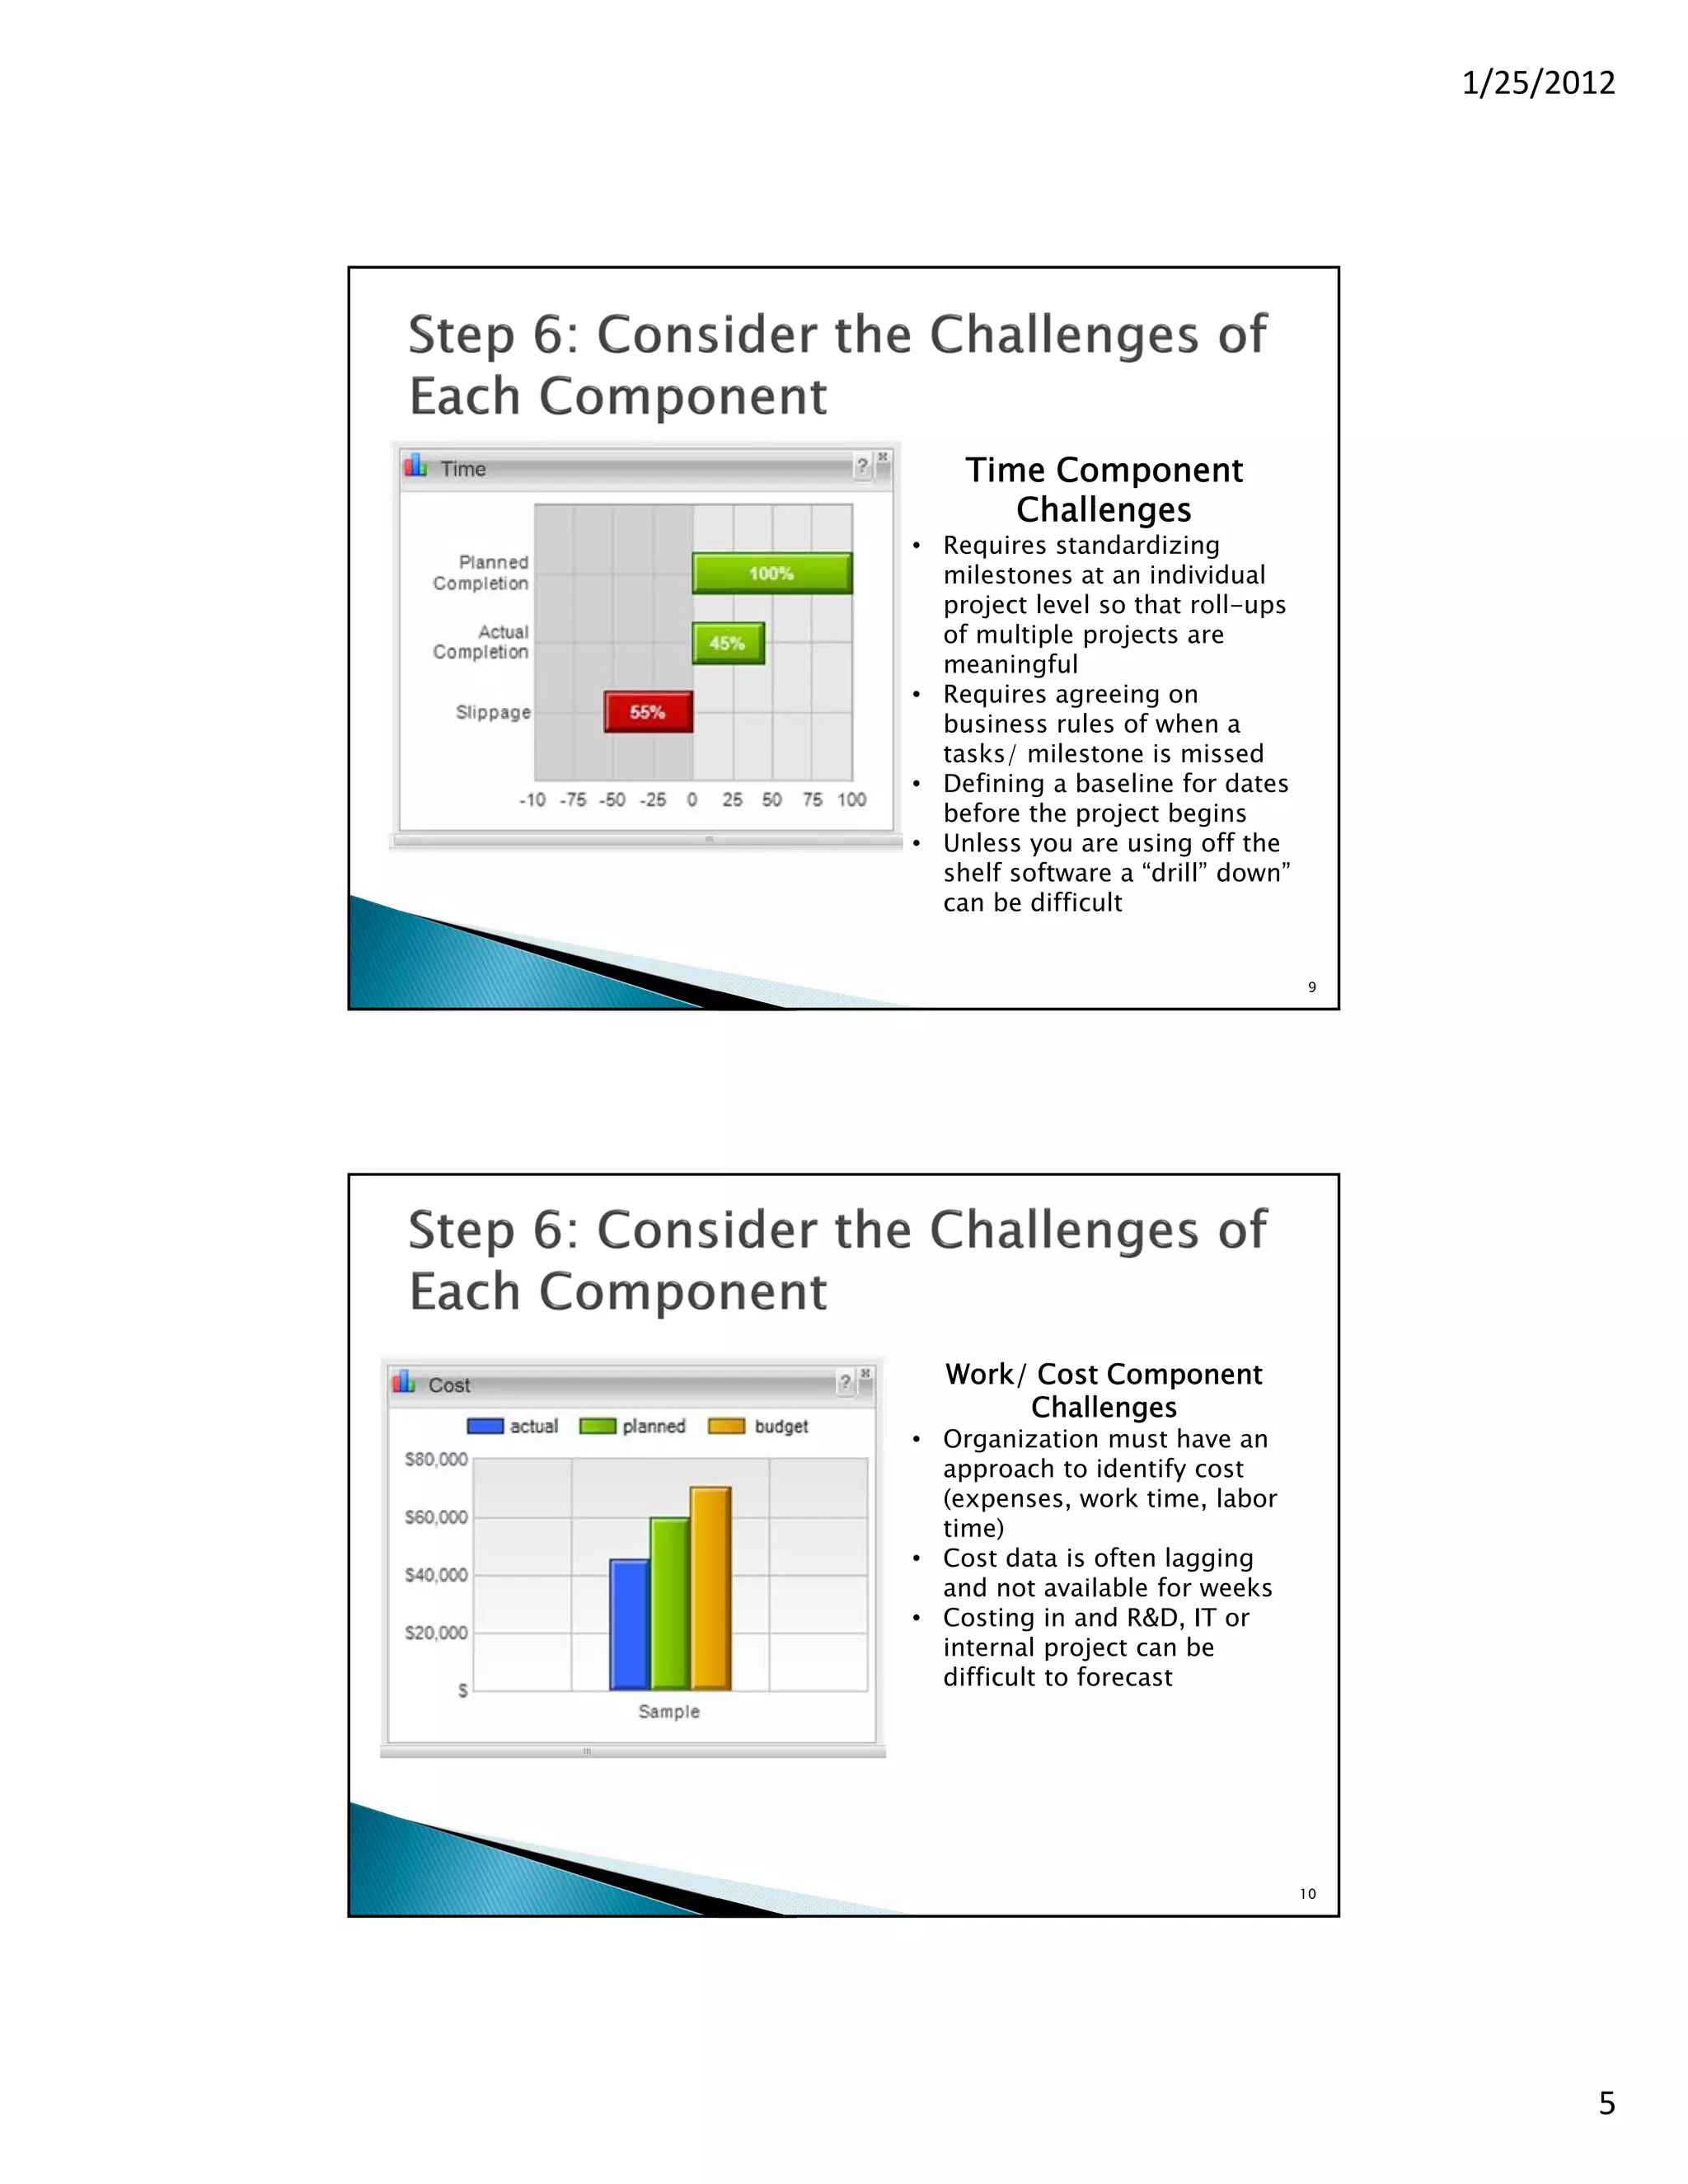

The document discusses the importance of dashboards in monitoring project performance and aligning strategic objectives, emphasizing their role in providing real-time data to support decision-making. It highlights challenges in standardizing metrics across projects, tracking costs, resources, and risks, and offers different methods for implementing dashboards, including paper and electronic options. The document urges organizations to begin small and evolve their dashboard systems while considering existing data to avoid overwhelming initiatives.


