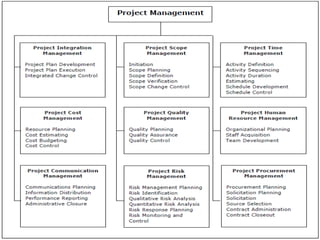
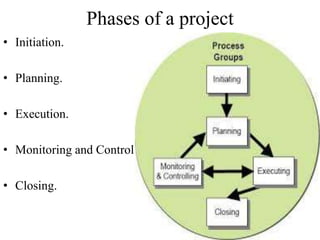
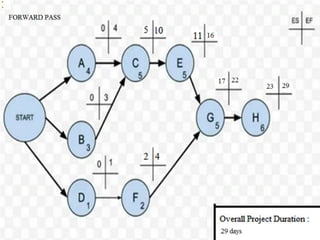
Project Management
Schedule
Project
• A project is a temporary
endeavor undertaken to create
a unique product, service or
result.
• Characteristics of a project
Temporary.
Unique.
Project Management
• Project Management is the process of
achieving project objectives (schedule,
budget and performance) through a set
of activities that start and end at certain
points in time and produce quantifiable
and qualifiable deliverables.
• Project Management is the application
of knowledge, skills, tools and
techniques to protect activities to meet
the project requirements.
• Project Management is accomplished
through the appropriate project
management processes comprising the 5
phases.
Triple Constraints
• The triple constraints is a framework
for evaluating competing demands.
• The triple constraints is often depicted
as a triangle where each leg represents
one of the constraints being managed
by the project team.
• The Triple Constraints are the
functional elements(scope), cost
(resources) and schedule (time).
 Scope
 Cost
 Time
Phases of a project
• Initiation.
• Planning.
• Execution.
• Monitoring and Control
• Closing.
Initiation
• It is the first phase of Project Management
process in which activities are performed
to asses the Size, Scope, and Complexity
of the Project and to establish procedures
to support later Project activities.
• Initiation phase includes the process of
 Collect Project Information (like
project statement of work)
 Define workflow templates for
project initiation request
 Initiate project request
 Develop the project team
• Initiation phase defines and authorizes the
project or a project phase.
Planning
• Planning phase defines and refines the
objectives, and plan the course of
action required to attain the objectives
and scope that the project was
undertaken to address.
• Planning phase includes
 Establish project objectives and
scope of work
 Define the work
 Determine the timing
 Establish resource requirements
/availability
 Establish a cost budget
 Evaluate , optimize and create a
baseline plan
Execution
• Execution phase integrates
people and other resources to
carry out the project
management plan for the
project.
• Execution phase comprises of
Distribute information
Track work in progress and
actual costs
Monitoring and Control
• Monitoring and control phase
regularly measures and monitors
progress to identify variances from the
project management plan so that
correct action can be taken, when
necessary, to meet project objectives.
• Monitoring and control phase
comprises of following activities
 Analyze and evaluate the project.
 Recommend necessary action.
 Modify the current project with
realistic data
 Re-forecast the schedule
 Communicate project performance
to the project team
Closing
• Closing phase formalizes acceptance
of the product, service or result and
brings the project or a project phase
to an orderly end.
• The Closing phase is the last but not
one.
• Closing phase focuses on the later
actives.
 Document lessons learned.
 Determine if project can be used
as a methodology.
 Deliver product to client or
stakeholders.
 Back-up or archive project files.
Work Break Down Structure
• The Work Breakdown Structure is a
deliverable-oriented hierarchical
decomposition of the work to be
executed by the project team, to
accomplish the project objectives and
create the required deliverables.
• The advantages of WBS are as follows
 Work Organization
 Costs
 Schedule
 Functionality
Work Break Down Structure
Level 3 - Work
Packages
Level 2 - Deliverables
Level 1 - WBS Root Project
Design
Specification
of
Equipment
Drawing of
the
Equipment
Procurement
Delivery of
the
Equipment
Installation
Calendar
• A calendar is to define the time duration
of the project. i.e the working hours,
days of the week and any holidays
available for the project tasks, activities
and resources.
• A calendar can be classified in three
categories. They are
 Global Calendar :-
• It is the common calendars that
apply to all projects.
 Project Calendar :-
• It is a separate calendar for each
project.
 Resource Calendar :-
• It is a separate calendar for each
resource.
Relationships
• Relationships is the method of
identifying and documenting
relationships among the project
activities.
• Activities are sequenced using logical
relationships.
• Each activity are connected to each
other, they are known as predecessors
and successors.
• A B
 A- predecessor
 B- successor
Types of Relationships
• FINISH TO START
• FINISH TO FINISH
• START TO START
• START TO FINISH
Activities
• The technique of decomposition, as
applied to defining activities, involves
subdividing the project work packages
into smaller, more manageable
components called activities.
• Activities represent the effort needed
to complete a work package.
• The Activity definition includes the
identifier and a scope of work
description in sufficient detail to
ensure that project team members
understand what work is required to
be completed.
Types of Activities
 Start Milestone - To mark the
beginning of major stage in the
project
 Finish Milestone - To mark the
end of a major stage in the project
 Level of Effort - For ongoing tasks
that depend on its predecessor or
successor activities .
 Task Dependent - To use when
multiple resources assigned to the
same activity need to work
together
 Resource Dependent - To use
when multiple resources assigned
to the same activity can work
independently
 WBS Summary - To summarize a
WBS level
Schedule
• A schedule is to determine the amount
of duration flexibility (the amount of
float) on various logical network paths
in the project schedule network, and to
determine the minimum total project
duration.
• Forward Pass - Early Start and Early
Finish dates
• Backward Pass - Late Start and Late
Finish dates
• Milestones are frequently used to
monitor progress, but there are
limitations to their effectiveness. They
usually show progress only on the
critical path, and ignore non-critical
activities.
Schedule Techniques
• Gantt chart
• CPM
• Network diagram
(PERT)
Gantt Charts
• A graphical representation of a
Project that shows each task as a
horizontal bar whose length is
proportional to its time for
completion.
• In the GANTT Chart Time is
displayed on the horizontal axis
and the Tasks/ Activities are
arranged vertically from top to
bottom, in order of their start
dates.
• A detailed GANTT Chart for a
large project might be quite
complex and hard to understand.
To simplify the chart Project
manager can combine related
activities into one Task.
Critical Path Management
• The Critical Path Method (CPM)
scheduling technique is utilized to
calculate project schedules.
• CPM uses activity durations and
relationships between activities to
calculate schedule dates.
• This calculation is done in two passes
through the activities in a project.
Activity Time (days) Immediate
predecessors
A 4 -
B 3 -
C 5 A,B
D 1 -
E 5 C
F 2 D
G 5 E,F
H 6 G
Terms
•Project Duration: Minimum time
required to complete the project.
•Total Float: Total amount of time that a
scheduled activity may be delayed from its
early start date without delaying project
finish date or violating a schedule
constraint.
Total Float = LS – ES or LF – EF.
•Critical Activities: Zero Total Float
Activities .
•Critical Path: Activities on the Longest
Path in the network.
TERMS
•Free Float: The amount of time that a
scheduled activity can be delayed without
delaying the early start date of an
immediately following schedule.
(Successors ES of next activity -
EF)-1
•Lag: Lag specifies an offset or delay
between an activity and its successor.
•Lead: The negative value of lag is known
as Lead.
CALCULATIONS
 Project Duration:
 A-C-E-G-H
• A=>0+4 =4
• C=>5+5 =10
• E=>11+5 =16
• G=>17+5 =22
• H=>23+6 =29
 B-C-E-G-H
• B=>0+3 =3
• C=>4+5 =9
• E=>10+5 =15
• G=>16+5 =21
• H=>22+6 =28
 D-F-G-H
• D=>0+1 =1
• F=2+2 =4
• G=>5+5 =10
• H=>11+6 =21
 Total Float:
• A=>4-4 =0
• B=>4-3 =1
• C=>10-10=0
• D=>13-1 =12
• E=>16-16 =0
• F=>16-4 =12
• G=>22-22=0
• H=>29-29=0
CALCULATIONS
 Critical Activities:
 A
 C
 E
 G
 H
 Critical Path:
 A-C-E-G-H
 Free float:
 B-C:
 (5-3)-1 =1
 F-G:
 (17-4)-1=12
Network diagram (PERT)
• Program Evaluation Review
Technique.
• PERT chart consists of tasks
and events.
• An event is called a
milestone, representing a
point in time, such as the
start or completion of a task.
• A task is also called an
activity.
Program Evaluation Review Technique
• PERT uses
 Optimistic time (o) : It
reflects minimum possible
periods of time for an
activity to be completed.
 Pessimistic time (p) : It
reflects maximum possible
periods of time for an
activity to be completed.
 Realistic time (r) or the
Most likely time , reflects
the Project manager’s
“Best Guess” of the
amount of time required for
a task completion.
1 2 5 6 8
4
3
7
START
END

pm--basic.pptx

  • 1.
  • 2.
    Project • A projectis a temporary endeavor undertaken to create a unique product, service or result. • Characteristics of a project Temporary. Unique.
  • 3.
    Project Management • ProjectManagement is the process of achieving project objectives (schedule, budget and performance) through a set of activities that start and end at certain points in time and produce quantifiable and qualifiable deliverables. • Project Management is the application of knowledge, skills, tools and techniques to protect activities to meet the project requirements. • Project Management is accomplished through the appropriate project management processes comprising the 5 phases.
  • 4.
    Triple Constraints • Thetriple constraints is a framework for evaluating competing demands. • The triple constraints is often depicted as a triangle where each leg represents one of the constraints being managed by the project team. • The Triple Constraints are the functional elements(scope), cost (resources) and schedule (time).  Scope  Cost  Time
  • 6.
    Phases of aproject • Initiation. • Planning. • Execution. • Monitoring and Control • Closing.
  • 7.
    Initiation • It isthe first phase of Project Management process in which activities are performed to asses the Size, Scope, and Complexity of the Project and to establish procedures to support later Project activities. • Initiation phase includes the process of  Collect Project Information (like project statement of work)  Define workflow templates for project initiation request  Initiate project request  Develop the project team • Initiation phase defines and authorizes the project or a project phase.
  • 8.
    Planning • Planning phasedefines and refines the objectives, and plan the course of action required to attain the objectives and scope that the project was undertaken to address. • Planning phase includes  Establish project objectives and scope of work  Define the work  Determine the timing  Establish resource requirements /availability  Establish a cost budget  Evaluate , optimize and create a baseline plan
  • 9.
    Execution • Execution phaseintegrates people and other resources to carry out the project management plan for the project. • Execution phase comprises of Distribute information Track work in progress and actual costs
  • 10.
    Monitoring and Control •Monitoring and control phase regularly measures and monitors progress to identify variances from the project management plan so that correct action can be taken, when necessary, to meet project objectives. • Monitoring and control phase comprises of following activities  Analyze and evaluate the project.  Recommend necessary action.  Modify the current project with realistic data  Re-forecast the schedule  Communicate project performance to the project team
  • 11.
    Closing • Closing phaseformalizes acceptance of the product, service or result and brings the project or a project phase to an orderly end. • The Closing phase is the last but not one. • Closing phase focuses on the later actives.  Document lessons learned.  Determine if project can be used as a methodology.  Deliver product to client or stakeholders.  Back-up or archive project files.
  • 12.
    Work Break DownStructure • The Work Breakdown Structure is a deliverable-oriented hierarchical decomposition of the work to be executed by the project team, to accomplish the project objectives and create the required deliverables. • The advantages of WBS are as follows  Work Organization  Costs  Schedule  Functionality
  • 13.
    Work Break DownStructure Level 3 - Work Packages Level 2 - Deliverables Level 1 - WBS Root Project Design Specification of Equipment Drawing of the Equipment Procurement Delivery of the Equipment Installation
  • 14.
    Calendar • A calendaris to define the time duration of the project. i.e the working hours, days of the week and any holidays available for the project tasks, activities and resources. • A calendar can be classified in three categories. They are  Global Calendar :- • It is the common calendars that apply to all projects.  Project Calendar :- • It is a separate calendar for each project.  Resource Calendar :- • It is a separate calendar for each resource.
  • 15.
    Relationships • Relationships isthe method of identifying and documenting relationships among the project activities. • Activities are sequenced using logical relationships. • Each activity are connected to each other, they are known as predecessors and successors. • A B  A- predecessor  B- successor
  • 16.
    Types of Relationships •FINISH TO START • FINISH TO FINISH • START TO START • START TO FINISH
  • 17.
    Activities • The techniqueof decomposition, as applied to defining activities, involves subdividing the project work packages into smaller, more manageable components called activities. • Activities represent the effort needed to complete a work package. • The Activity definition includes the identifier and a scope of work description in sufficient detail to ensure that project team members understand what work is required to be completed.
  • 18.
    Types of Activities Start Milestone - To mark the beginning of major stage in the project  Finish Milestone - To mark the end of a major stage in the project  Level of Effort - For ongoing tasks that depend on its predecessor or successor activities .  Task Dependent - To use when multiple resources assigned to the same activity need to work together  Resource Dependent - To use when multiple resources assigned to the same activity can work independently  WBS Summary - To summarize a WBS level
  • 19.
    Schedule • A scheduleis to determine the amount of duration flexibility (the amount of float) on various logical network paths in the project schedule network, and to determine the minimum total project duration. • Forward Pass - Early Start and Early Finish dates • Backward Pass - Late Start and Late Finish dates • Milestones are frequently used to monitor progress, but there are limitations to their effectiveness. They usually show progress only on the critical path, and ignore non-critical activities.
  • 20.
    Schedule Techniques • Ganttchart • CPM • Network diagram (PERT)
  • 21.
    Gantt Charts • Agraphical representation of a Project that shows each task as a horizontal bar whose length is proportional to its time for completion. • In the GANTT Chart Time is displayed on the horizontal axis and the Tasks/ Activities are arranged vertically from top to bottom, in order of their start dates. • A detailed GANTT Chart for a large project might be quite complex and hard to understand. To simplify the chart Project manager can combine related activities into one Task.
  • 22.
    Critical Path Management •The Critical Path Method (CPM) scheduling technique is utilized to calculate project schedules. • CPM uses activity durations and relationships between activities to calculate schedule dates. • This calculation is done in two passes through the activities in a project.
  • 23.
    Activity Time (days)Immediate predecessors A 4 - B 3 - C 5 A,B D 1 - E 5 C F 2 D G 5 E,F H 6 G
  • 27.
    Terms •Project Duration: Minimumtime required to complete the project. •Total Float: Total amount of time that a scheduled activity may be delayed from its early start date without delaying project finish date or violating a schedule constraint. Total Float = LS – ES or LF – EF. •Critical Activities: Zero Total Float Activities . •Critical Path: Activities on the Longest Path in the network.
  • 28.
    TERMS •Free Float: Theamount of time that a scheduled activity can be delayed without delaying the early start date of an immediately following schedule. (Successors ES of next activity - EF)-1 •Lag: Lag specifies an offset or delay between an activity and its successor. •Lead: The negative value of lag is known as Lead.
  • 29.
    CALCULATIONS  Project Duration: A-C-E-G-H • A=>0+4 =4 • C=>5+5 =10 • E=>11+5 =16 • G=>17+5 =22 • H=>23+6 =29  B-C-E-G-H • B=>0+3 =3 • C=>4+5 =9 • E=>10+5 =15 • G=>16+5 =21 • H=>22+6 =28  D-F-G-H • D=>0+1 =1 • F=2+2 =4 • G=>5+5 =10 • H=>11+6 =21  Total Float: • A=>4-4 =0 • B=>4-3 =1 • C=>10-10=0 • D=>13-1 =12 • E=>16-16 =0 • F=>16-4 =12 • G=>22-22=0 • H=>29-29=0
  • 30.
    CALCULATIONS  Critical Activities: A  C  E  G  H  Critical Path:  A-C-E-G-H  Free float:  B-C:  (5-3)-1 =1  F-G:  (17-4)-1=12
  • 31.
    Network diagram (PERT) •Program Evaluation Review Technique. • PERT chart consists of tasks and events. • An event is called a milestone, representing a point in time, such as the start or completion of a task. • A task is also called an activity.
  • 32.
    Program Evaluation ReviewTechnique • PERT uses  Optimistic time (o) : It reflects minimum possible periods of time for an activity to be completed.  Pessimistic time (p) : It reflects maximum possible periods of time for an activity to be completed.  Realistic time (r) or the Most likely time , reflects the Project manager’s “Best Guess” of the amount of time required for a task completion. 1 2 5 6 8 4 3 7 START END