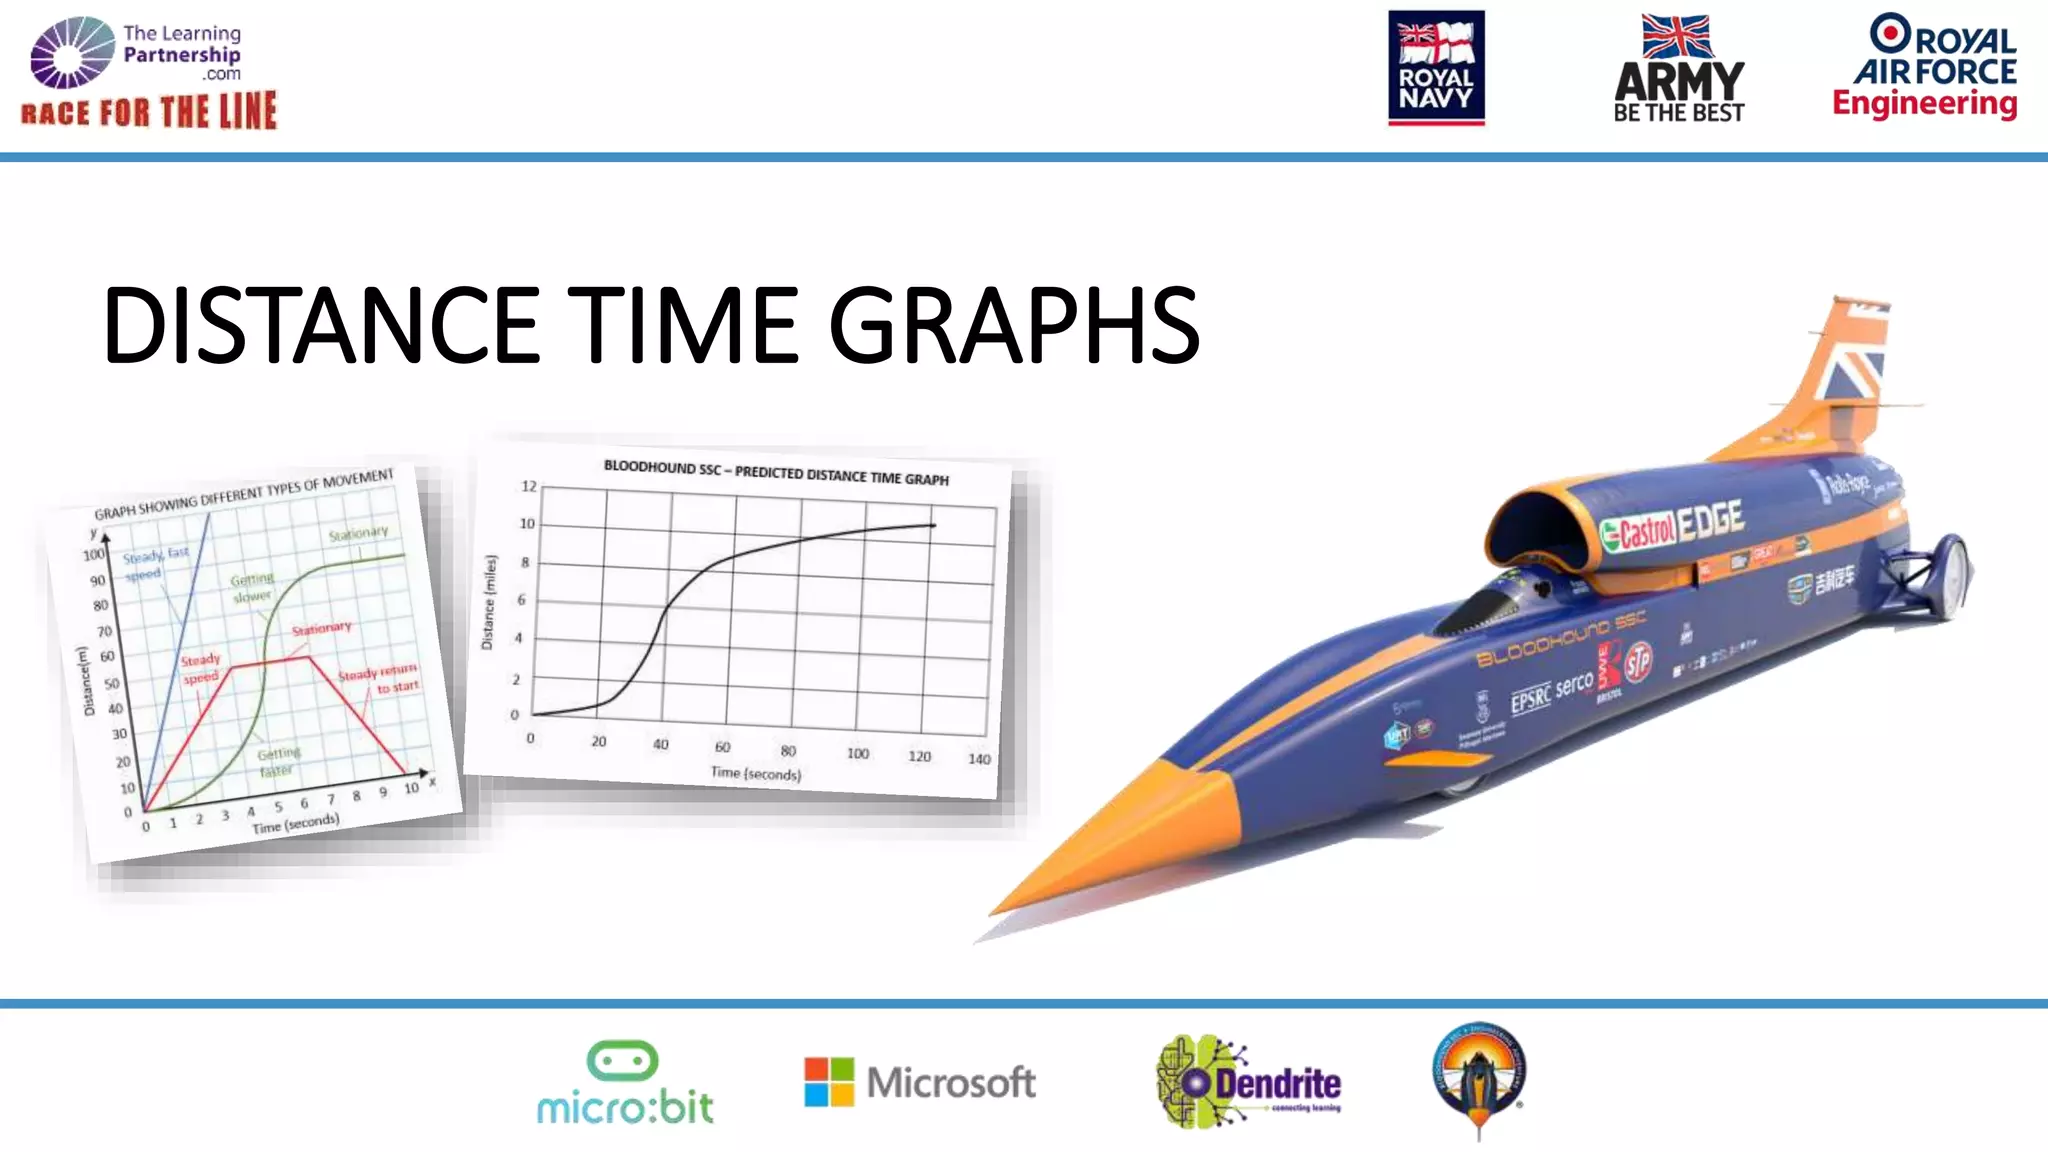
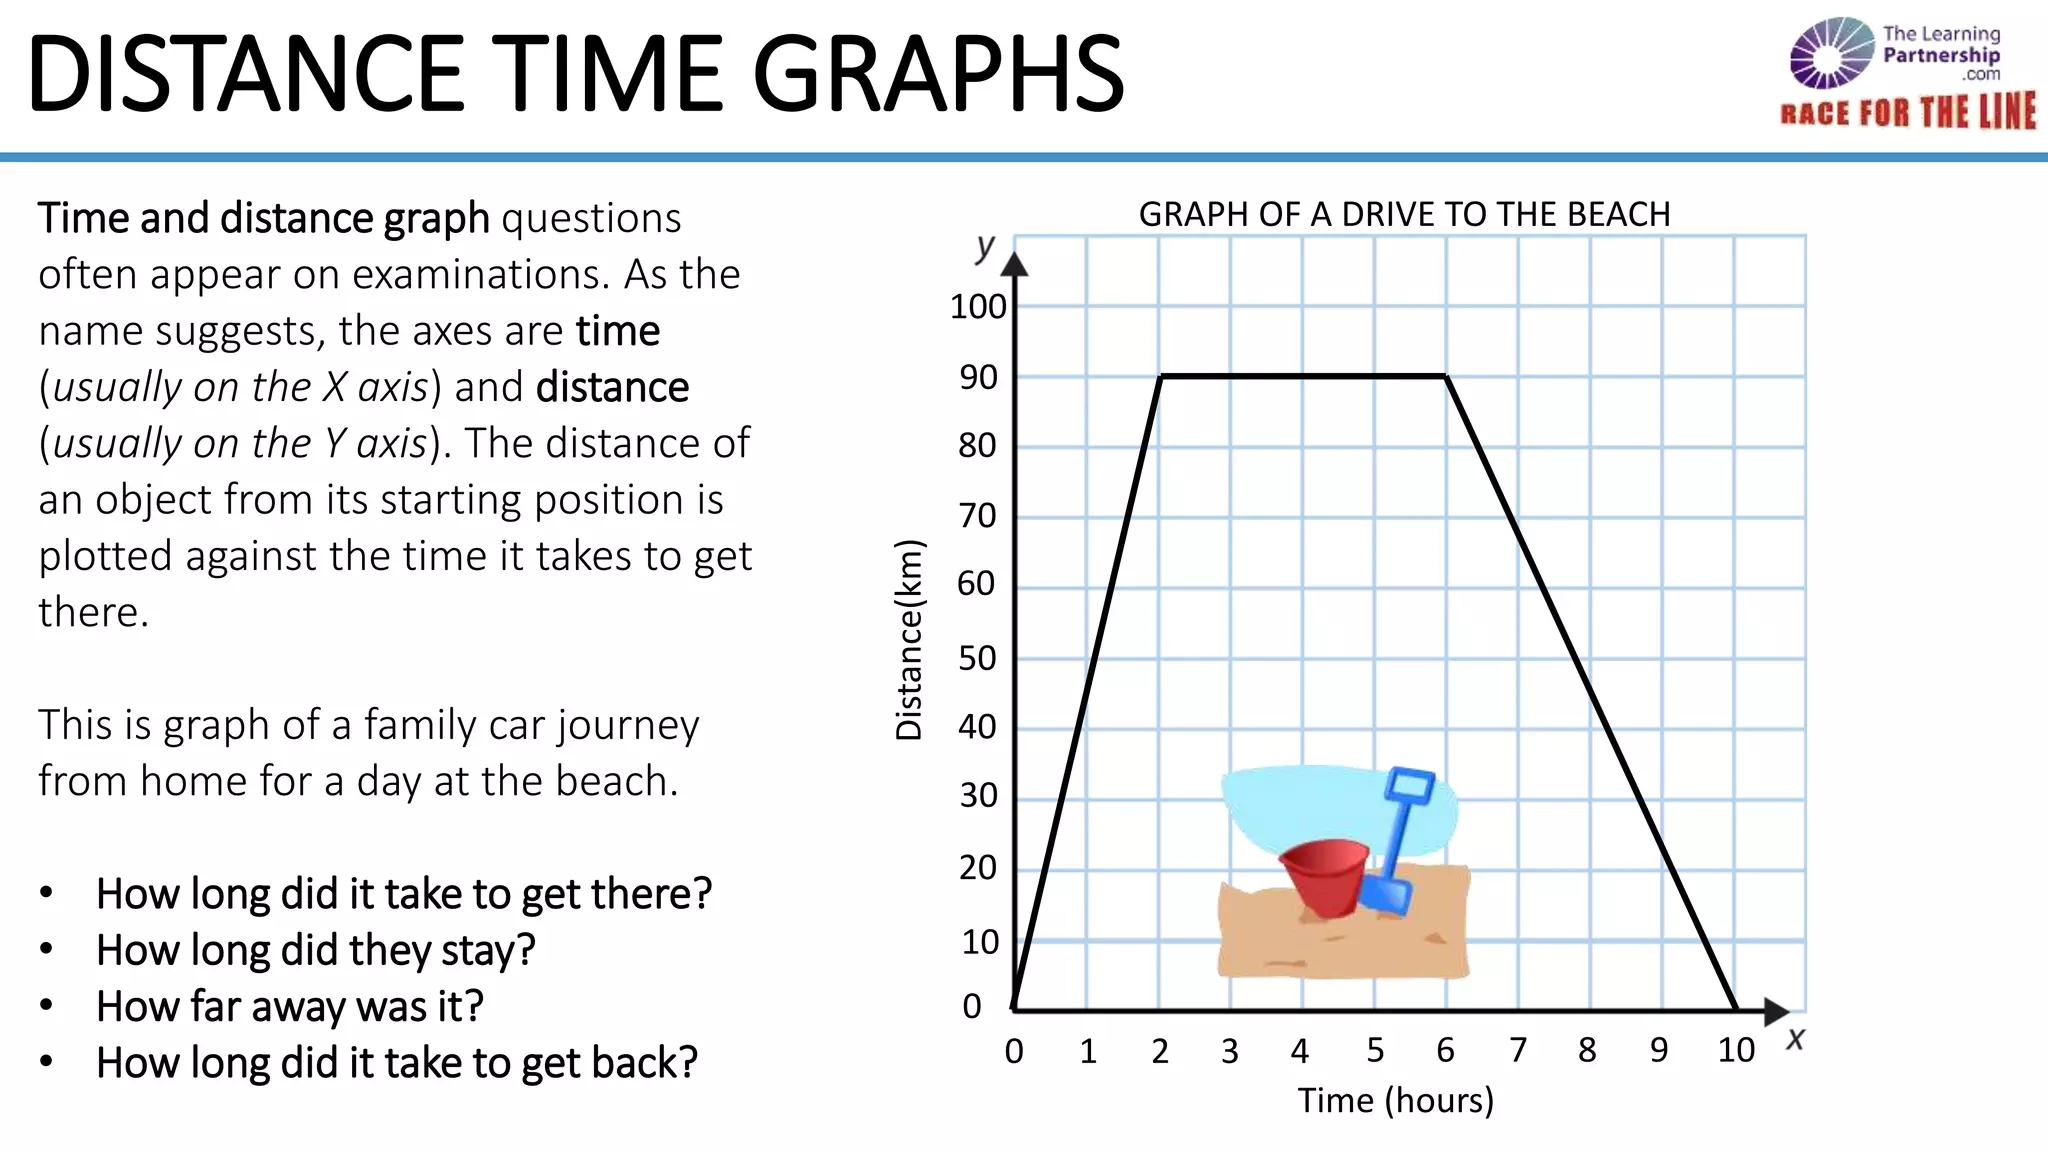
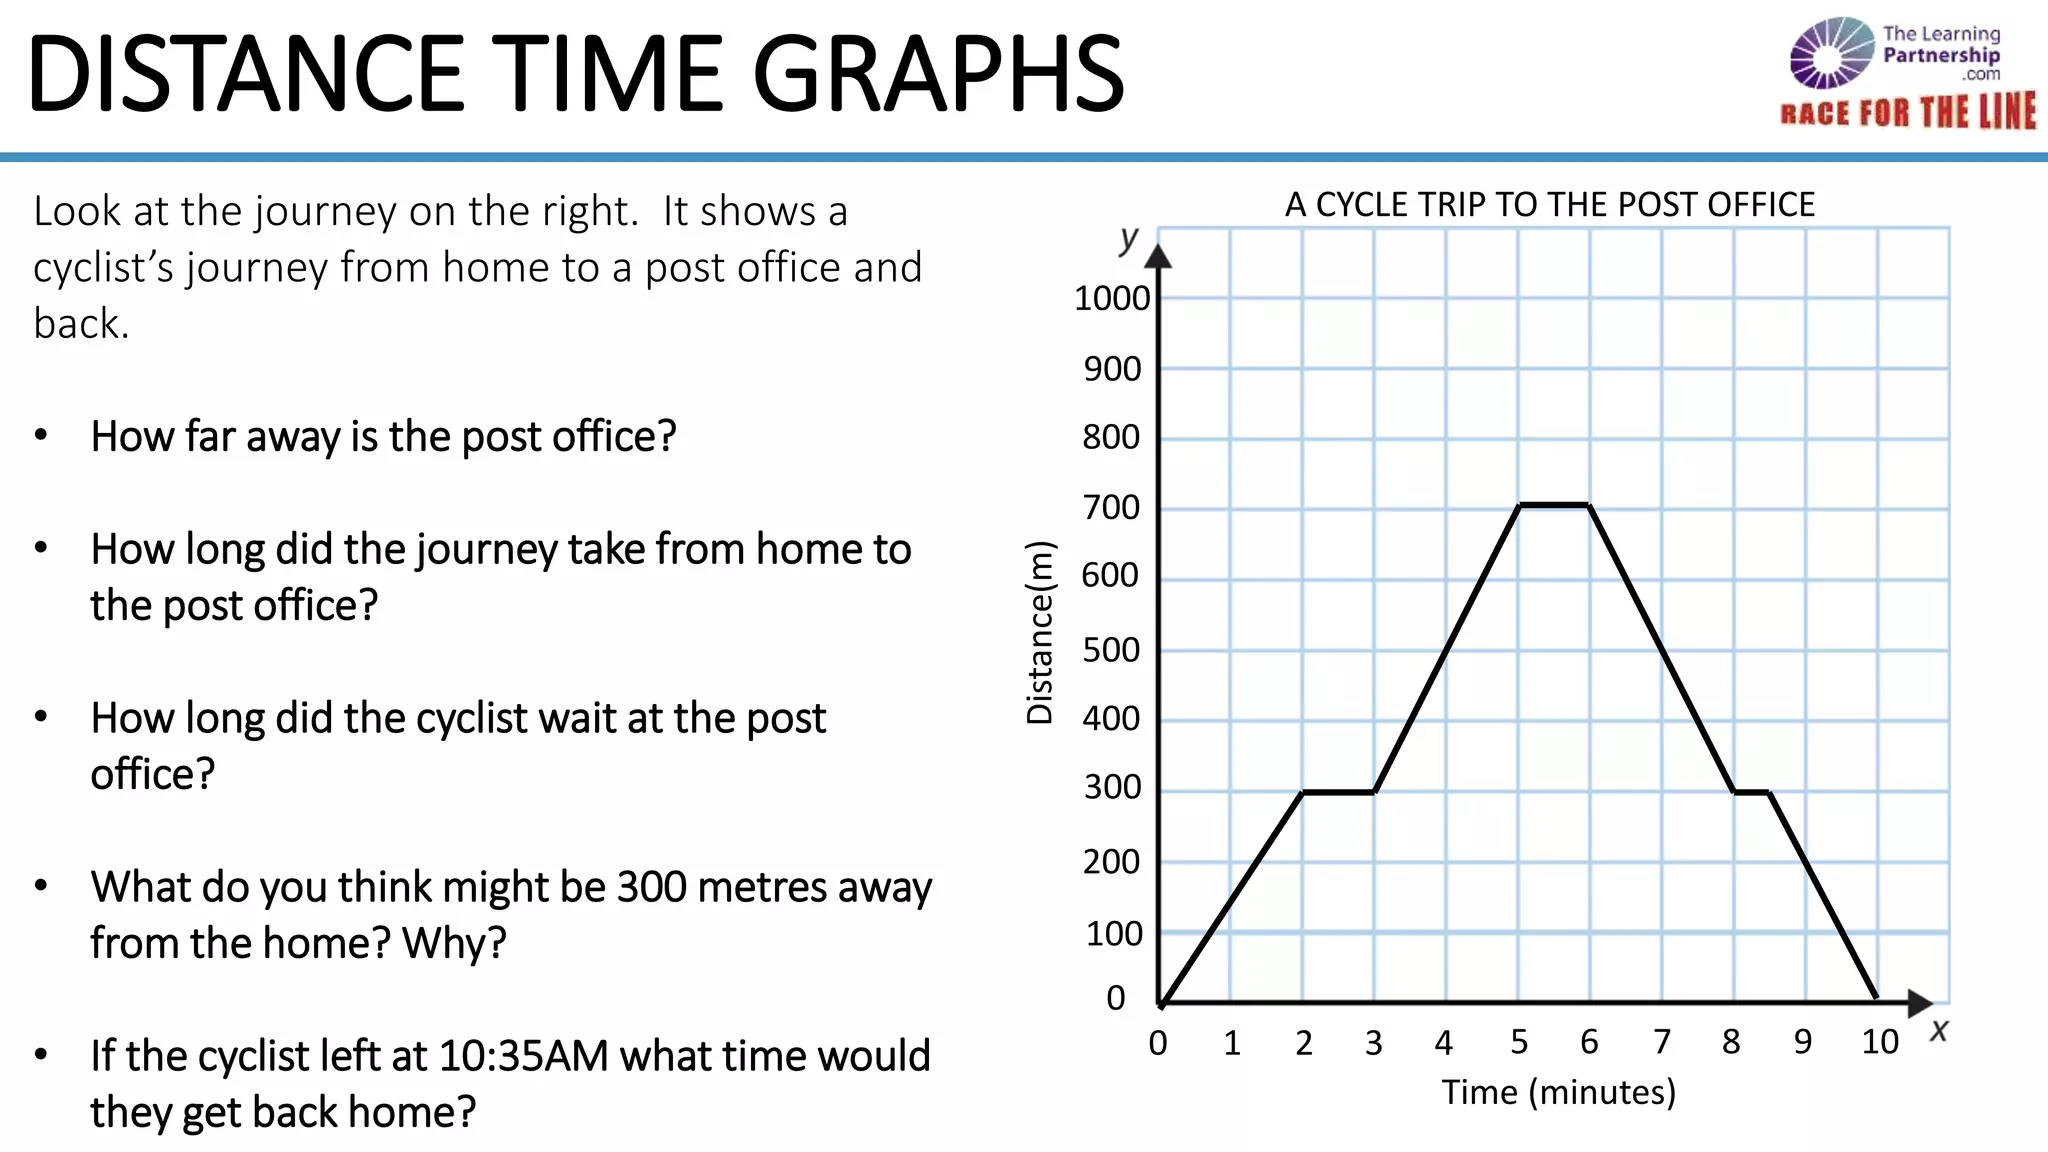
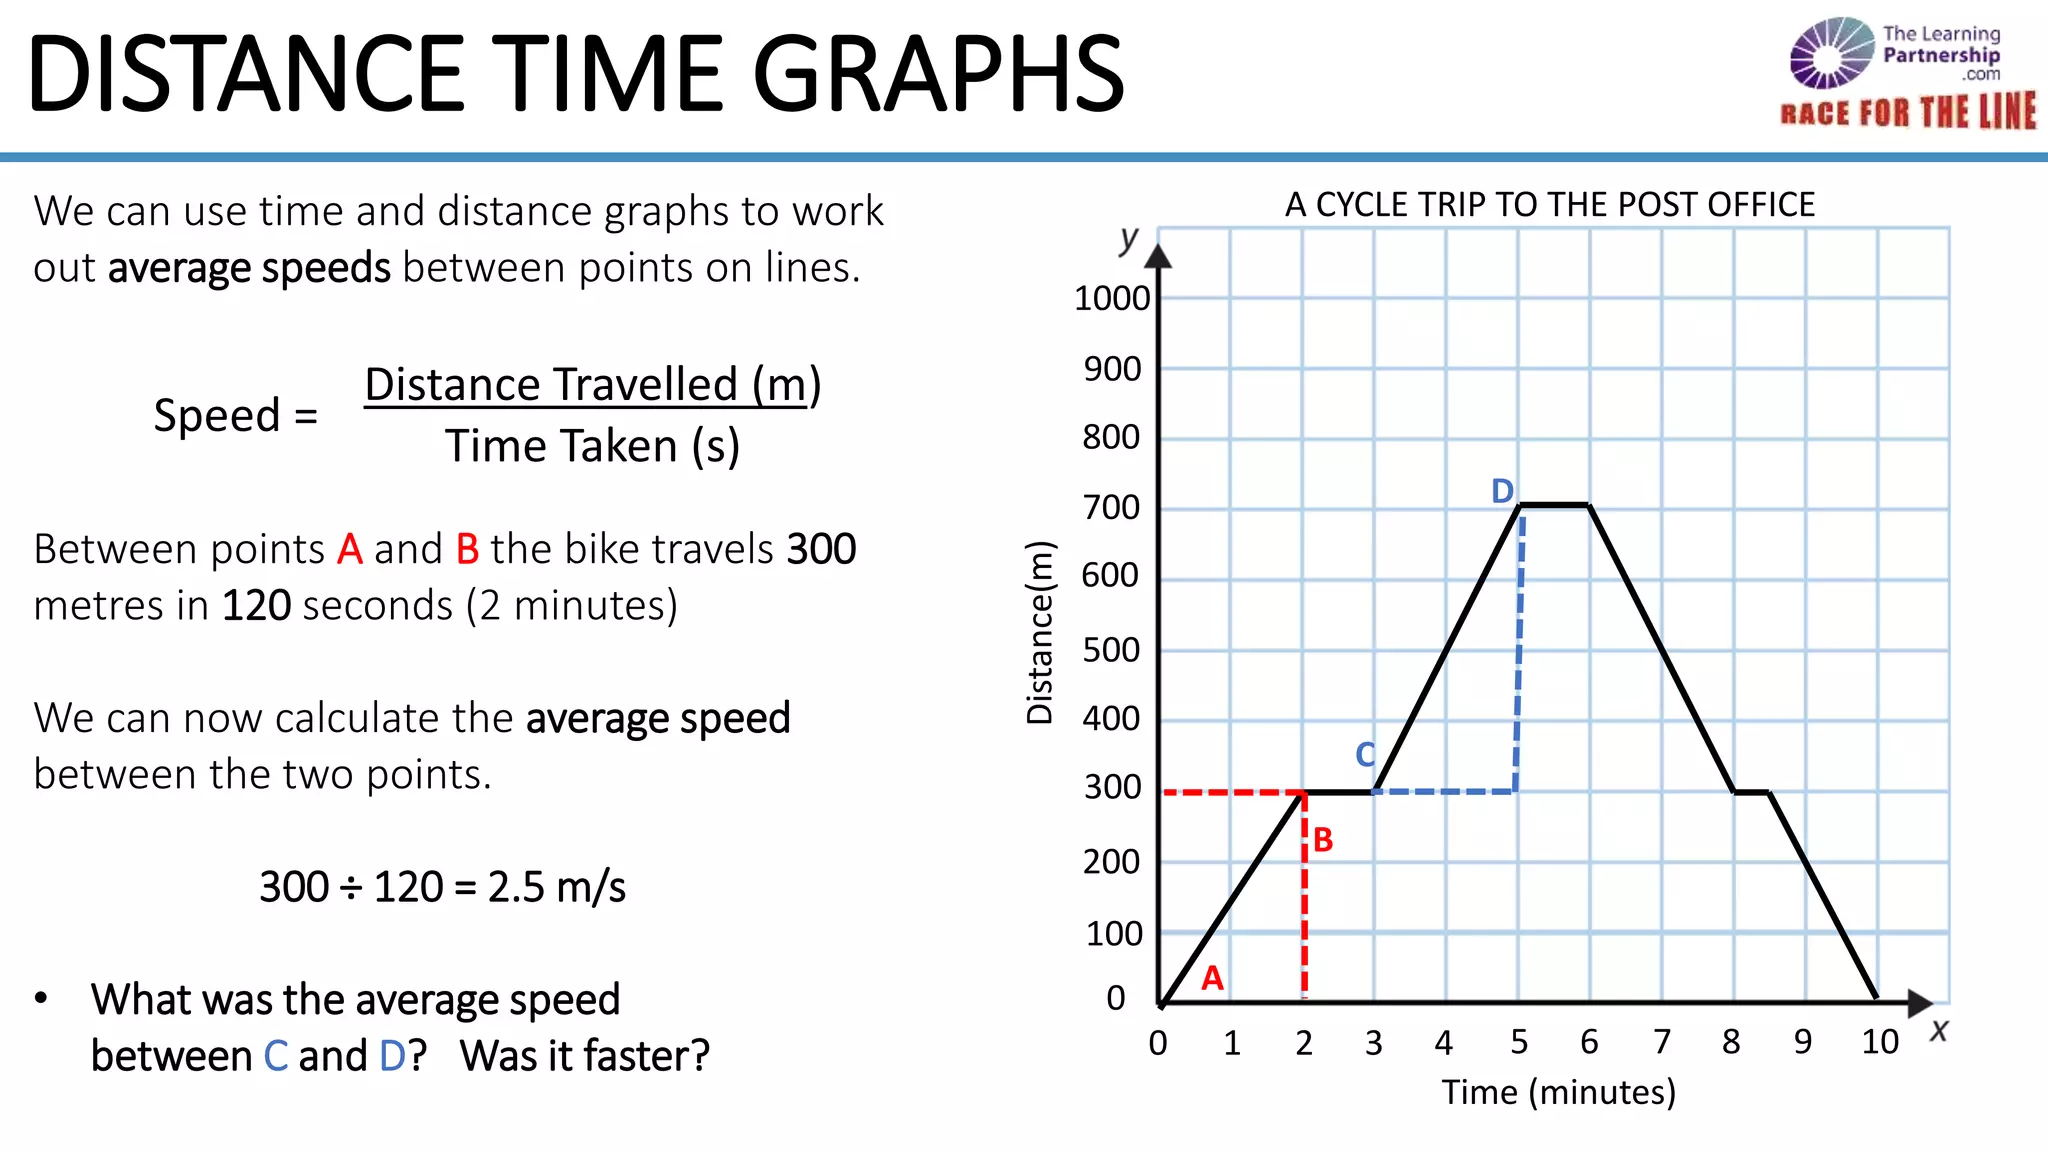
This document provides information about distance-time graphs, including:
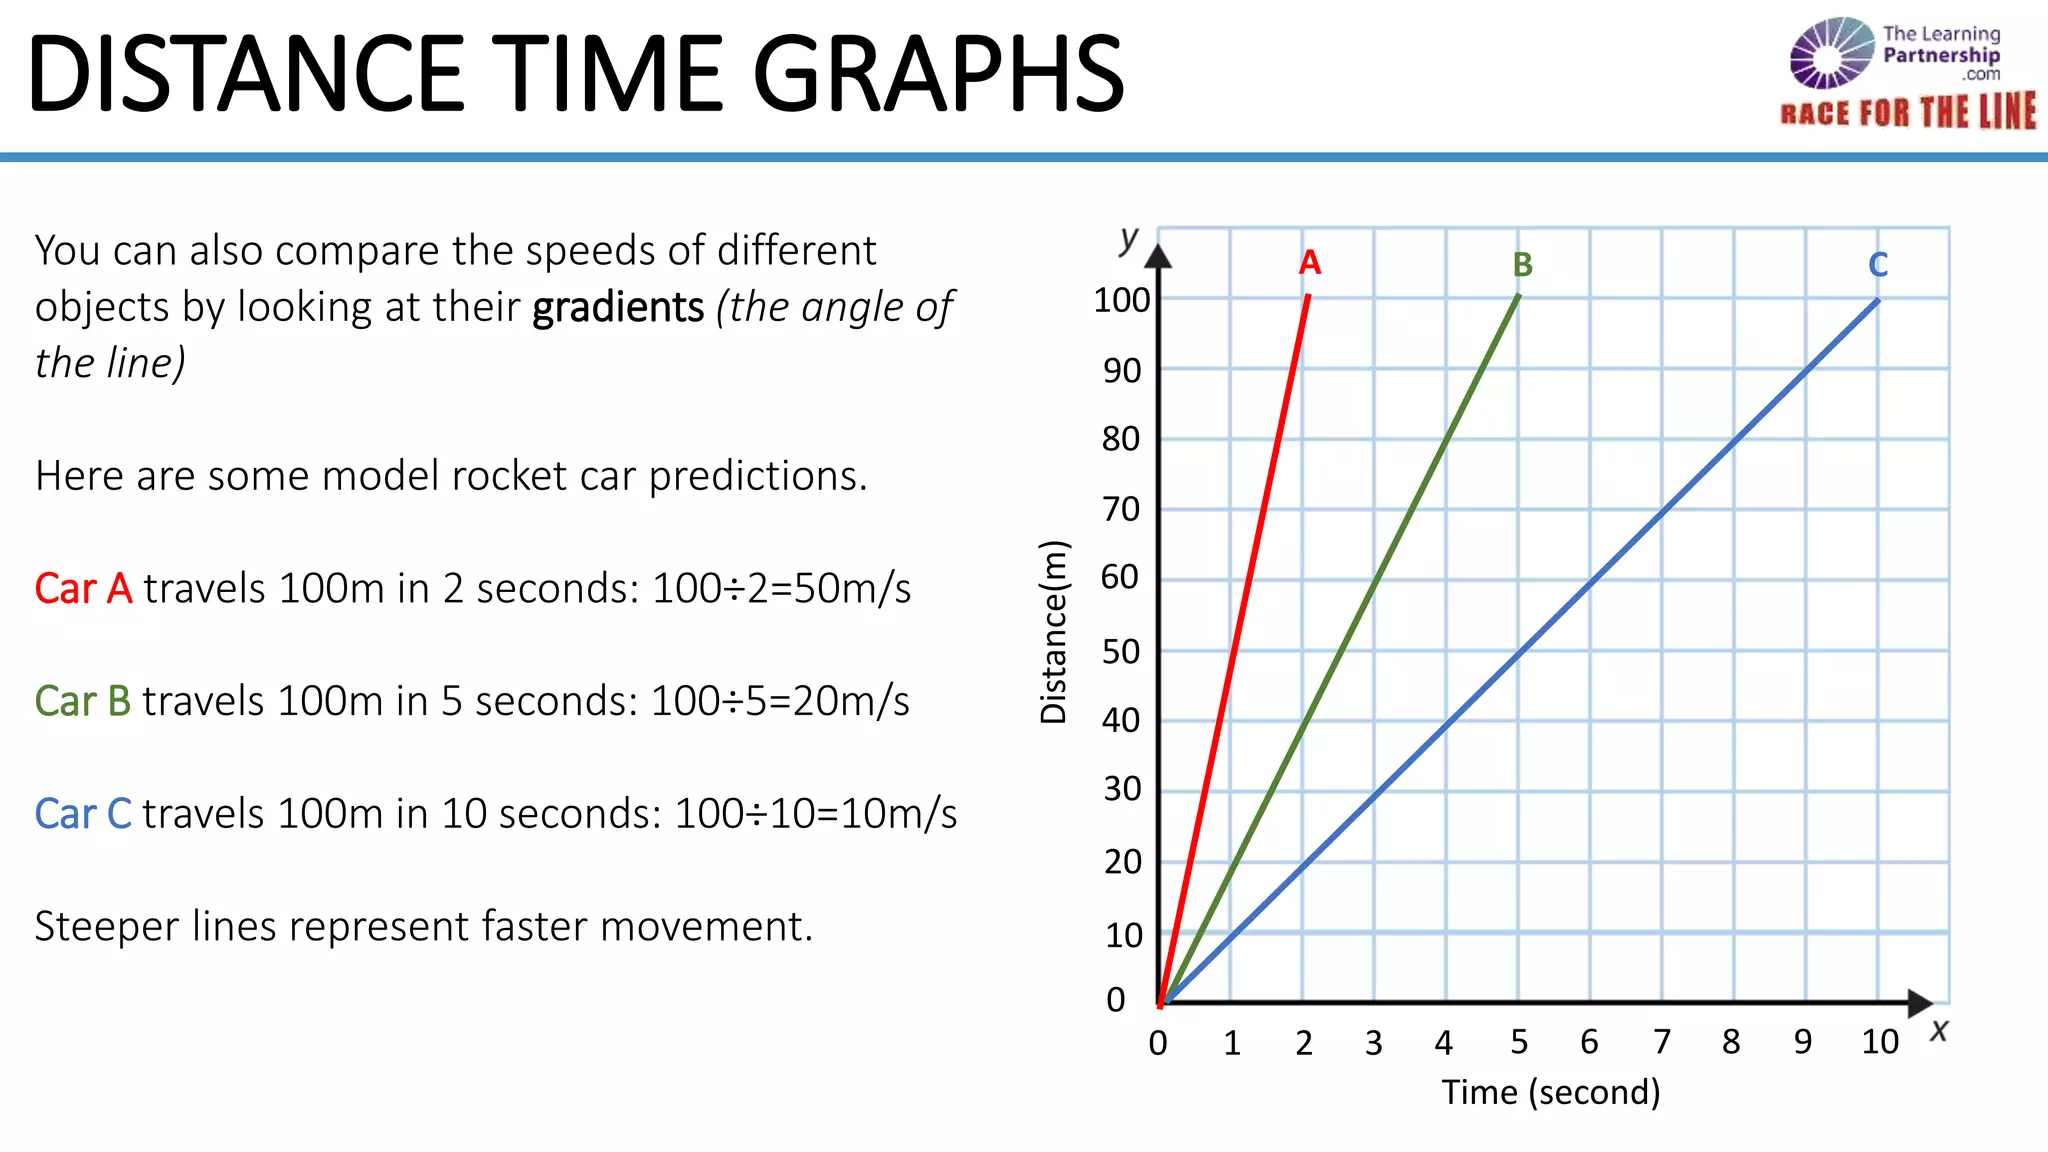
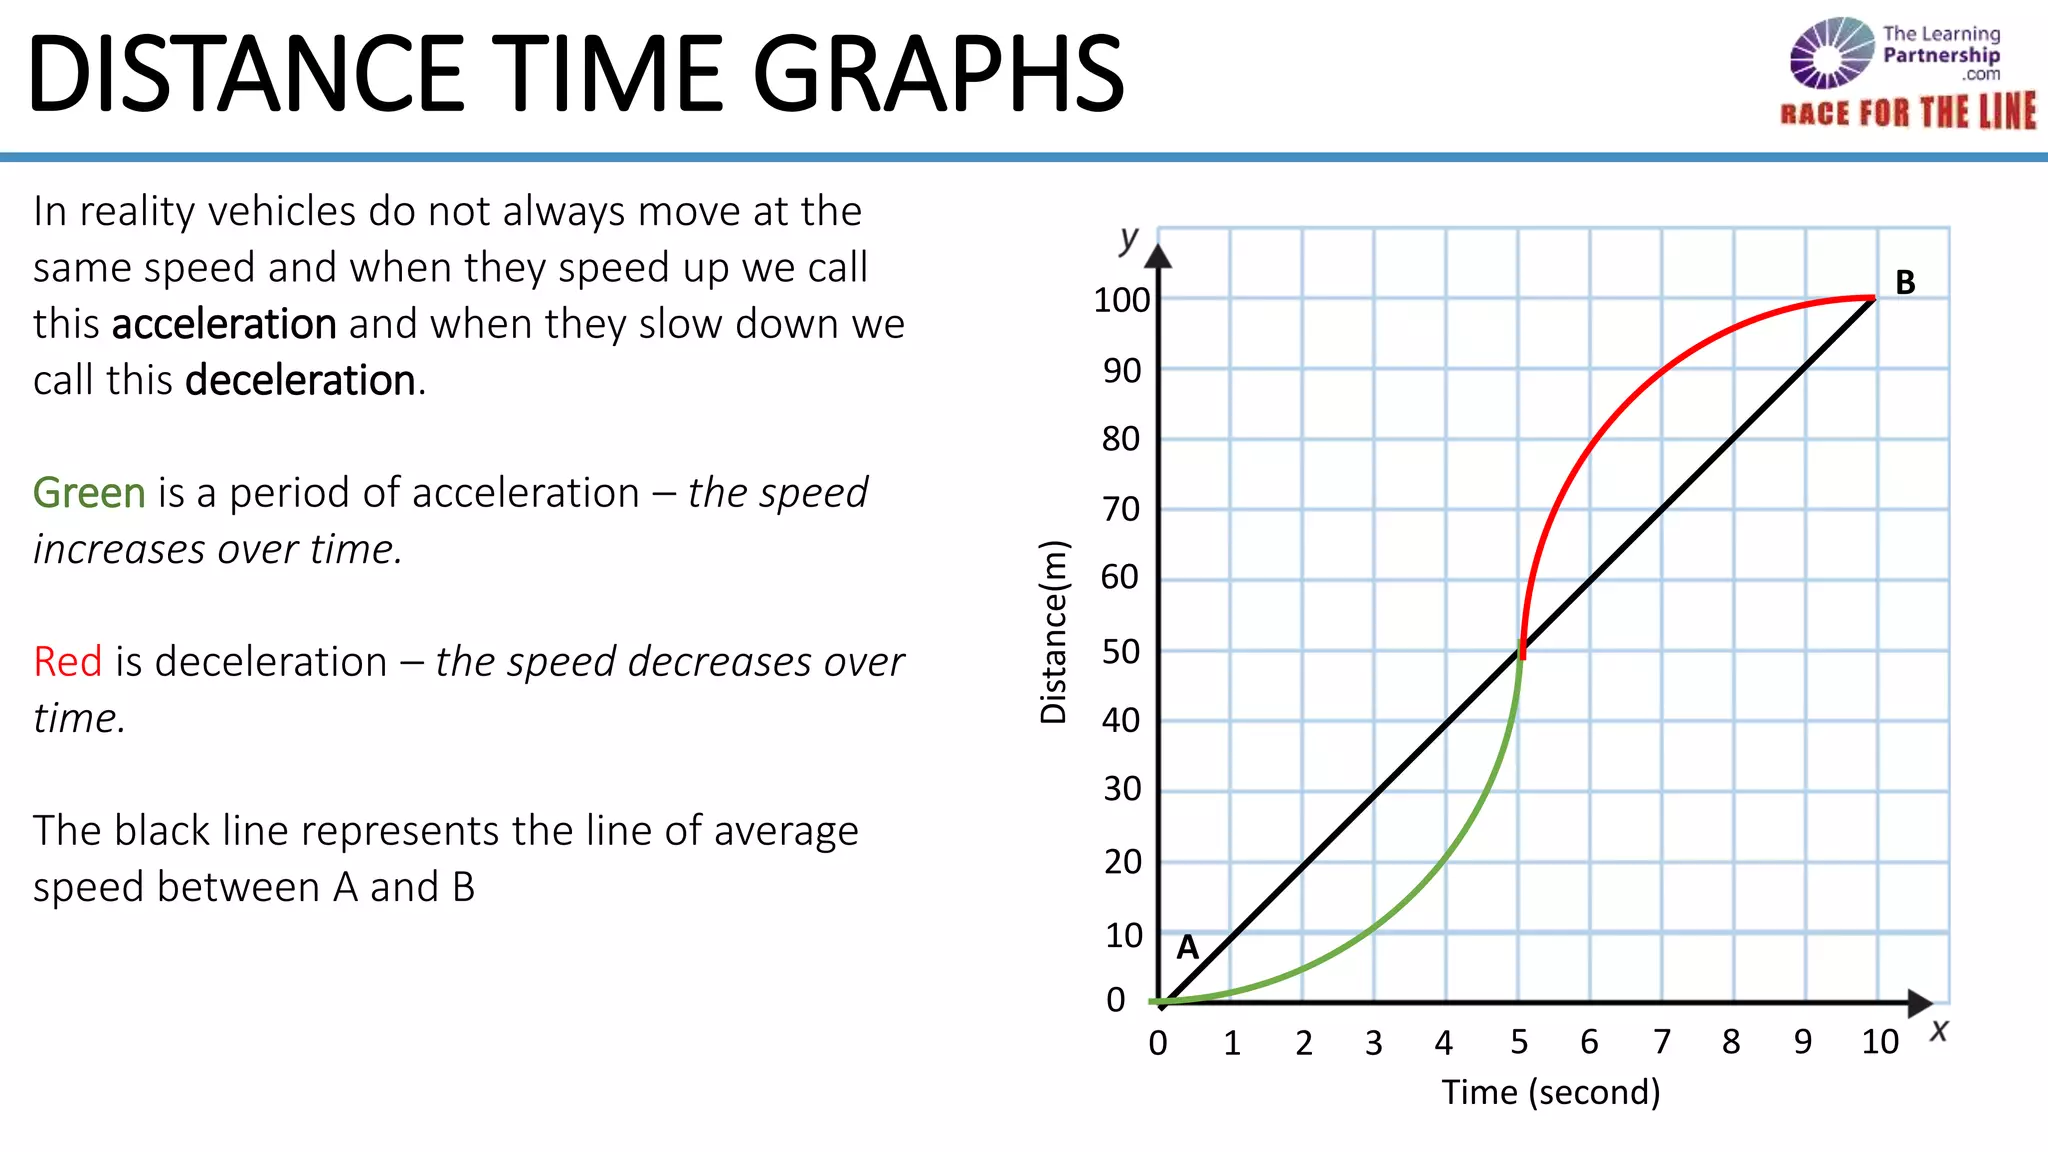
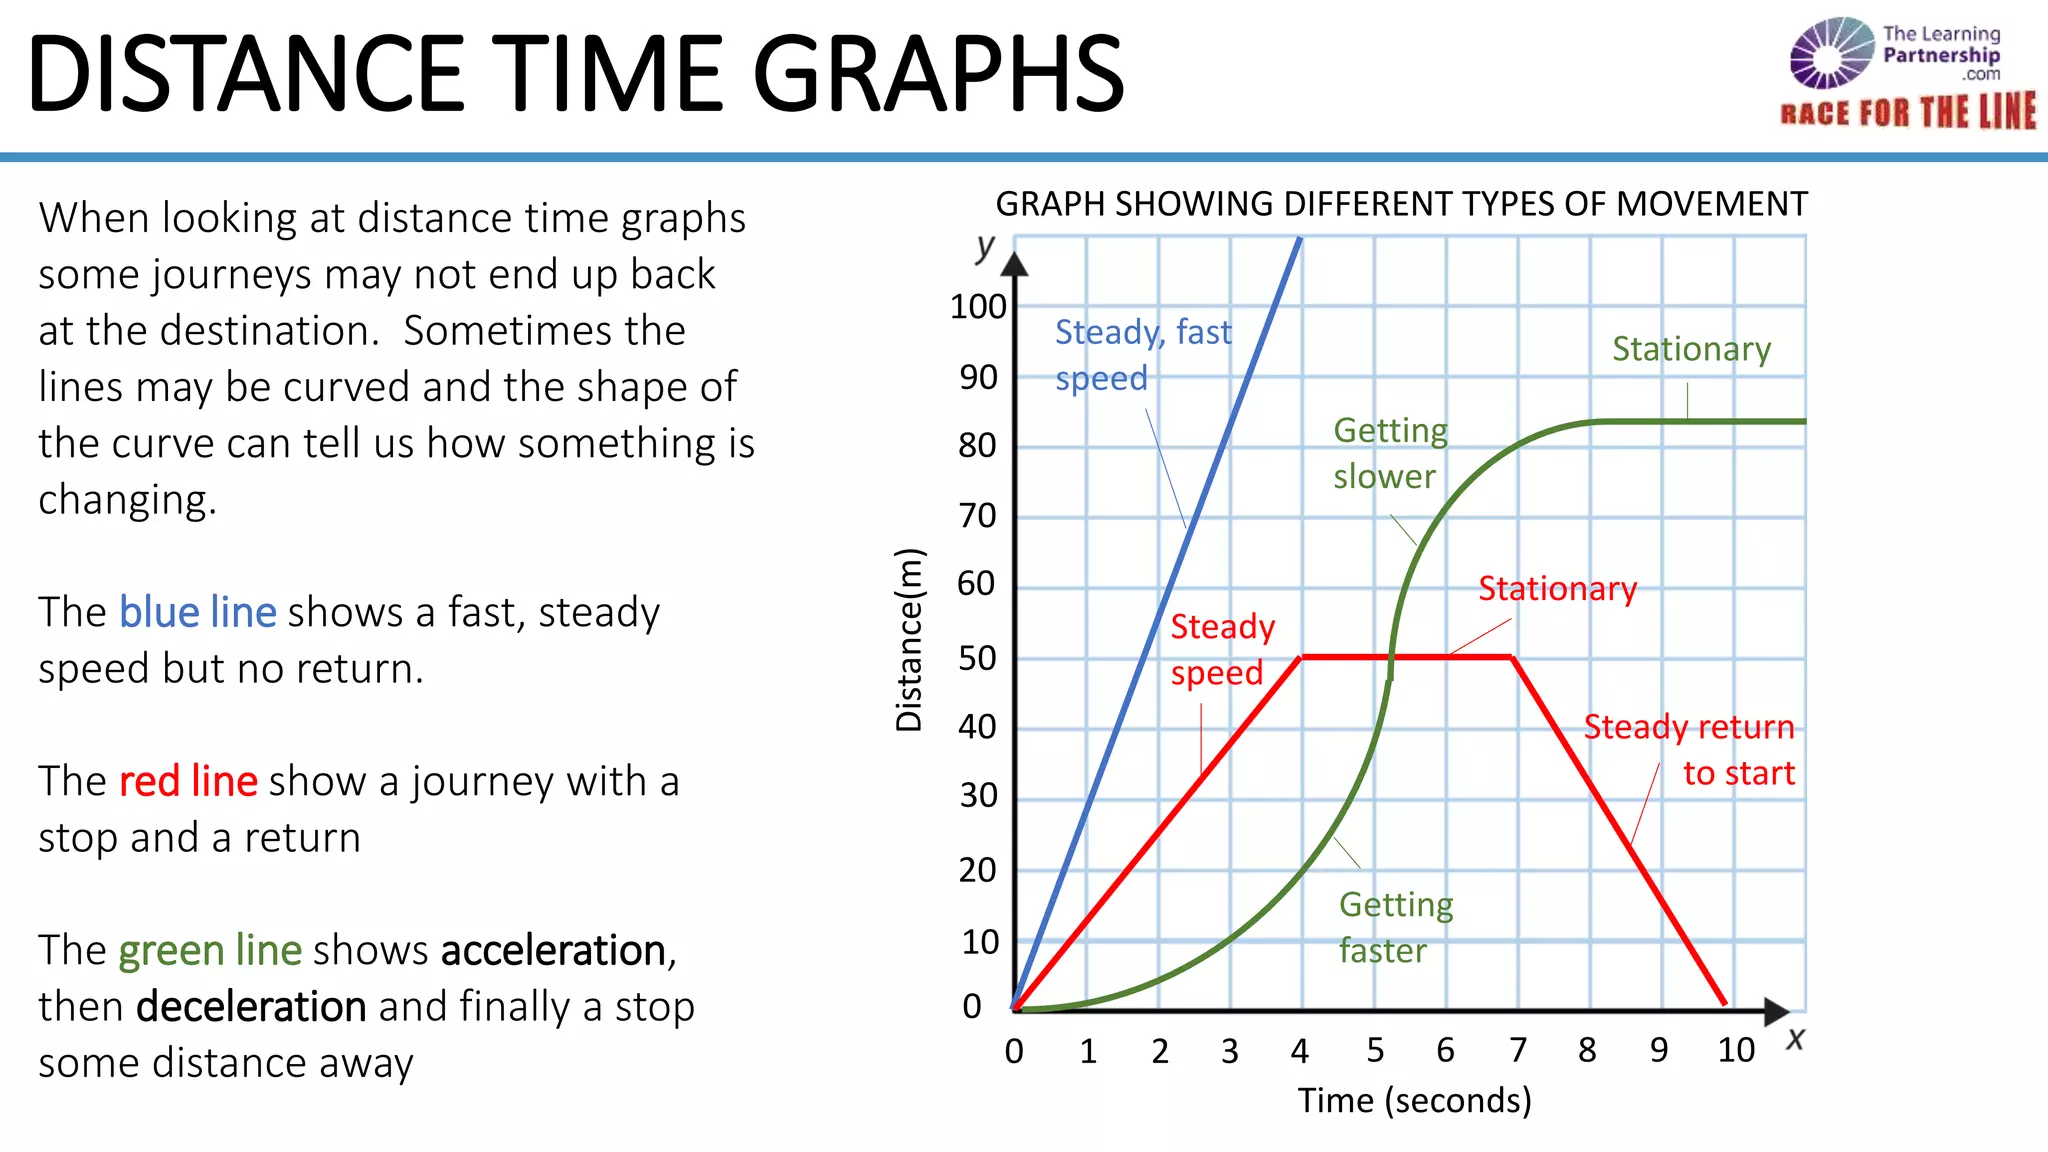
- Distance-time graphs plot the distance an object is from its starting point on the y-axis against time on the x-axis.
- Various graphs are presented and described showing examples of journeys by car and bicycle, which can be used to calculate information like distance, time, speed and acceleration.
- The slope of lines on the graphs represents speed, with steeper lines indicating faster movement. Curved lines can show changes in speed like acceleration and deceleration.
- Distance-time graphs can provide data to ask questions about distance, time, speed and changes in speed for different objects and scenarios.


![Topic 1 - Forces and Motion [Autosaved].pptx](https://cdn.slidesharecdn.com/ss_thumbnails/topic1-forcesandmotionautosaved-231219145058-b924d3b6-thumbnail.jpg?width=640&height=640&fit=bounds)


