Downloaded 104 times
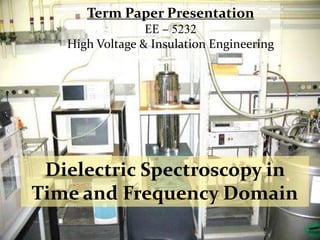
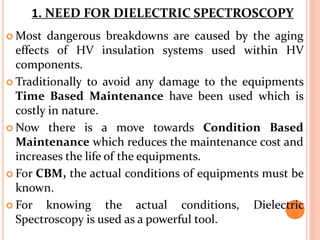
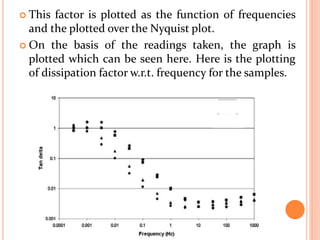
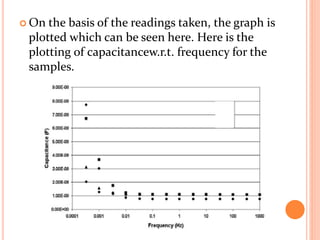

The document presents an overview of dielectric spectroscopy, highlighting its significance in assessing the condition of high voltage insulation systems to prevent breakdown due to aging effects. It explains the operational principles of frequency and time domain spectroscopy, emphasizing the measurements of dielectric properties and their dependency on various factors such as temperature and material composition. Additionally, it outlines precautions needed during measurements to ensure accuracy, such as maintaining constant insulation temperatures and controlling moisture content.


![Dielectric properties[read only]](https://cdn.slidesharecdn.com/ss_thumbnails/dielectricpropertiesread-only-220208052225-thumbnail.jpg?width=640&height=640&fit=bounds)


