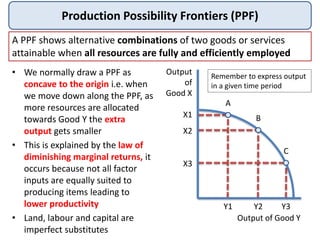
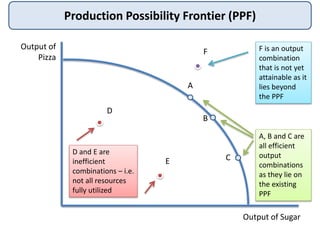
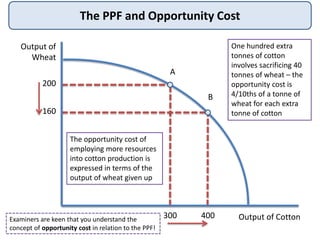
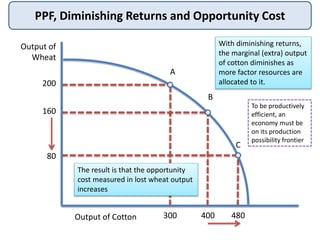
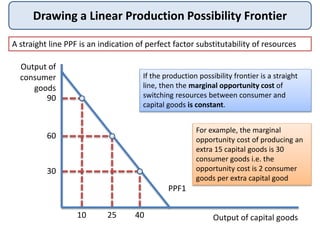
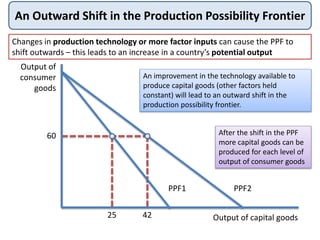
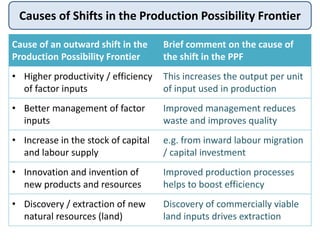
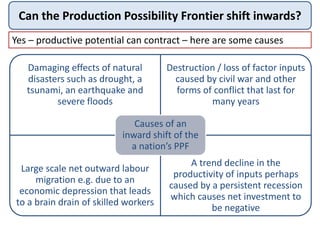
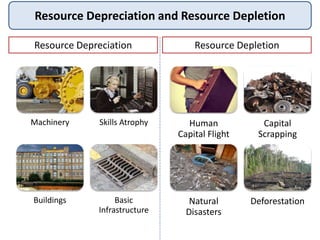
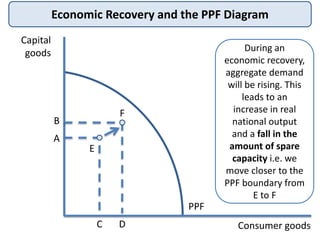
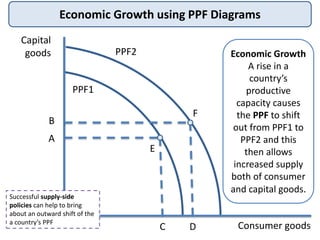
The document discusses production possibility diagrams (PPDs), also known as production possibility frontiers (PPFs). It explains that a PPF shows the maximum combinations of two goods or services an economy can produce given limited resources. The PPF is normally drawn as a concave curve to the origin to reflect diminishing returns. Points on the curve represent efficient production combinations, while inside points are inefficient as resources are underutilized. Shifts in the PPF can occur due to changes in resources, technology or productivity.