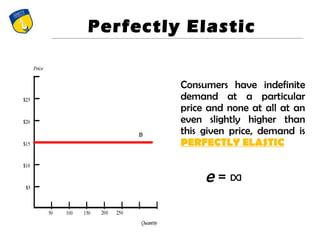
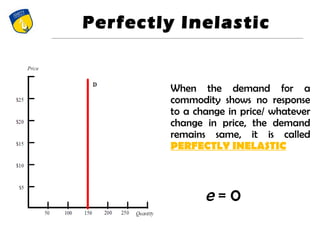
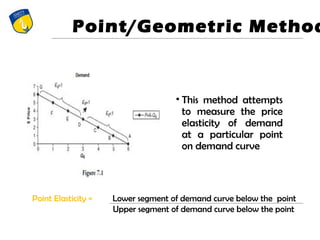
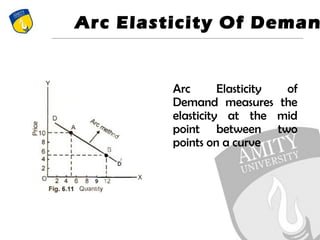
This document discusses the concept of elasticity of demand. It defines elasticity as the percentage change in one variable due to a percentage change in another variable. It then describes different types of elasticity including price elasticity, income elasticity, cross elasticity, and advertising elasticity. It provides examples and formulas for calculating each type. The document also discusses factors that influence elasticity, degrees of elasticity ranging from perfectly inelastic to perfectly elastic, and differences between short-run and long-run elasticity. It concludes by presenting a case study comparing estimated short-run and long-run price elasticities for various commodities in India and the United States.
Economics, Law of Demand, Determinants of Demand, increase and Decrease in Demand, Extension and Contraction in Demand, Exception of Demand, Assumptions of Demand
Price elasticity of supply measures the relationship between change in quantity supplied and a change in price.
Basically elasticity of supply shows the amounts that costs rise as production increases
• When Pes > 1, then supply is price elastic
• When Pes < 1, then supply is price inelastic
• When Pes = 0, then supply is perfectly inelastic
• When Pes = infinity, then supply is perfectly elastic following a change in demand
Definition of PED
Calculation of PED
Determinants of PED
PED and total spending on a product/revenue
Significance of PED
https://courses.lumenlearning.com/boundless-economics/chapter/price-elasticity-of-demand/#:~:text=The%20price%20elasticity%20of%20demand%20(PED)%20is%20calculated%20by%20dividing,the%20percentage%20change%20in%20price.
https://www.economicshelp.org/blog/195/economics/calculating-price-elasticity-of-demand/
https://www.tutor2u.net/business/reference/price-elasticity-of-demand
Normal laws of demand suggest that as prices increase demand decreases whilst firms attempt to supply more (with the opposite happening as prices decrease). The concept of elasticities asks the question ‘by how much does demand and supply change?’ Recent examination reports have made it clear that “price elasticity is an important topic and students should be prepared to apply it to the examination context as well as quote the formulas.” There is a lot to learn in this section – start with a good understanding of what elasticity it and how it is measured. Then consider why it matters for businesses to have a working knowledge / estimate of the coefficient of price elasticity of demand.
Indifference curve, microeconomics theory and assignments are prepared by expertsmind.com with the help of qualified and expert tutors.
http://www.expertsmind.com/economics-homework-assignment-help.aspx
Elasticity of Demand, Price and Income- Micro and Macro EconomicsMomina Riaz
To sustain the economy, you must know the elastic and inelastic demand of customers. In the uncertain environment and tough competitors, most of the businesses could not sustain their profitability and gone towards downfall. The keen observation related to price, demand, income, and supply makes you able to choose the right strategy for your business. This slide presentation covers Demand elasticity, price elasticity, income elasticity, its types, factors, and shapes with graphical representation.
This is a presentation by Dada Robert in a Your Skill Boost masterclass organised by the Excellence Foundation for South Sudan (EFSS) on Saturday, the 25th and Sunday, the 26th of May 2024.
He discussed the concept of quality improvement, emphasizing its applicability to various aspects of life, including personal, project, and program improvements. He defined quality as doing the right thing at the right time in the right way to achieve the best possible results and discussed the concept of the "gap" between what we know and what we do, and how this gap represents the areas we need to improve. He explained the scientific approach to quality improvement, which involves systematic performance analysis, testing and learning, and implementing change ideas. He also highlighted the importance of client focus and a team approach to quality improvement.
Model Attribute Check Company Auto PropertyCeline George
In Odoo, the multi-company feature allows you to manage multiple companies within a single Odoo database instance. Each company can have its own configurations while still sharing common resources such as products, customers, and suppliers.
We all have good and bad thoughts from time to time and situation to situation. We are bombarded daily with spiraling thoughts(both negative and positive) creating all-consuming feel , making us difficult to manage with associated suffering. Good thoughts are like our Mob Signal (Positive thought) amidst noise(negative thought) in the atmosphere. Negative thoughts like noise outweigh positive thoughts. These thoughts often create unwanted confusion, trouble, stress and frustration in our mind as well as chaos in our physical world. Negative thoughts are also known as “distorted thinking”.
Students, digital devices and success - Andreas Schleicher - 27 May 2024..pptxEduSkills OECD
Andreas Schleicher presents at the OECD webinar ‘Digital devices in schools: detrimental distraction or secret to success?’ on 27 May 2024. The presentation was based on findings from PISA 2022 results and the webinar helped launch the PISA in Focus ‘Managing screen time: How to protect and equip students against distraction’ https://www.oecd-ilibrary.org/education/managing-screen-time_7c225af4-en and the OECD Education Policy Perspective ‘Students, digital devices and success’ can be found here - https://oe.cd/il/5yV
How to Make a Field invisible in Odoo 17Celine George
It is possible to hide or invisible some fields in odoo. Commonly using “invisible” attribute in the field definition to invisible the fields. This slide will show how to make a field invisible in odoo 17.
Ethnobotany and Ethnopharmacology:
Ethnobotany in herbal drug evaluation,
Impact of Ethnobotany in traditional medicine,
New development in herbals,
Bio-prospecting tools for drug discovery,
Role of Ethnopharmacology in drug evaluation,
Reverse Pharmacology.
How to Create Map Views in the Odoo 17 ERPCeline George
The map views are useful for providing a geographical representation of data. They allow users to visualize and analyze the data in a more intuitive manner.
The Indian economy is classified into different sectors to simplify the analysis and understanding of economic activities. For Class 10, it's essential to grasp the sectors of the Indian economy, understand their characteristics, and recognize their importance. This guide will provide detailed notes on the Sectors of the Indian Economy Class 10, using specific long-tail keywords to enhance comprehension.
For more information, visit-www.vavaclasses.com
The Art Pastor's Guide to Sabbath | Steve ThomasonSteve Thomason
What is the purpose of the Sabbath Law in the Torah. It is interesting to compare how the context of the law shifts from Exodus to Deuteronomy. Who gets to rest, and why?
2. TERMS TO BE
DISCUSS• Types of elasticity of demand
1. Income elasticity
2. Price elasticity
3. Cross Elasticity
4. Adversity of elasticity
• Measurement of elasticity
• Degree of elasticity
• Determinations of Elasticity
• Factors Influencing Elasticity
• Long and short run elasticity
• Case Study
3. What is an Elasticity?
Measurement of the percentage
change in one variable that results
from a % change in another
variable, and the other variables
will remain constant .
4. Types Of Elasticity Of
Demand
Demand
Price
Elasticity
Cross Price
Elasticity
Advertisement
Elasticity
Income
Elasticity
5. The price elasticity of Demand may be defined as the
ratio of the relative change in demand and price
variables.
ed= percentage/proportional change in quantity demanded
percentage/proportional change in price
Price Elasticity Of Demand
6. EXAMPLE
If is to be noted that each individual may respond
differently to the change in price.
If P increases by 10 per cent, and if as a result Mrs.
Rashid buys, 5% less of a commodity, whereas Mrs.
Abdullah buys 20 per cent less of the commodity,
we can say that Mrs. Abdullah’s demand for the
commodity for the price range is more elastic than that
of Mrs. Rashid. Conversely, Mrs. Rashid’s demand for the
commodity with the given price range is less elastic than
Mrs. Abdullah’s.
9. Perfectly Elastic
Consumers have indefinite
demand at a particular
price and none at all at an
even slightly higher than
this given price, demand is
PERFECTLY ELASTIC
e = ∞
10. Perfectly Inelastic
When the demand for a
commodity shows no response
to a change in price/ whatever
change in price, the demand
remains same, it is called
PERFECTLY INELASTIC
e = 0
11. Relatively
Inelastic
When the proportion of
change in the quantity
demanded is less than that of
price the demand is
considered to be
RELATIVELY INELASTIC
e < 1
12. Unitary Elastic
When the proportion of
change in demand is
exactly the same as the
change in price, the
demand is said to be
UNITARY ELASTIC
e = 1
13. Cross Elasticity Of
Demand
The cross elasticity of demand refers to the degree
of responsiveness of demand for a commodity to a
given change in the price of some related
commodity.
Cross Elasticity Of Demand =
Proportionate/percentage change in demand for x
Proportionate/percentage change in price of y
14. Advertising
Elasticity
Advertising elasticity is a measure of an advertising
campaign's effectiveness in generating new sales. It is
calculated by dividing the percentage change in the
quantity demanded by the percentage change in
advertising expenditures. A positive advertising
elasticity indicates that an increase in advertising
leads to an increase in demand for the advertised
good or service.
15. Income Elasticity Of
Demand
The income elasticity is defined as a ratio
percentage change in the quantity demanded
to the percentage or proportional change in
income.
Income Elasticity = percentage change in quantity demanded
percentage change in income
17. Point/Geometric Method
• This method attempts
to measure the price
elasticity of demand
at a particular point
on demand curve
Point Elasticity = Lower segment of demand curve below the point
Upper segment of demand curve below the point
18. The Percentage
Method
The price elasticity of demand is
measured by its coefficient Ep. This
coefficient Ep measures the percentage
change in the quantity of a commodity
demanded resulting from a given
percentage change in its price
19. Arc Elasticity Of Deman
Arc Elasticity of
Demand measures the
elasticity at the mid
point between two
points on a curve
20. Degrees Of Elasticity
•A small fall in the price of a product may lead to a
considerable increase in the quantity demanded,
but sometimes even a considerable fall in price
may not lead to any increase in demand.
5 Types
1.Unit Elasticity:
2.Relatively elastic demand (ed > 1):
3.Relatively inelastic demand (ed < 1):
4.Perfectly inelastic demand (ed = 0):
5.Perfectly elastic demand (ed = ∞):
21. Unit Elasticity
Demand is unit elastic when percentage
change in quantity demand and percentage
in price are equal.
In case of unit elastic demand the demand
curve is a Rectangular Hyperbola. In practice
it is difficult to find such commodities as have
a demand curve whose elasticity is unit
throughout.
22. Relatively elastic demand (ed
> 1
The demand is relative elastic or more than
unity when relative change in quantity
demanded is more than the relative change
in price. In such cases the demand curve is of
less slope.
23. Relatively
inelastic
Demand (ed < 1)
Demand is said to be relatively inelastic or
less than unity when proportionate change in
demand is less than proportionate change in
price. In such cases the slope of demand curve
falls rapidly.
24. Perfectly inelastic demand
(ed = 0)
When there is no change in demand as a
result of increase or decrease in price
then the demand is perfectly inelastic.
The demand curve is vertical on OX axis
25. Perfectly elastic demand (ed =
oc)
The demand is perfectly elastic when
even a small change in price cause an
infinite large change in amount
demanded.
A small rise in price on the part of a
seller reduces the demand to zero. In such
cases the demand curve is parallel to OX
axis.
26. Factors Influencing
Elasticity
Of Demand
• Nature of commodity
• Availability of substitutes
• Number of uses
• Consumers income
• Height of price and
range of price change
• Proportion of
expenditure
• Durability of the
commodity
• Habit
• Complementary goods
• Time
• Recurrence of demand
• Possibility of
postponement
27. Determinants of
Elasticity
• Time period
the longer the time under consideration the more elastic a
good is likely to be
• Number and closeness of substitutes
the greater the number of substitutes,
the more elastic
• The proportion of income taken up by the product
the smaller the proportion the more inelastic
• Luxury or Necessity
for example, addictive drugs
28. Elasticity of Demand in
Short Run/ Long Run
In the short run demand is likely to be more inelastic .
In the long run demand is likely to be Cross elasticity.
If people are used to buying a good, then when the price goes
up, they will tend to keep buying it out of habit. However,
when they realise the price rise is permanent they will expend
more energy and time in looking for alternatives. Therefore,
over time, people are more likely to find alternatives.
CASE – Windows
Also, if a firm like Microsoft increase price of windows
operating system, in the short term demand is likely to be
inelastic (people are used to using windows so continue to pay
higher price) However, over time, people may get fed up with
paying high price for windows and consider switching systems
29. CASE STUDY
The first seven rows of Table 3-3 give the estimated value of the
short-run and long-run price elasticity's of demand (Ep) for
selected commodities in New Delhi. These elasticity's are
computed based on primary survey with a sample of 115
consumers from different regions of Delhi. The rest of the table
shows elasticity's for selected commodities in the United States.
The table shows that the long-run price elasticity of demand for
most commodities is much larger than the corresponding short-
run price elasticity.
For example, the table shows that the price elasticity of
demand for clothing in Delhi is 1.1 in the short run but becomes
Price elasticity of demand in real world
30. Commodity Short Run Long Run
Urban India"
Butter 1.478 2.78
Petrol 0.3 0.9
Tea 0.712 1.14
Coffee* 0.292 0.685
Beer 0.85 1.18
Burger 1.49 2.79
Clothing 1.1 2.88
US
Clothing" 0.90 2.90
Tobacco products'' 0.46 1.89
Beer" 1.72 2.17
Electricity (household)'' 0.13 1.89
Gasoline^ 0.25 0.92
Elasticity chart
31. 2.88 in the long run. This means that a 1 percent
increase in price leads to a reproduction in the
quantity demanded of clothing of 1.1 percent in the
short run but 2.88 percent in the long run. Although
the price elasticity of demand for petrol is about three
times higher in the long run than in the short run, the
demand for petrol remains price inelastic.
It should be noted that the estimated price
elasticity of demand for any commodity is likely to
vary (sometimes widely) depending on the nation
under consideration, the time period examined, and
the estimation technique used. Thus, estimated price
elasticity values should be used with caution