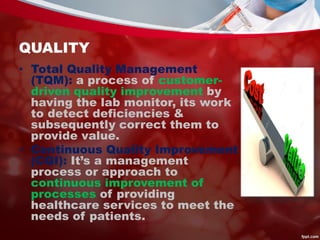
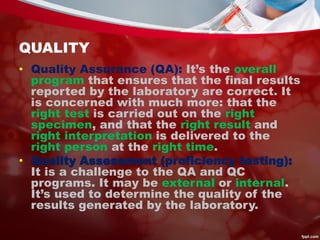
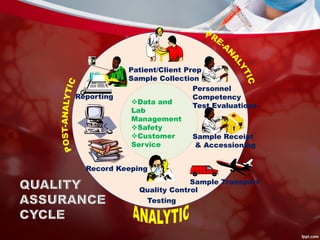
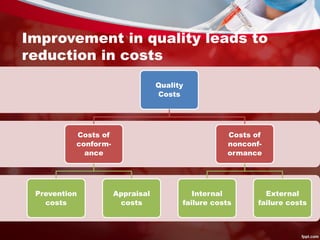
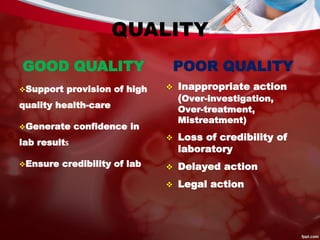
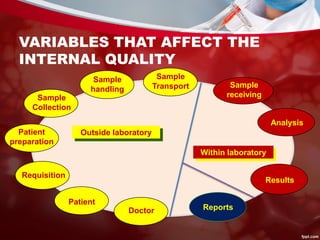
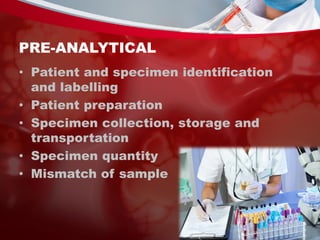
QUALITY CONTROL IN
LABORATORY
QUALITY
• Doing the right thing right, the first
time and every time.
• Is fitness for use “Juran”: a service
which is free from deficiencies and
meets customers need
• It’s invisible when GOOD & impossible
to ignore when BAD
• Dimensions:
Appro-
priate-
ness
Time-
liness
Avail-
ability
Comp-
etency
Contin-
uity
Effec-
tive-
ness
Effic-
acy
Effic-
iency
Preven-
tion/
Early
Detec-
tion
Respe-
ct and
caring
Safety
QUALITY
• Total Quality Management
(TQM): a process of customer-
driven quality improvement by
having the lab monitor, its work
to detect deficiencies &
subsequently correct them to
provide value.
• Continuous Quality Improvement
(CQI): It’s a management
process or approach to
continuous improvement of
processes of providing
healthcare services to meet the
needs of patients.
QUALITY
• Quality Assurance (QA): It’s the overall
program that ensures that the final results
reported by the laboratory are correct. It
is concerned with much more: that the
right test is carried out on the right
specimen, and that the right result and
right interpretation is delivered to the
right person at the right time.
• Quality Assessment (proficiency testing):
It is a challenge to the QA and QC
programs. It may be external or internal.
It’s used to determine the quality of the
results generated by the laboratory.
Data and
Lab
Management
Safety
Customer
Service
Patient/Client Prep
Sample Collection
Sample Receipt
& Accessioning
Sample Transport
Quality Control
Record Keeping
Reporting
Personnel
Competency
Test Evaluations
Testing
Improvement in quality leads to
reduction in costs
Quality
Costs
Costs of
conform-
ance
Prevention
costs
Appraisal
costs
Costs of
nonconf-
ormance
Internal
failure costs
External
failure costs
QUALITY
GOOD QUALITY
Support provision of high
quality health-care
Generate confidence in
lab results
Ensure credibility of lab
POOR QUALITY
 Inappropriate action
(Over-investigation,
Over-treatment,
Mistreatment)
 Loss of credibility of
laboratory
 Delayed action
 Legal action
VARIABLES THAT AFFECT THE
INTERNAL QUALITY
•
Outside laboratory
Within laboratory
Sample
handling
Patient
preparation
Requisition
Sample
receivingSample
Collection
Sample
Transport
Patient
Doctor
Analysis
Reports
Results
PRE-ANALYTICAL
• Patient and specimen identification
and labelling
• Patient preparation
• Specimen collection, storage and
transportation
• Specimen quantity
• Mismatch of sample
ANALYTICAL
• Internal quality control (IQC)
It’s used on daily basis in the decision
to accept or reject results of patients
samples & enables the lab to describe
and monitor the quality of its work.
• External quality assessment (EQA)
It permits a comparison of quality
between laboratories and It is used to
confirm results of IQC.
ANALYTICAL
PROFICIENCY OF
PERSONNEL
Education,
Training,
Competence,
Commitment,
Adequate
Number
DOCUMENTATION
Written Policies,
Plans,
Procedures,
Instructions &
Quality Control
Procedures
SPECIFICITY &
SENSITIVITY OF
TEST
Cost Effective,
Validated,
Interpretable,
Meets The Needs
EQUIPMENT
RELIABILITY
Meet Technical
Needs,
Maintenance
Friendly &
Validated
Procedural
reliability
Using Standard
Operating
Procedures
REAGENTS
STABILITY AND
EFFICIENCY
Stable, Efficient,
Desired Quality &
Validated
USE OF
CONTROLS
Internal:
Calibrated
External:
Supplied By
Manufacturer
STANDARD OPERATING
PROCEDURE (SOP)
• It’s written instructions
intended to document how
to perform a routine activity.
• High reliability organization
(HROs) rely on standard
operating procedure to
ensure consistency and
quality in their results.
POST ANALYTICAL
• Right reporting
• Right patient
• Right interpretation
• Right turn-around time (TAT)
ACCURACY VS. PRECISION
• Accuracy - how close a measurement is to the
accepted value
(ACCURATE = CORRECT)
• Precision - how close a series of measurements
are to each other
(PRECISE = CONSISTENT)
• Quality Control is used to monitor both the precision
and the accuracy of the assay in order to provide
reliable results.
ICQ PROCEDURES
• A stable control material which mimics
patient’s sample is analyzed (day to
day)•
• Individual measurements are plotted
on a control chart (Levey Jennings
charts)•
• Evaluation whether measurement is “in
control” (Westgard multi-rules)
LEVEY JENNINGS CONTROL
CHART (PLOTTING QC RESULT )
• Mean and SD of QC
material
(manufacturer)
• Y-axis: control
value
X-axis: time of run
• Most auto-analyzers
plot the charts,
otherwise they should
be drawn manually. 80
85
90
95
100
105
110
115
1 2 3 4 5 6 7 8 9 10 11 12 13 14 15 16 17 18 19 20 21 22 23 24
Mean
+1SD
+2SD
+3SD
-1SD
-2SD
-3SD
Day
LEVEY JENNINGS CONTROL
CHART (PLOTTING QC RESULT )
• Ideally should have control values clustered about the mean
with little variation in the upward or downward direction
• Imprecision = large amount of scatter about the mean. Usually
caused by errors in technique
• Inaccuracy = may see as a trend or a shift, usually caused by
change in the testing process
• Random error = no pattern. Usually poor technique,
malfunctioning equipment.
• Review charts at defined intervals, take necessary action, and
document
WESTGARD RULES (EVALUATING
QC RESULTS )
• It Detects whether results are “in
control” or not.
• It Detects the type of laboratory
error.
• It’s used to diminish the false
rejection rate without
compromising quality.
RANDOM ERROR, RE, OR
IMPRECISION
• It is described as an error that can be
either positive or negative, whose
direction and exact magnitude cannot
be predicted, where the distribution of
results when replicate measurements
are made on a single specimen.
• Usually, due to error in pippetting
SYSTEMATIC ERROR, SE, OR
INACCURACY
• It is an error that is always in one
direction, displacing the mean of the
distribution from its original value.
• In contrast to random errors,
systematic errors are in one direction
and cause all the test results to be
either high or low.
• Usually, due to error in calibration.
Quality Control in Laboratory

Quality Control in Laboratory

  • 1.
  • 2.
    QUALITY • Doing theright thing right, the first time and every time. • Is fitness for use “Juran”: a service which is free from deficiencies and meets customers need • It’s invisible when GOOD & impossible to ignore when BAD • Dimensions: Appro- priate- ness Time- liness Avail- ability Comp- etency Contin- uity Effec- tive- ness Effic- acy Effic- iency Preven- tion/ Early Detec- tion Respe- ct and caring Safety
  • 3.
    QUALITY • Total QualityManagement (TQM): a process of customer- driven quality improvement by having the lab monitor, its work to detect deficiencies & subsequently correct them to provide value. • Continuous Quality Improvement (CQI): It’s a management process or approach to continuous improvement of processes of providing healthcare services to meet the needs of patients.
  • 4.
    QUALITY • Quality Assurance(QA): It’s the overall program that ensures that the final results reported by the laboratory are correct. It is concerned with much more: that the right test is carried out on the right specimen, and that the right result and right interpretation is delivered to the right person at the right time. • Quality Assessment (proficiency testing): It is a challenge to the QA and QC programs. It may be external or internal. It’s used to determine the quality of the results generated by the laboratory.
  • 5.
    Data and Lab Management Safety Customer Service Patient/Client Prep SampleCollection Sample Receipt & Accessioning Sample Transport Quality Control Record Keeping Reporting Personnel Competency Test Evaluations Testing
  • 6.
    Improvement in qualityleads to reduction in costs Quality Costs Costs of conform- ance Prevention costs Appraisal costs Costs of nonconf- ormance Internal failure costs External failure costs
  • 7.
    QUALITY GOOD QUALITY Support provisionof high quality health-care Generate confidence in lab results Ensure credibility of lab POOR QUALITY  Inappropriate action (Over-investigation, Over-treatment, Mistreatment)  Loss of credibility of laboratory  Delayed action  Legal action
  • 8.
    VARIABLES THAT AFFECTTHE INTERNAL QUALITY • Outside laboratory Within laboratory Sample handling Patient preparation Requisition Sample receivingSample Collection Sample Transport Patient Doctor Analysis Reports Results
  • 9.
    PRE-ANALYTICAL • Patient andspecimen identification and labelling • Patient preparation • Specimen collection, storage and transportation • Specimen quantity • Mismatch of sample
  • 10.
    ANALYTICAL • Internal qualitycontrol (IQC) It’s used on daily basis in the decision to accept or reject results of patients samples & enables the lab to describe and monitor the quality of its work. • External quality assessment (EQA) It permits a comparison of quality between laboratories and It is used to confirm results of IQC.
  • 11.
    ANALYTICAL PROFICIENCY OF PERSONNEL Education, Training, Competence, Commitment, Adequate Number DOCUMENTATION Written Policies, Plans, Procedures, Instructions& Quality Control Procedures SPECIFICITY & SENSITIVITY OF TEST Cost Effective, Validated, Interpretable, Meets The Needs EQUIPMENT RELIABILITY Meet Technical Needs, Maintenance Friendly & Validated Procedural reliability Using Standard Operating Procedures REAGENTS STABILITY AND EFFICIENCY Stable, Efficient, Desired Quality & Validated USE OF CONTROLS Internal: Calibrated External: Supplied By Manufacturer
  • 12.
    STANDARD OPERATING PROCEDURE (SOP) •It’s written instructions intended to document how to perform a routine activity. • High reliability organization (HROs) rely on standard operating procedure to ensure consistency and quality in their results.
  • 13.
    POST ANALYTICAL • Rightreporting • Right patient • Right interpretation • Right turn-around time (TAT)
  • 14.
    ACCURACY VS. PRECISION •Accuracy - how close a measurement is to the accepted value (ACCURATE = CORRECT) • Precision - how close a series of measurements are to each other (PRECISE = CONSISTENT) • Quality Control is used to monitor both the precision and the accuracy of the assay in order to provide reliable results.
  • 15.
    ICQ PROCEDURES • Astable control material which mimics patient’s sample is analyzed (day to day)• • Individual measurements are plotted on a control chart (Levey Jennings charts)• • Evaluation whether measurement is “in control” (Westgard multi-rules)
  • 16.
    LEVEY JENNINGS CONTROL CHART(PLOTTING QC RESULT ) • Mean and SD of QC material (manufacturer) • Y-axis: control value X-axis: time of run • Most auto-analyzers plot the charts, otherwise they should be drawn manually. 80 85 90 95 100 105 110 115 1 2 3 4 5 6 7 8 9 10 11 12 13 14 15 16 17 18 19 20 21 22 23 24 Mean +1SD +2SD +3SD -1SD -2SD -3SD Day
  • 17.
    LEVEY JENNINGS CONTROL CHART(PLOTTING QC RESULT ) • Ideally should have control values clustered about the mean with little variation in the upward or downward direction • Imprecision = large amount of scatter about the mean. Usually caused by errors in technique • Inaccuracy = may see as a trend or a shift, usually caused by change in the testing process • Random error = no pattern. Usually poor technique, malfunctioning equipment. • Review charts at defined intervals, take necessary action, and document
  • 18.
    WESTGARD RULES (EVALUATING QCRESULTS ) • It Detects whether results are “in control” or not. • It Detects the type of laboratory error. • It’s used to diminish the false rejection rate without compromising quality.
  • 19.
    RANDOM ERROR, RE,OR IMPRECISION • It is described as an error that can be either positive or negative, whose direction and exact magnitude cannot be predicted, where the distribution of results when replicate measurements are made on a single specimen. • Usually, due to error in pippetting
  • 20.
    SYSTEMATIC ERROR, SE,OR INACCURACY • It is an error that is always in one direction, displacing the mean of the distribution from its original value. • In contrast to random errors, systematic errors are in one direction and cause all the test results to be either high or low. • Usually, due to error in calibration.