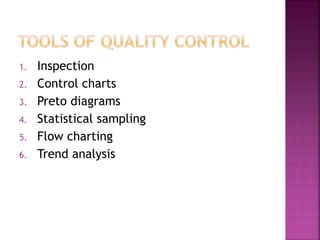
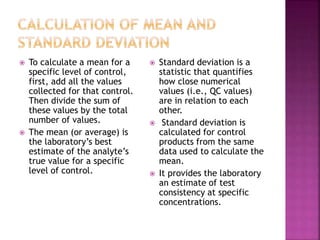
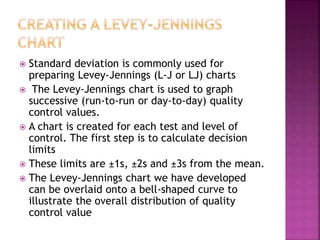
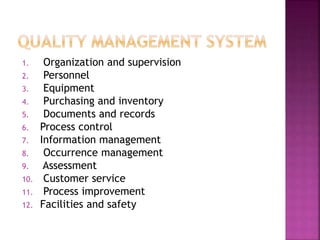
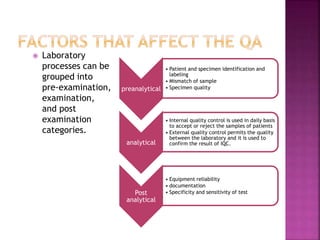
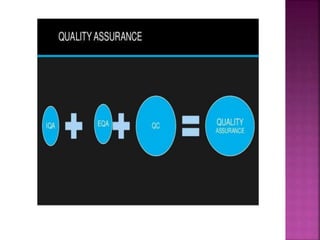
Quality control and quality assurance are important for ensuring accurate lab results. Quality control involves regularly testing controls of known values to monitor a test's performance. Key quality control statistics include the mean and standard deviation, which are used to calculate control limits on a Levey-Jennings chart. Westgard rules provide standards for determining when a test is out of control based on control values. Quality assurance encompasses the overall programs and procedures that a lab follows to ensure accurate and reliable results. It has strategic, tactical, and operational levels.


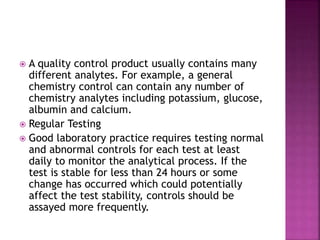
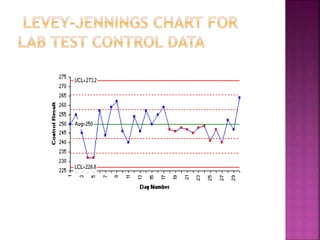
![ QC statistics for each test performed in the laboratory are
calculated from the QC database collected by regular
testing of control products. The data collected is specific
for each level of control.
The most fundamental statistics used by the laboratory
are the mean [x] and standard deviation [s].](https://image.slidesharecdn.com/qcandqa-190819050946/85/Qc-and-qa-9-320.jpg)


![제 23회 보아즈(BOAZ) 빅데이터 컨퍼런스 - [MBOAX] : ABSA를 활용한 소비자 반응 분석 기반 운영 효율화 대시보드 설계](https://cdn.slidesharecdn.com/ss_thumbnails/3-1boaz23rdconferencemboax-260203102709-9d519923-thumbnail.jpg?width=640&height=640&fit=bounds)

![7.__Developing_a_Research_Proposal[1].pptx](https://cdn.slidesharecdn.com/ss_thumbnails/7-260131073037-df92dd7d-thumbnail.jpg?width=640&height=640&fit=bounds)


