
Recommended
More Related Content
What's hot
Viewers also liked
Similar to Cob 20091113 1
More from macavity_d_katt
Recently uploaded
Recently uploaded (20)
Cob 20091113 1
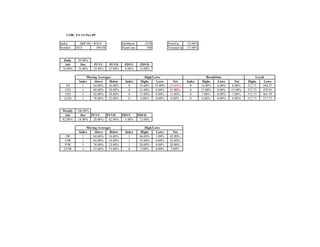
- 1. COB: Fri 13-Nov-09 Index S&P100 - $OEX IdxMatch 2238 PriceUp 53.00% Symbol OEX 508.08 NumCons 100 VolumeUp -33.00% Daily 99.00% Adv Dec PUVU PUVD PDVU PDVD 76.00% 23.00% 24.00% 52.00% 9.00% 14.00% Moving Averages High/Lows BreakOuts Levels Index Above Below Index Highs Lows Net Index Highs Lows Net Highs Lows 3D 1 64.00% 36.00% 0 23.00% 33.00% (10.00%) 0 14.00% 6.00% 8.00% 512.71 504.27 13D 1 80.00% 20.00% 0 21.00% 0.00% 21.00% 0 13.00% 0.00% 13.00% 512.71 479.01 55D 1 82.00% 18.00% 0 11.00% 0.00% 11.00% 0 7.00% 0.00% 7.00% 512.71 461.95 233D 1 78.00% 22.00% 0 8.00% 0.00% 8.00% 0 6.00% 0.00% 6.00% 512.71 317.37 Weekly 100.00% Adv Dec PUVU PUVD PDVU PDVD 82.00% 18.00% 20.00% 62.00% 3.00% 15.00% Moving Averages High/Lows Index Above Below Index Highs Lows Net 3W 1 84.00% 16.00% 1 46.00% 1.00% 45.00% 13W 1 84.00% 16.00% 1 33.00% 0.00% 33.00% 55W 1 76.00% 24.00% 1 20.00% 0.00% 20.00% 233W -1 47.00% 53.00% 0 2.00% 0.00% 2.00%
- 2. COB: Fri 13-Nov-09 Index Nasdaq100 - $NDX IdxMatch 2126 PriceUp 58.00% Symbol NDX--X 1788.61 NumCons 100 VolumeUp -36.00% Daily 100.00% Adv Dec PUVU PUVD PDVU PDVD 79.00% 21.00% 21.00% 58.00% 11.00% 10.00% Moving Averages High/Lows BreakOuts Levels Index Above Below Index Highs Lows Net Index Highs Lows Net Highs Lows 3D 1 68.00% 32.00% 0 22.00% 23.00% (1.00%) 0 18.00% 6.00% 12.00% 1794.12 1769.64 13D 1 80.00% 20.00% 0 18.00% 1.00% 17.00% 0 14.00% 2.00% 12.00% 1794.12 1652.44 55D 1 71.00% 29.00% 0 8.00% 1.00% 7.00% 0 7.00% 1.00% 6.00% 1794.12 1585.56 233D 1 84.00% 16.00% 0 8.00% 0.00% 8.00% 0 7.00% 0.00% 7.00% 1794.12 1040.41 Weekly 100.00% Adv Dec PUVU PUVD PDVU PDVD 86.00% 14.00% 19.00% 67.00% 6.00% 8.00% Moving Averages High/Lows Index Above Below Index Highs Lows Net 3W 1 80.00% 20.00% 1 35.00% 8.00% 27.00% 13W 1 78.00% 22.00% 1 24.00% 1.00% 23.00% 55W 1 79.00% 21.00% 1 21.00% 0.00% 21.00% 233W 1 53.00% 47.00% 0 5.00% 0.00% 5.00%
- 3. COB: Fri 13-Nov-09 Index S&P500 - $SPX IdxMatch 2756 PriceUp 58.40% Symbol SP-500 1093.48 NumCons 500 VolumeUp -21.20% Daily 98.80% Adv Dec PUVU PUVD PDVU PDVD 78.60% 20.20% 27.60% 51.00% 11.20% 9.00% Moving Averages High/Lows BreakOuts Levels Index Above Below Index Highs Lows Net Index Highs Lows Net Highs Lows 3D 1 61.80% 38.20% 0 16.40% 36.60% (20.20%) 0 9.40% 6.80% 2.60% 1105.37 1084.90 13D 1 73.40% 26.60% 0 15.00% 2.00% 13.00% 0 8.60% 1.20% 7.40% 1105.37 1029.38 55D 1 75.80% 24.20% 0 6.80% 1.00% 5.80% 0 4.20% 0.80% 3.40% 1105.37 991.97 233D 1 80.80% 19.20% 0 5.60% 0.00% 5.60% 0 3.60% 0.00% 3.60% 1105.37 666.79 Weekly 100.00% Adv Dec PUVU PUVD PDVU PDVD 80.60% 19.40% 14.40% 66.20% 6.40% 13.00% Moving Averages High/Lows Index Above Below Index Highs Lows Net 3W 1 78.00% 22.00% 1 37.80% 4.80% 33.00% 13W 1 80.20% 19.80% 1 27.20% 2.00% 25.20% 55W 1 77.80% 22.20% 1 19.60% 0.00% 19.60% 233W -1 44.80% 55.20% 0 2.20% 0.00% 2.20%
- 4. COB: Fri 13-Nov-09 Index Russell1000 - $RUI IdxMatch 2600 PriceUp 58.38% Symbol RUI-X 598.31 NumCons 961 VolumeUp -18.21% Daily 98.65% Adv Dec PUVU PUVD PDVU PDVD 78.56% 20.08% 29.66% 48.80% 10.51% 9.57% Moving Averages High/Lows BreakOuts Levels Index Above Below Index Highs Lows Net Index Highs Lows Net Highs Lows 3D 1 60.77% 39.23% 0 15.30% 37.57% (22.27%) 0 8.64% 6.66% 1.98% 605.03 593.47 13D 1 69.61% 30.39% 0 12.59% 2.60% 9.99% 0 7.08% 1.04% 6.04% 605.03 562.49 55D 1 71.49% 28.51% 0 5.52% 1.14% 4.37% 0 3.43% 0.62% 2.81% 605.03 542.52 233D 1 78.36% 21.64% 0 4.68% 0.10% 4.58% 0 3.12% 0.10% 3.02% 605.03 362.27 Weekly 99.79% Adv Dec PUVU PUVD PDVU PDVD 78.98% 20.81% 14.98% 64.00% 6.45% 14.36% Moving Averages High/Lows Index Above Below Index Highs Lows Net 3W 1 75.75% 24.25% 1 35.38% 5.52% 29.86% 13W 1 75.75% 24.25% 1 23.73% 2.29% 21.44% 55W 1 75.55% 24.45% 1 17.90% 0.31% 17.59% 233W -1 45.79% 54.21% 0 2.08% 0.21% 1.87%
- 5. COB: Fri 13-Nov-09 Index Russell2000 - $RUT IdxMatch 2602 PriceUp 48.27% Symbol RUT-X 586.28 NumCons 1991 VolumeUp -28.88% Daily 96.84% Adv Dec PUVU PUVD PDVU PDVD 72.48% 24.36% 23.46% 49.02% 10.45% 13.76% Moving Averages High/Lows BreakOuts Levels Index Above Below Index Highs Lows Net Index Highs Lows Net Highs Lows 3D 1 49.97% 50.03% -1 10.55% 48.57% (38.02%) 0 5.78% 11.80% (6.03%) 596.93 576.73 13D 1 42.84% 57.16% 0 4.82% 13.61% (8.79%) 0 2.81% 4.07% (1.26%) 596.93 553.31 55D 1 40.63% 59.37% 0 1.66% 8.79% (7.13%) 0 0.90% 2.56% (1.66%) 625.31 552.27 233D 1 53.49% 46.51% 0 1.31% 1.05% 0.25% 0 0.75% 0.20% 0.55% 625.31 342.59 Weekly 98.44% Adv Dec PUVU PUVD PDVU PDVD 47.76% 50.68% 14.62% 33.15% 14.47% 36.21% Moving Averages High/Lows Index Above Below Index Highs Lows Net 3W 1 43.85% 56.15% 0 18.13% 22.35% (4.22%) 13W 1 43.09% 56.91% 0 10.40% 13.76% (3.37%) 55W 1 51.78% 48.22% 0 6.53% 1.91% 4.62% 233W -1 29.03% 70.97% 0 1.05% 1.66% (0.60%)
- 6. COB: Fri 13-Nov-09 Index Russell3000 - $RUA IdxMatch 2599 PriceUp 51.51% Symbol RUA-X 636.47 NumCons 2953 VolumeUp -25.30% Daily 97.43% Adv Dec PUVU PUVD PDVU PDVD 74.43% 22.99% 25.47% 48.93% 10.53% 12.36% Moving Averages High/Lows BreakOuts Levels Index Above Below Index Highs Lows Net Index Highs Lows Net Highs Lows 3D 1 53.47% 46.53% -1 12.09% 45.01% (32.92%) 0 6.71% 10.16% (3.45%) 643.95 631.03 13D 1 51.57% 48.43% 0 7.35% 10.02% (2.68%) 0 4.20% 3.08% 1.12% 643.95 598.54 55D 1 50.66% 49.34% 0 2.91% 6.30% (3.39%) 0 1.73% 1.93% (0.20%) 645.10 579.00 233D 1 61.60% 38.40% 0 2.40% 0.75% 1.66% 0 1.52% 0.17% 1.35% 645.10 384.41 Weekly 98.88% Adv Dec PUVU PUVD PDVU PDVD 57.97% 40.91% 14.73% 43.24% 11.82% 29.09% Moving Averages High/Lows Index Above Below Index Highs Lows Net 3W 1 54.25% 45.75% 0 23.74% 16.83% 6.91% 13W 1 53.71% 46.29% 0 14.73% 10.02% 4.71% 55W 1 59.53% 40.47% 0 10.23% 1.39% 8.84% 233W -1 34.51% 65.49% 0 1.39% 1.19% 0.20%
- 7. COB: Fri 13-Nov-09 Index S&P400 - $MID IdxMatch 2007 PriceUp 62.00% Symbol MID--X 698.26 NumCons 400 VolumeUp -16.00% Daily 98.00% Adv Dec PUVU PUVD PDVU PDVD 80.00% 18.00% 32.25% 47.75% 8.75% 9.25% Moving Averages High/Lows BreakOuts Levels Index Above Below Index Highs Lows Net Index Highs Lows Net Highs Lows 3D 1 61.50% 38.50% -1 11.75% 44.50% (32.75%) 0 7.00% 6.50% 0.50% 706.99 689.30 13D 1 64.75% 35.25% 0 8.50% 4.00% 4.50% 0 4.50% 1.25% 3.25% 706.99 651.79 55D 1 63.75% 36.25% 0 4.00% 2.25% 1.75% 0 2.00% 0.75% 1.25% 717.75 633.41 233D 1 73.25% 26.75% 0 3.75% 0.00% 3.75% 0 2.00% 0.00% 2.00% 717.75 397.97 Weekly 99.25% Adv Dec PUVU PUVD PDVU PDVD 75.50% 23.75% 14.25% 61.25% 5.25% 18.50% Moving Averages High/Lows Index Above Below Index Highs Lows Net 3W 1 72.00% 28.00% 0 30.25% 6.50% 23.75% 13W 1 68.00% 32.00% 0 19.25% 3.50% 15.75% 55W 1 70.00% 30.00% 0 13.75% 0.25% 13.50% 233W 1 45.00% 55.00% 0 2.50% 0.25% 2.25%
- 8. COB: Fri 13-Nov-09 Index S&P600 - $SML IdxMatch 2719 PriceUp 53.67% Symbol SML--X 310.46 NumCons 600 VolumeUp -31.33% Daily 98.17% Adv Dec PUVU PUVD PDVU PDVD 75.83% 22.33% 24.83% 51.00% 8.50% 13.67% Moving Averages High/Lows BreakOuts Levels Index Above Below Index Highs Lows Net Index Highs Lows Net Highs Lows 3D 1 50.83% 49.17% -1 9.50% 56.17% (46.67%) 0 5.00% 10.00% (5.00%) 316.78 305.34 13D 1 45.83% 54.17% 0 4.67% 12.83% (8.17%) 0 3.33% 2.17% 1.17% 316.78 294.26 55D 1 46.50% 53.50% 0 0.83% 8.17% (7.33%) 0 0.67% 1.33% (0.67%) 329.73 291.82 233D 1 59.50% 40.50% 0 0.50% 0.50% 0.00% 0 0.33% 0.00% 0.33% 329.73 181.32 Weekly 99.33% Adv Dec PUVU PUVD PDVU PDVD 52.17% 47.17% 13.17% 39.00% 9.33% 37.83% Moving Averages High/Lows Index Above Below Index Highs Lows Net 3W 1 49.00% 51.00% 0 19.50% 17.50% 2.00% 13W 1 50.17% 49.83% 0 11.50% 10.83% 0.67% 55W 1 58.17% 41.83% 0 6.83% 0.50% 6.33% 233W -1 32.83% 67.17% 0 0.83% 0.50% 0.33%