Downloaded 187 times
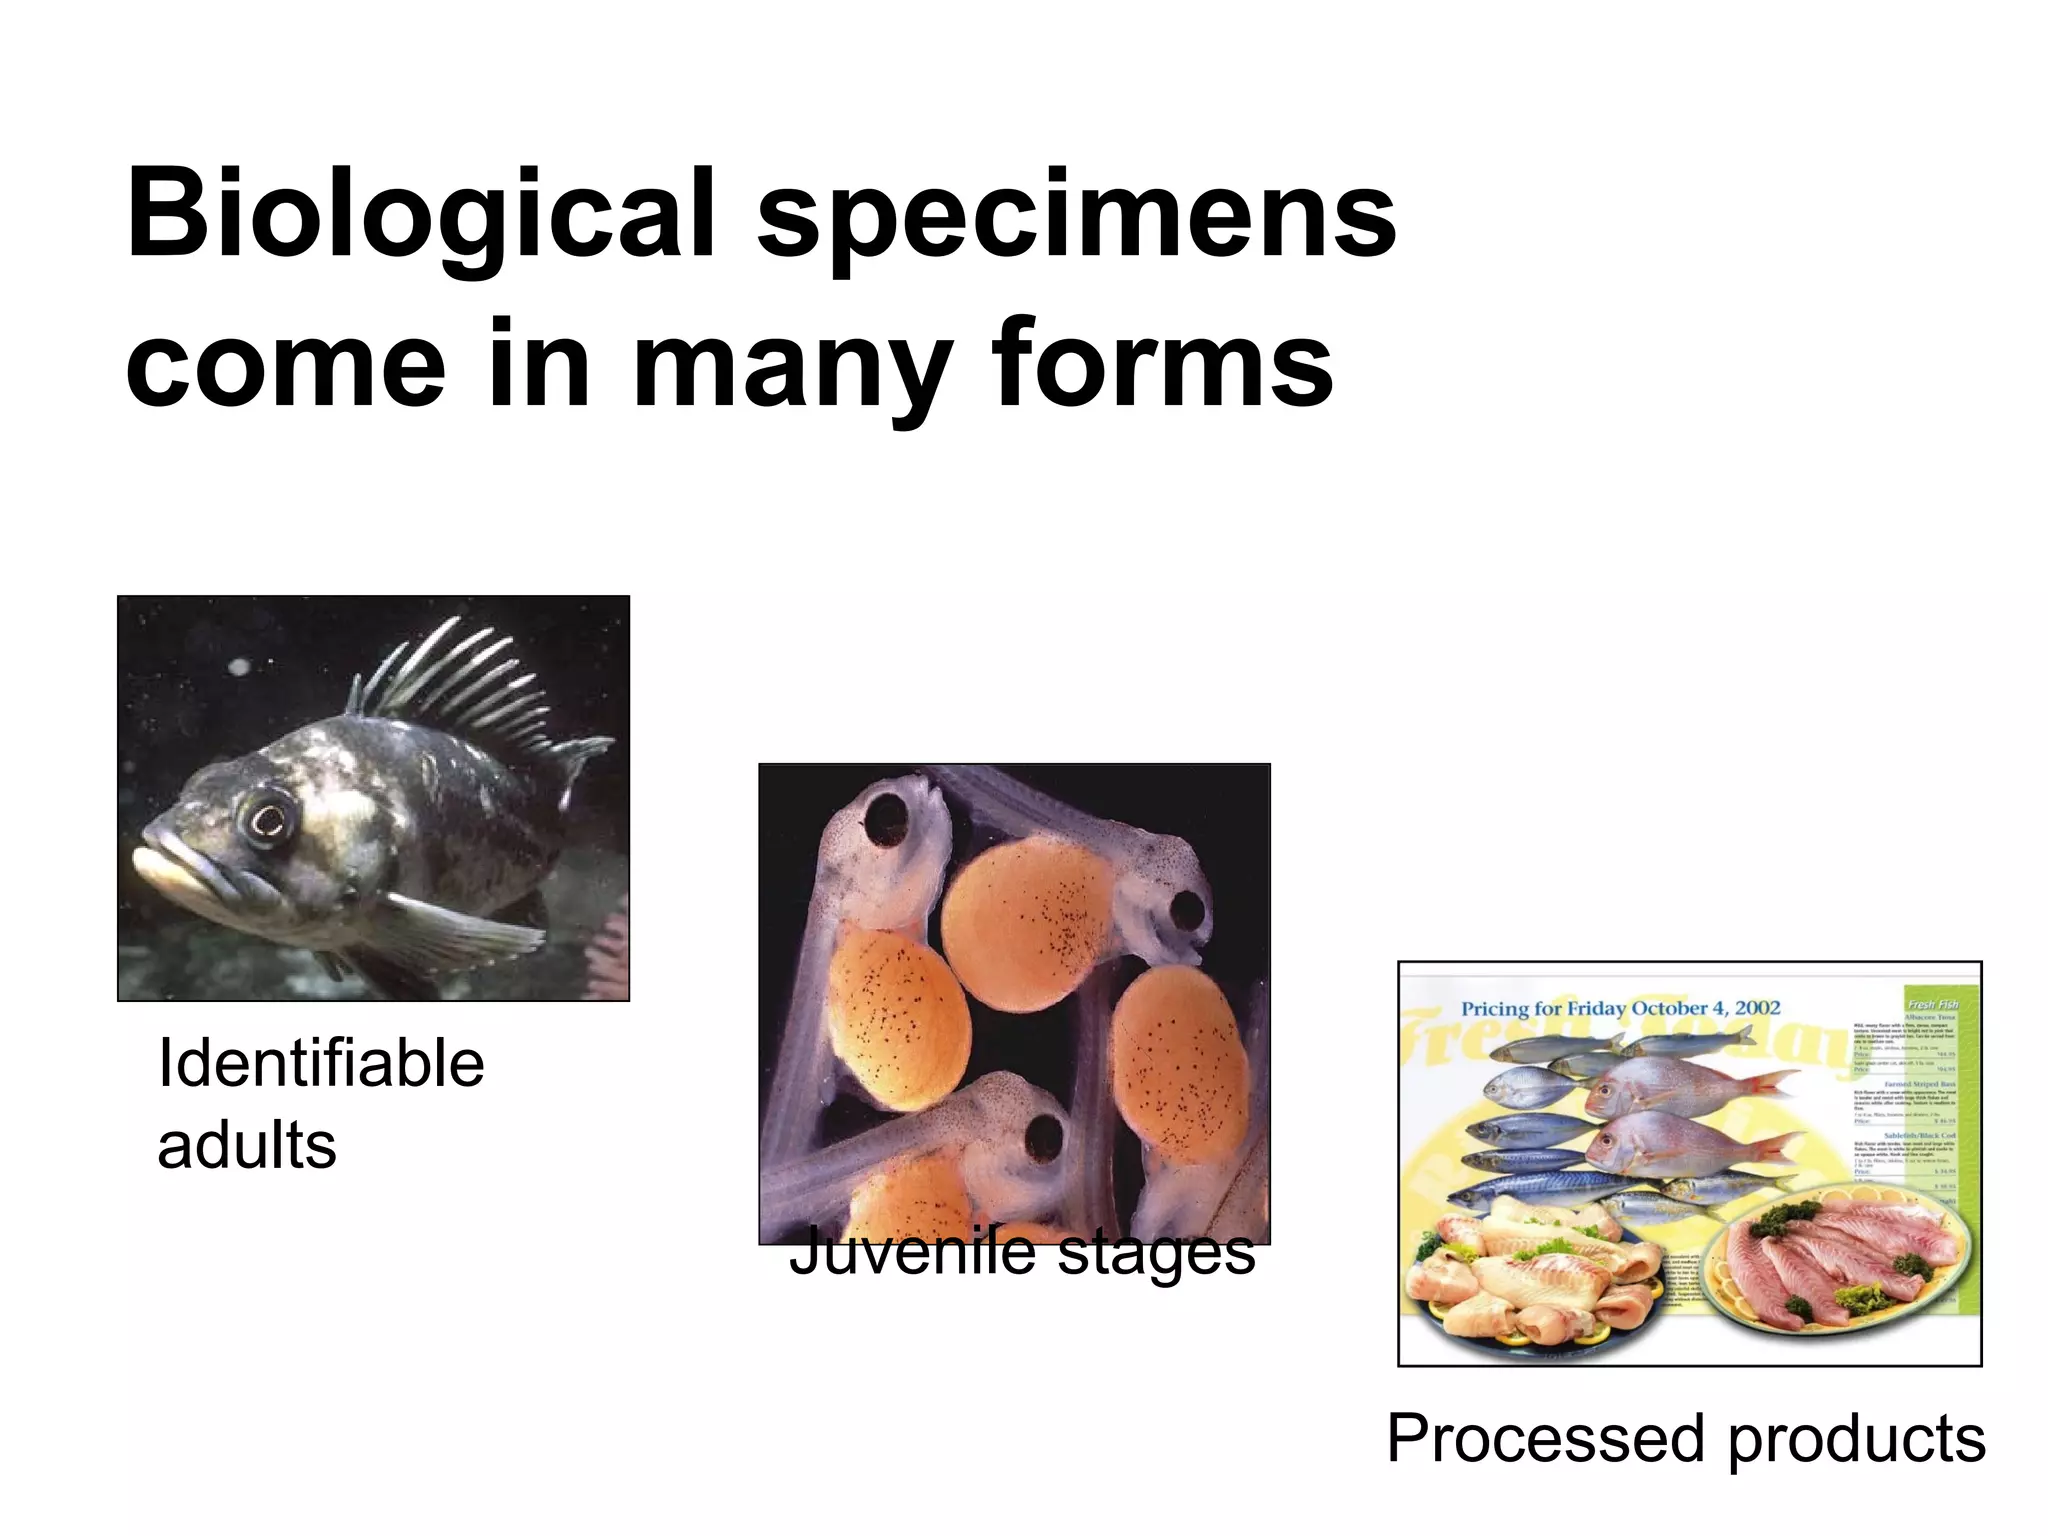
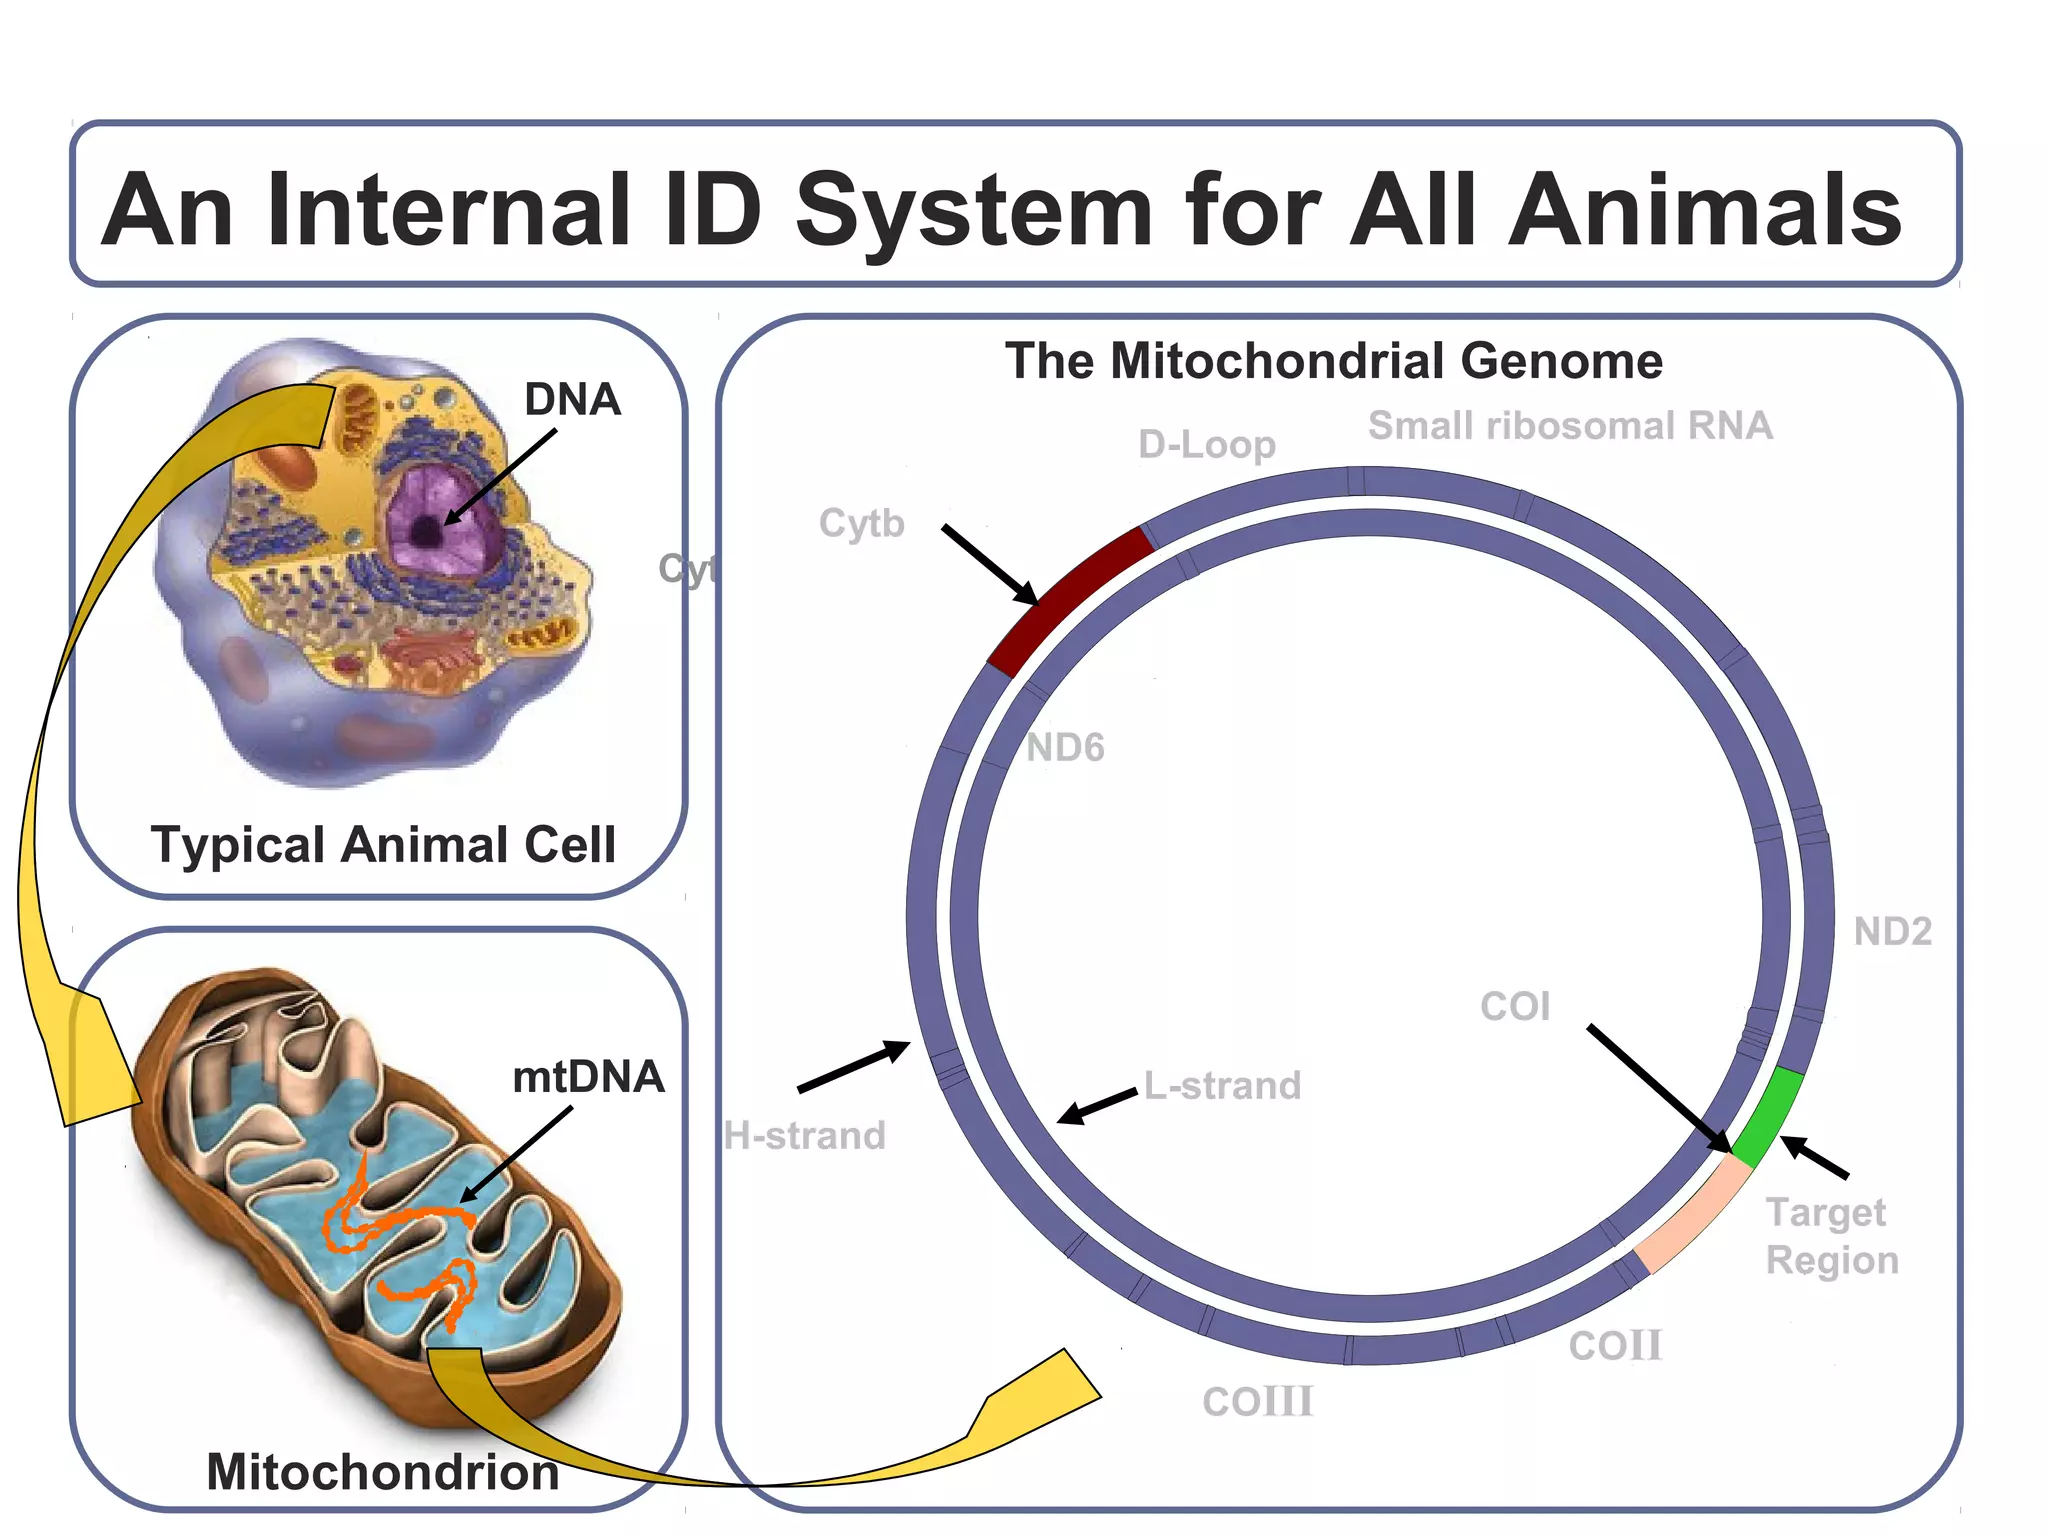
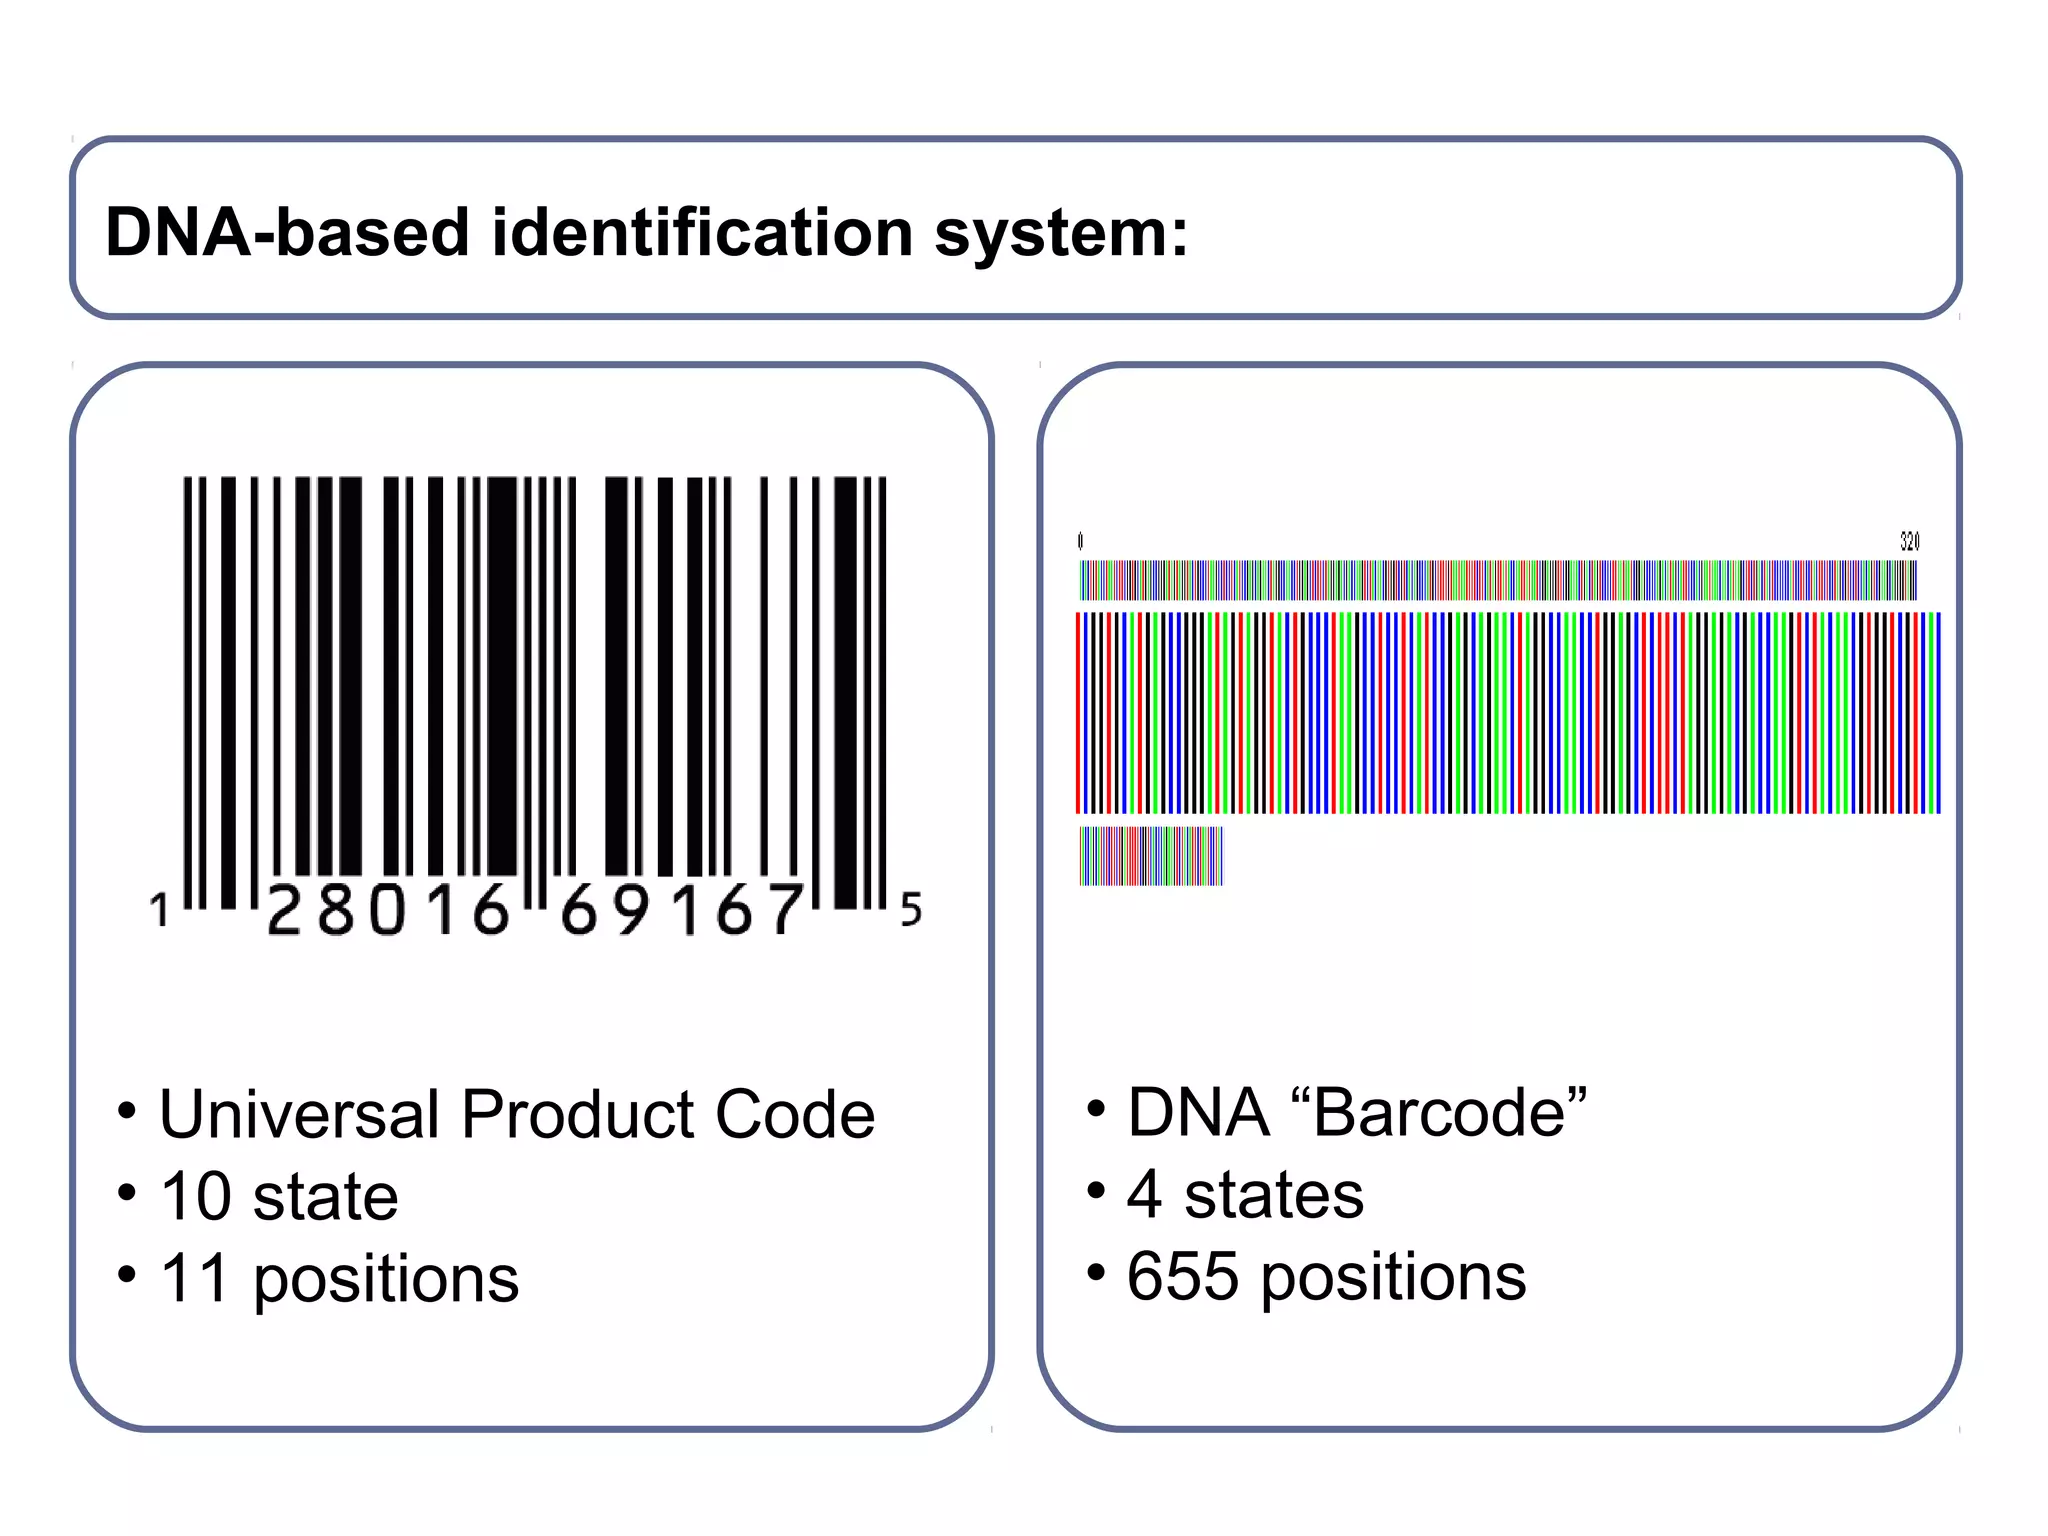
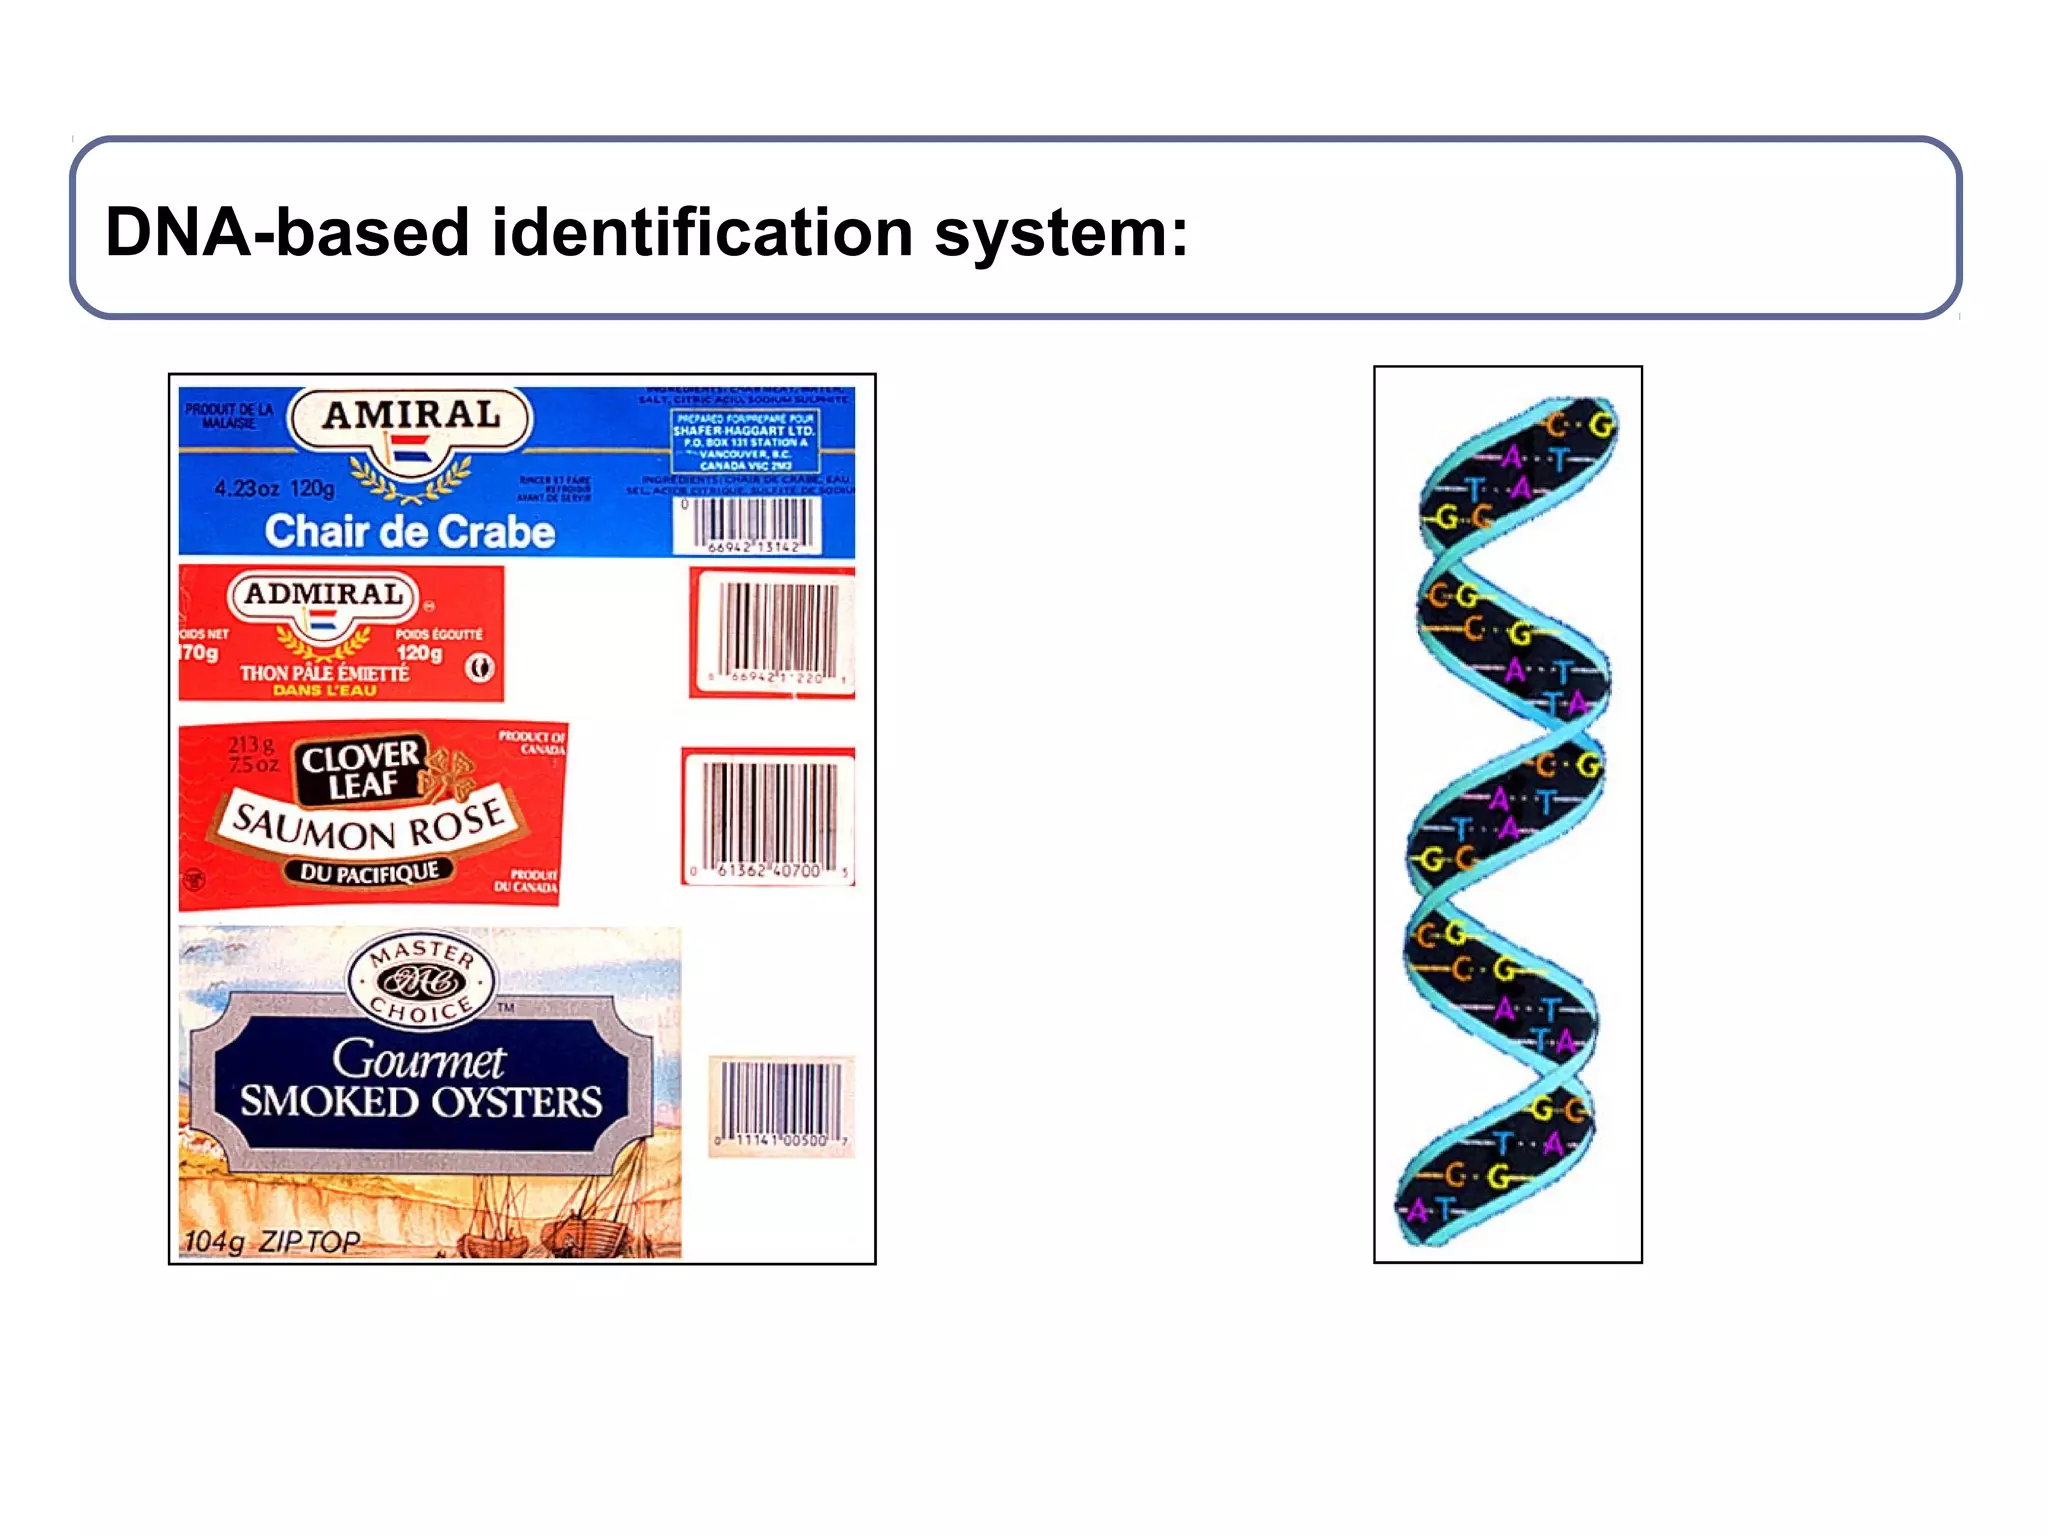
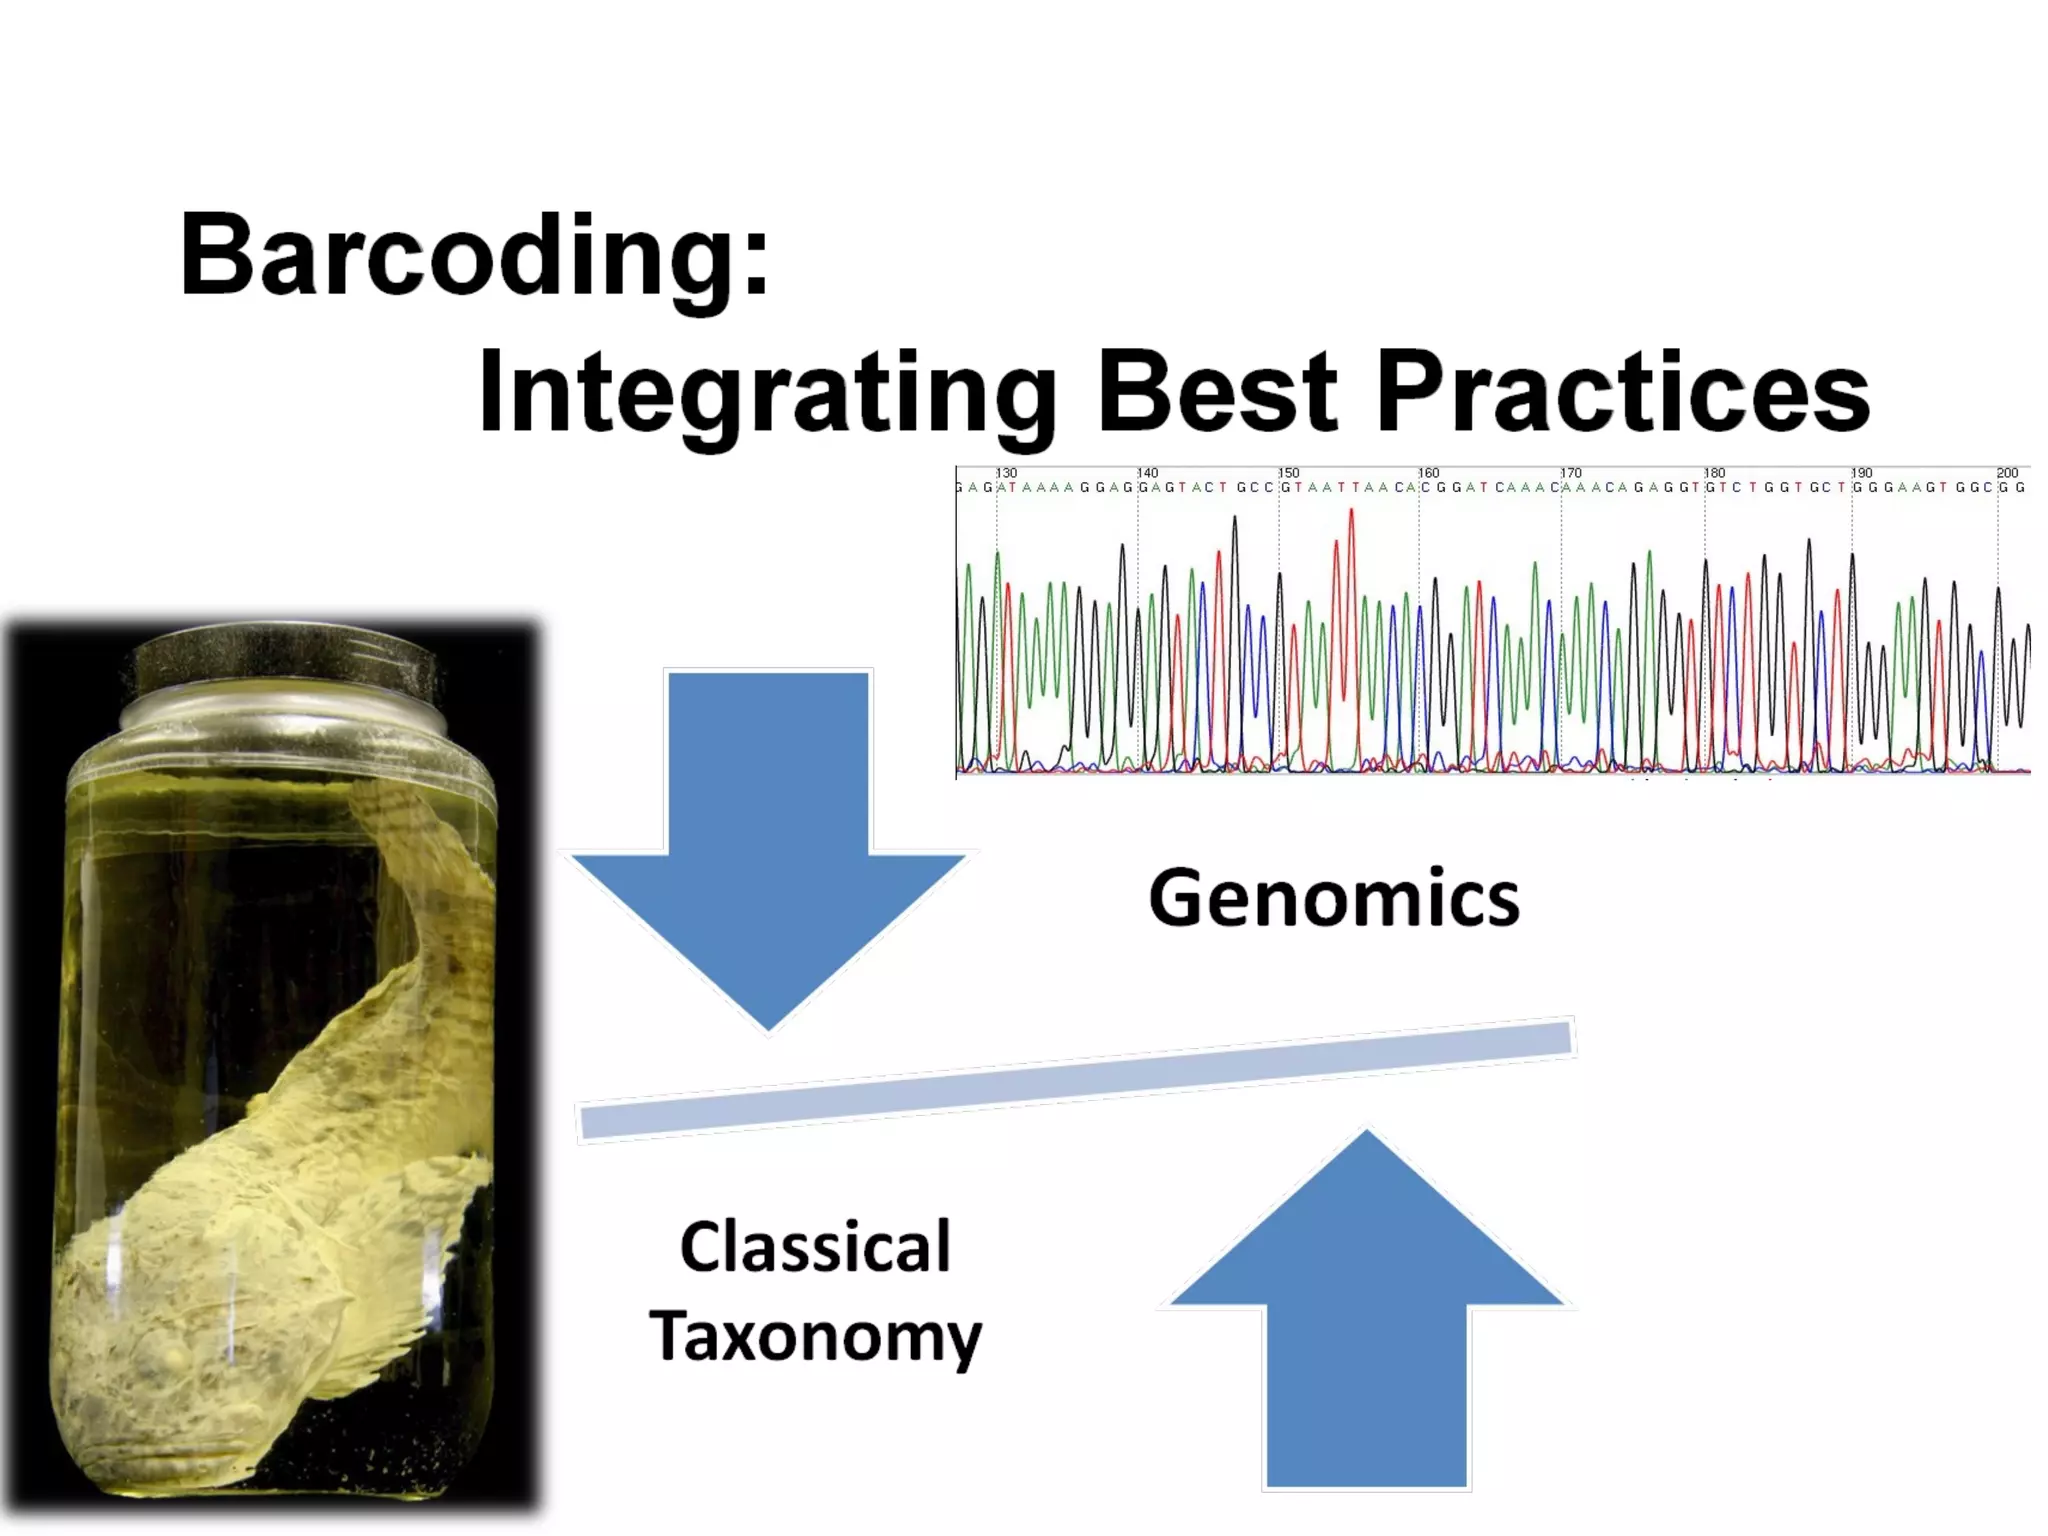
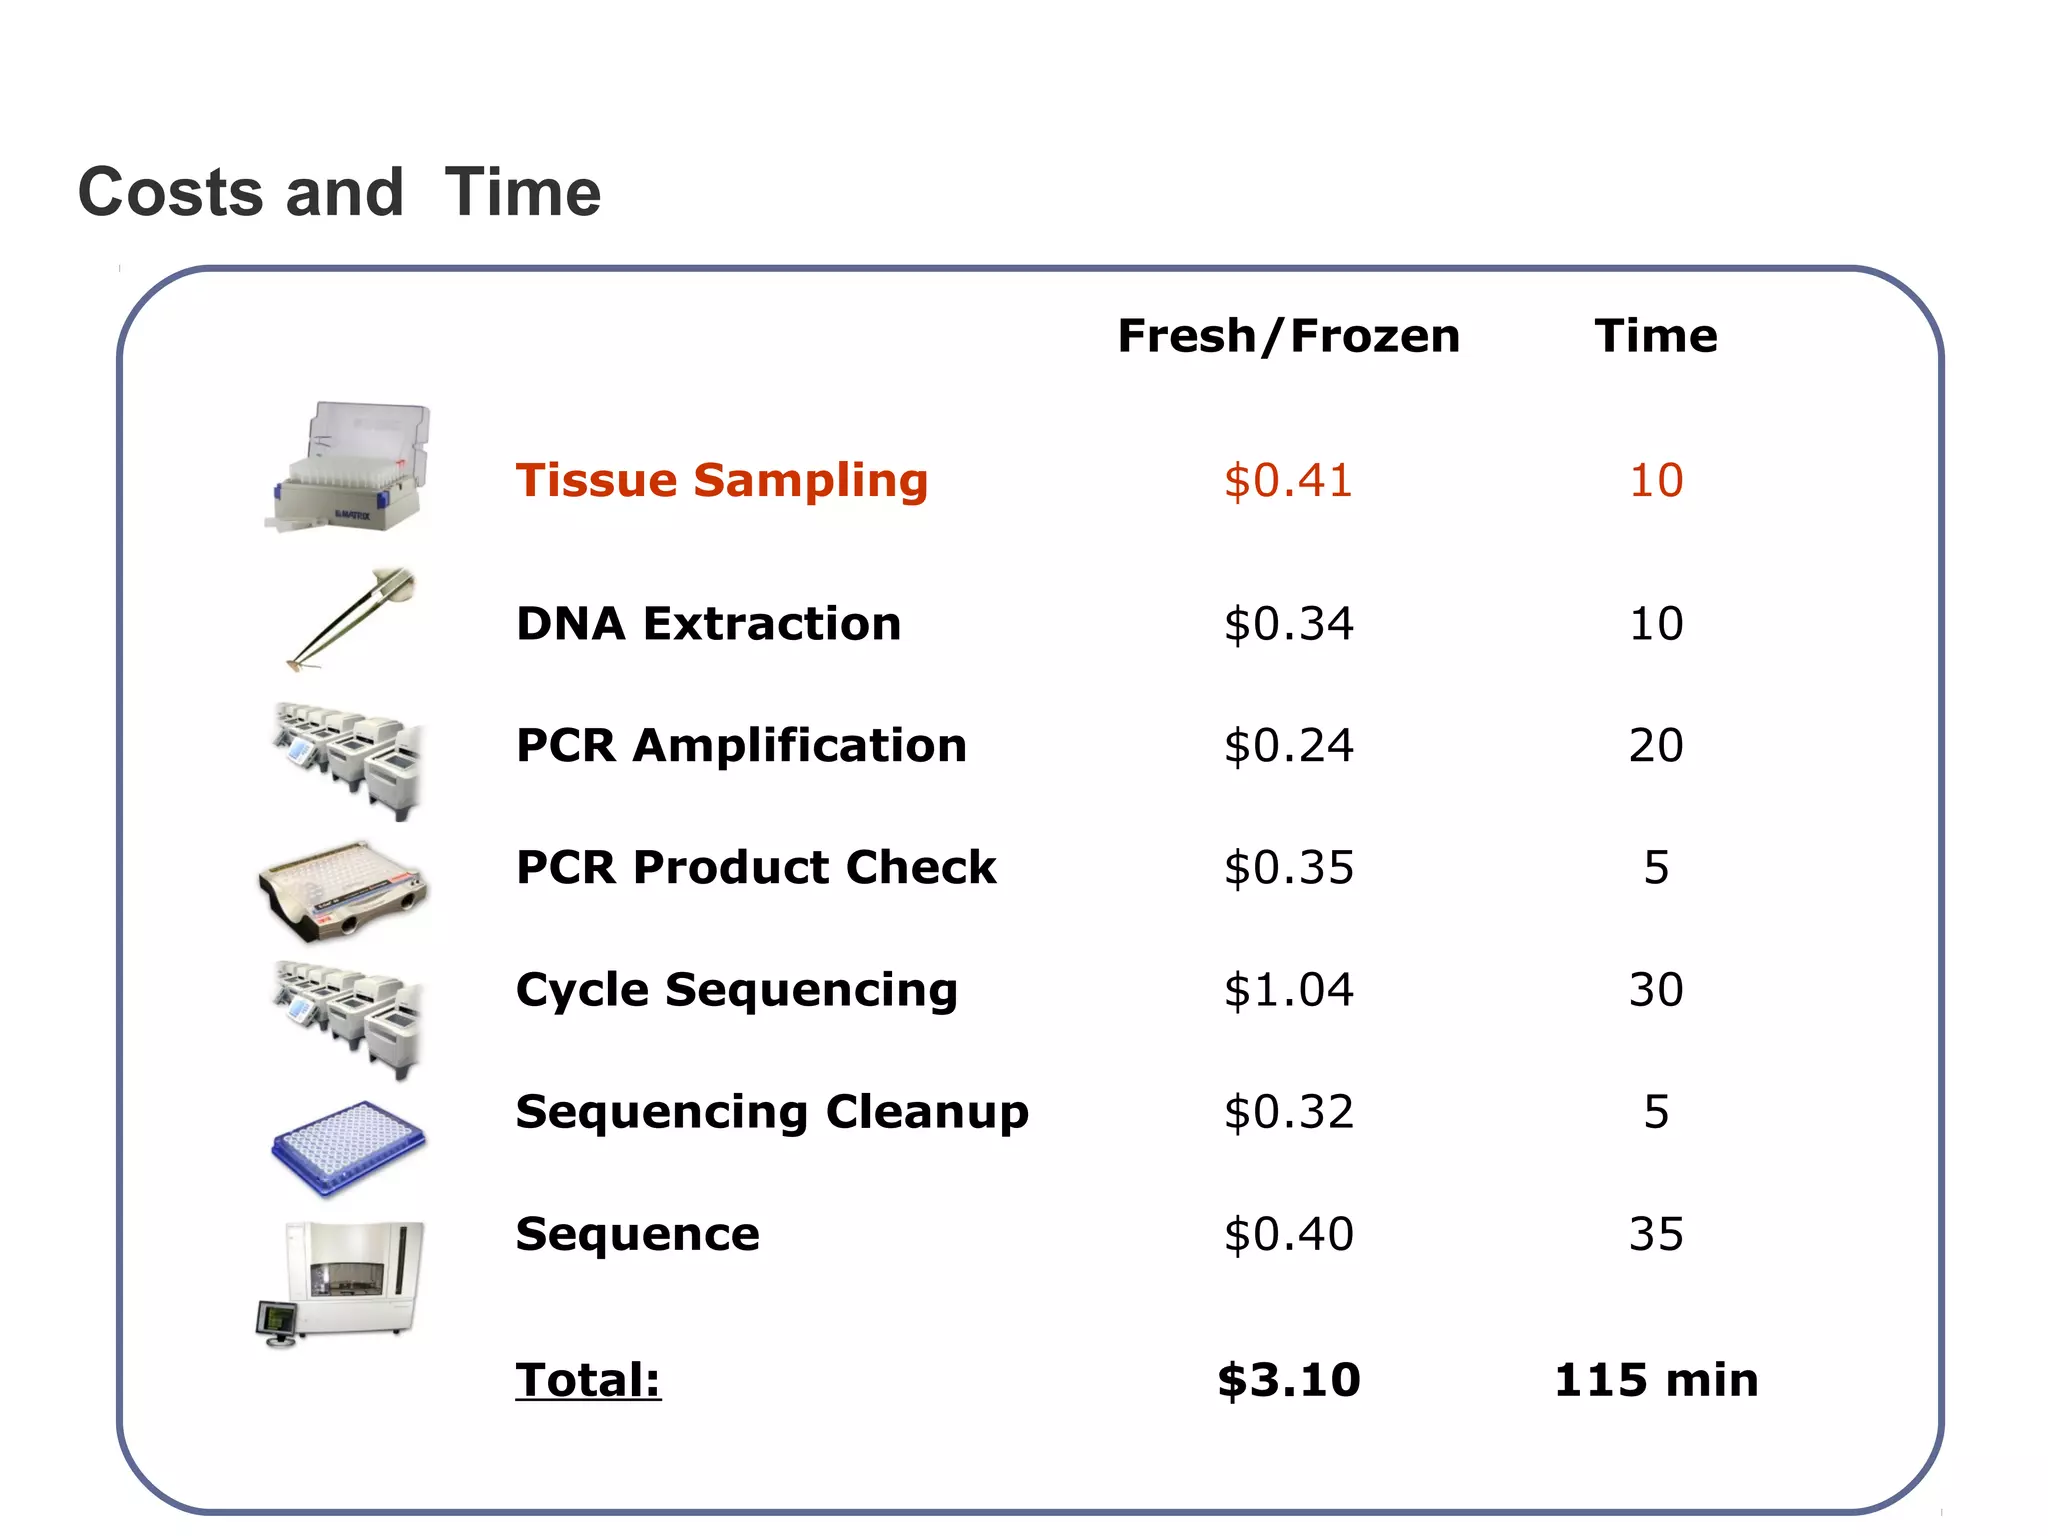
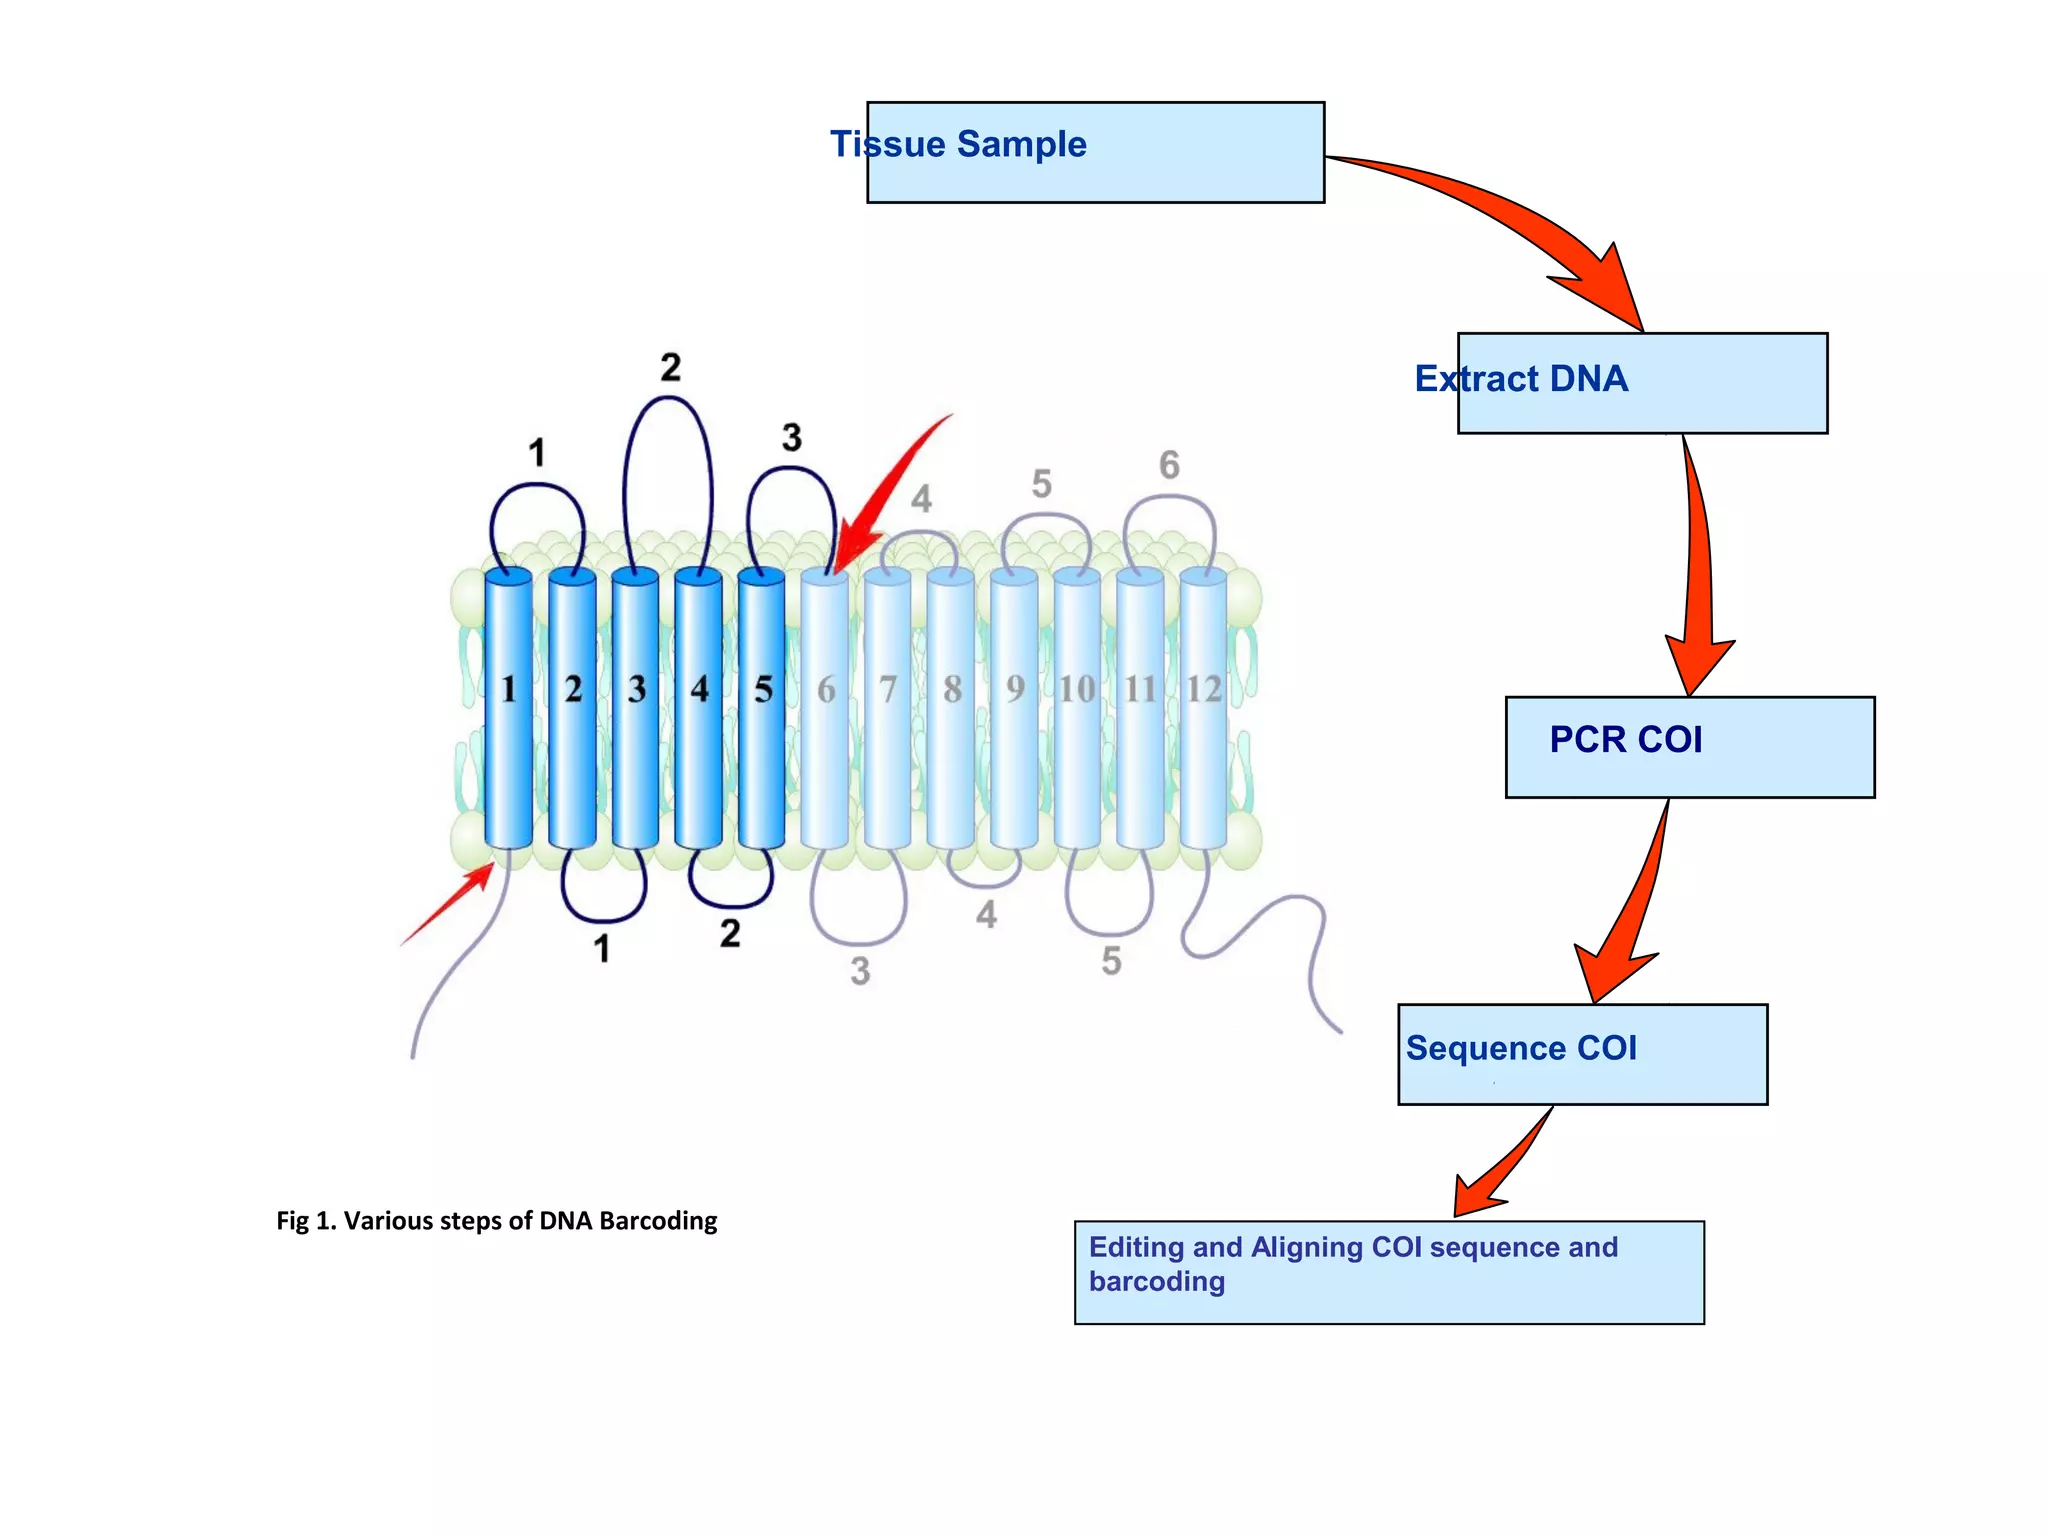
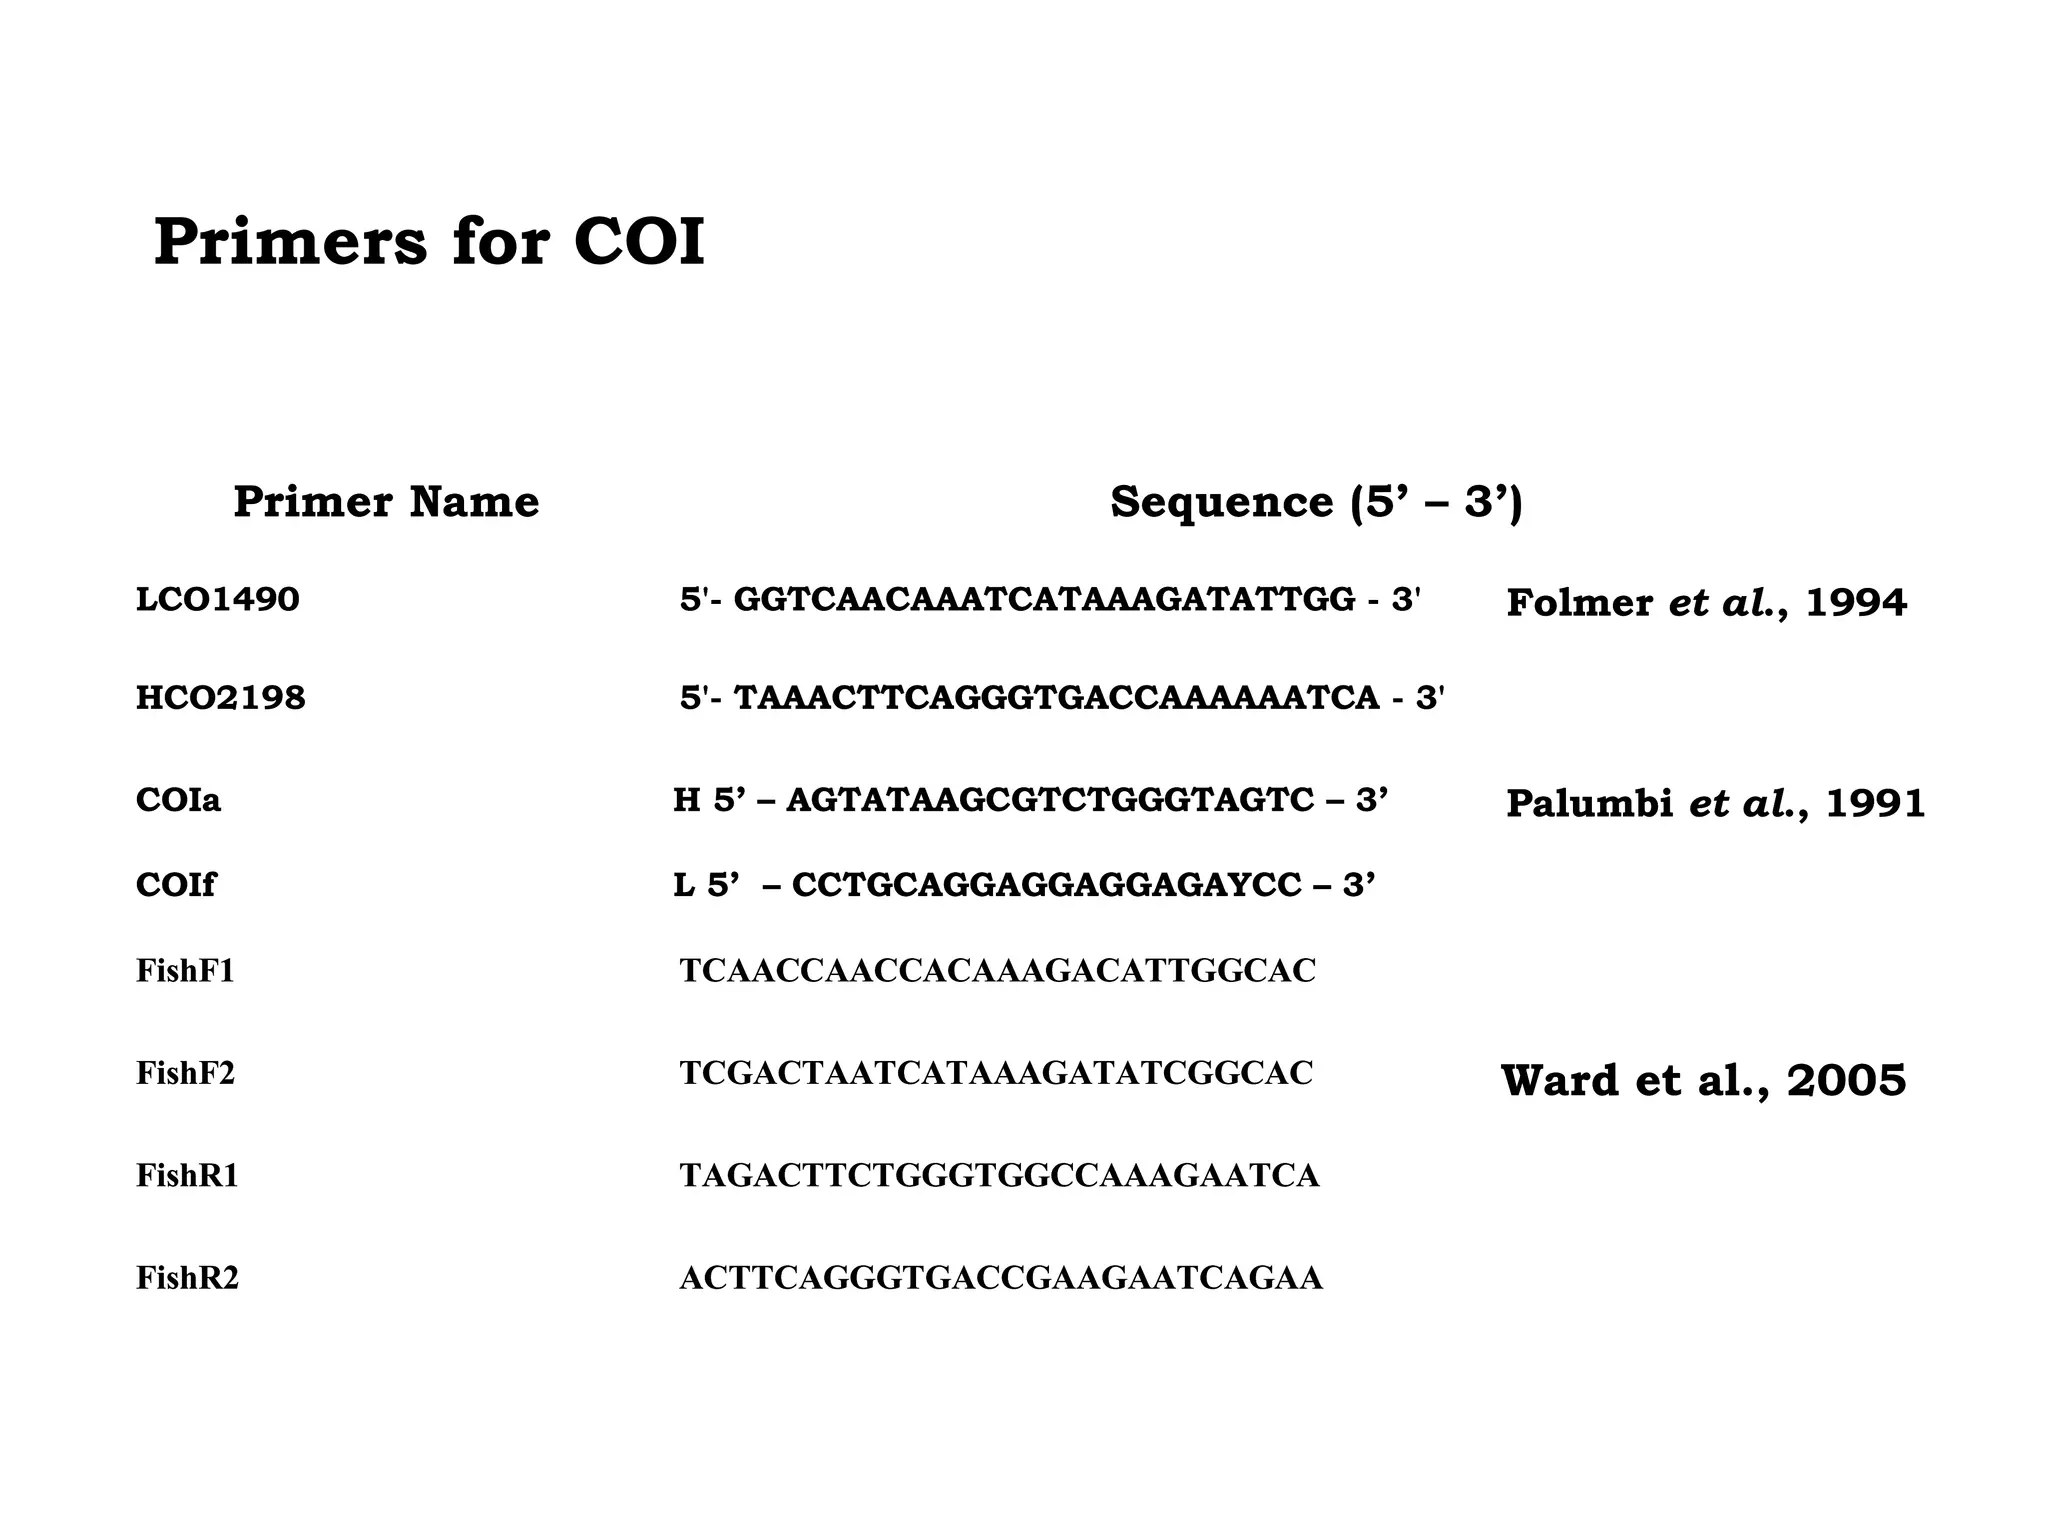
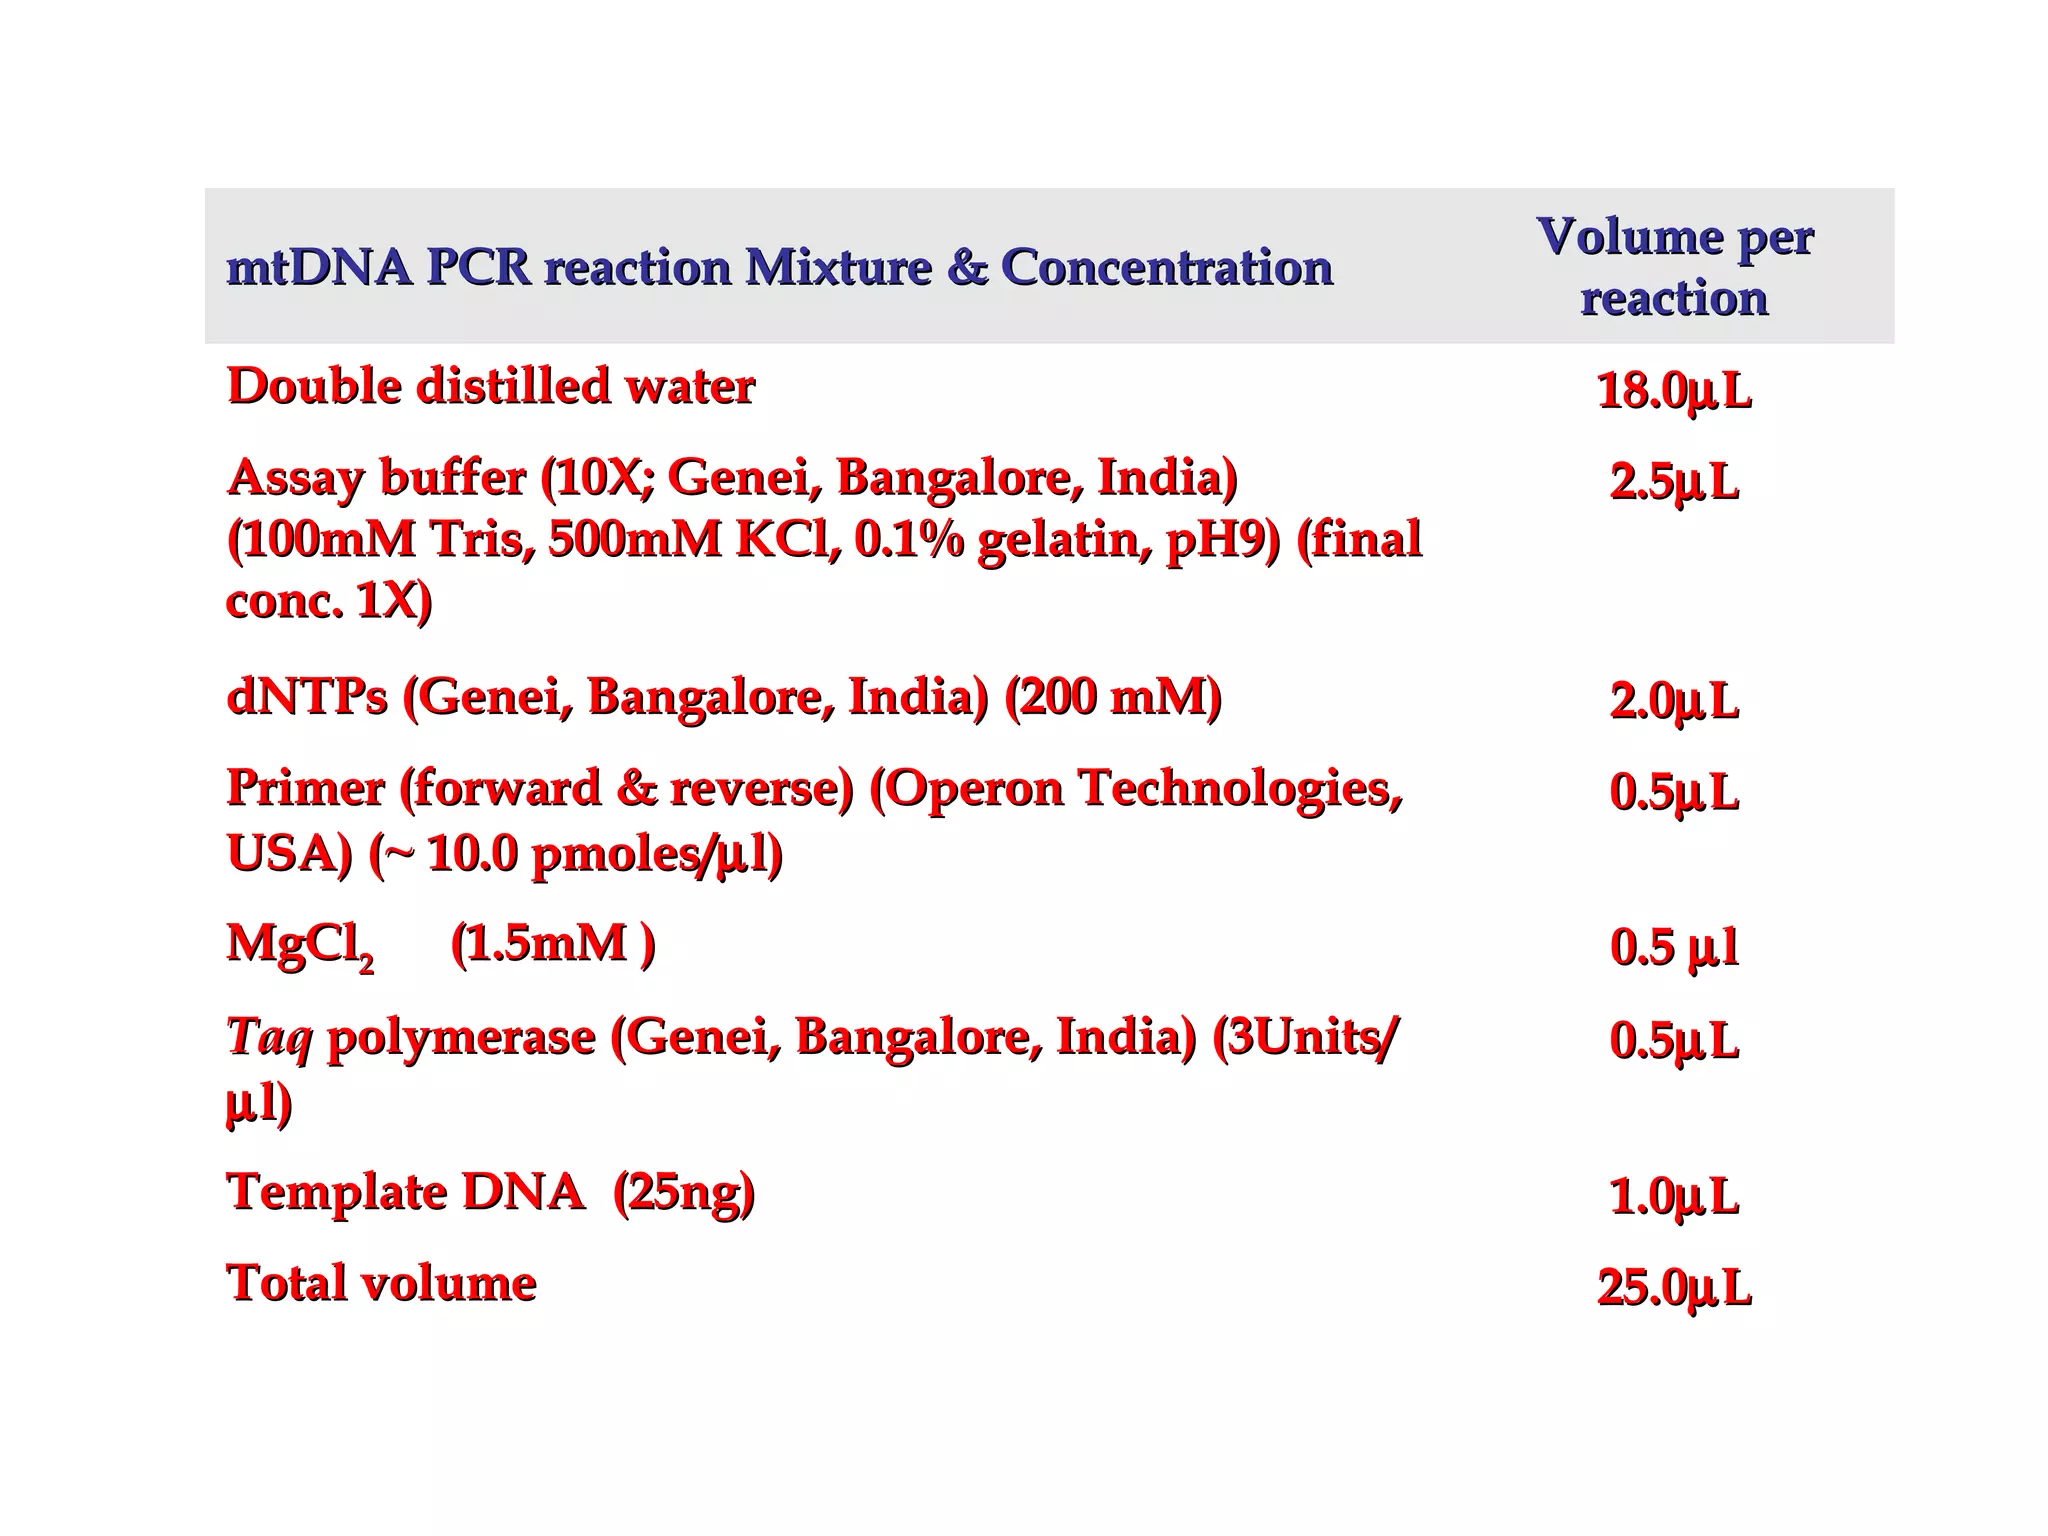
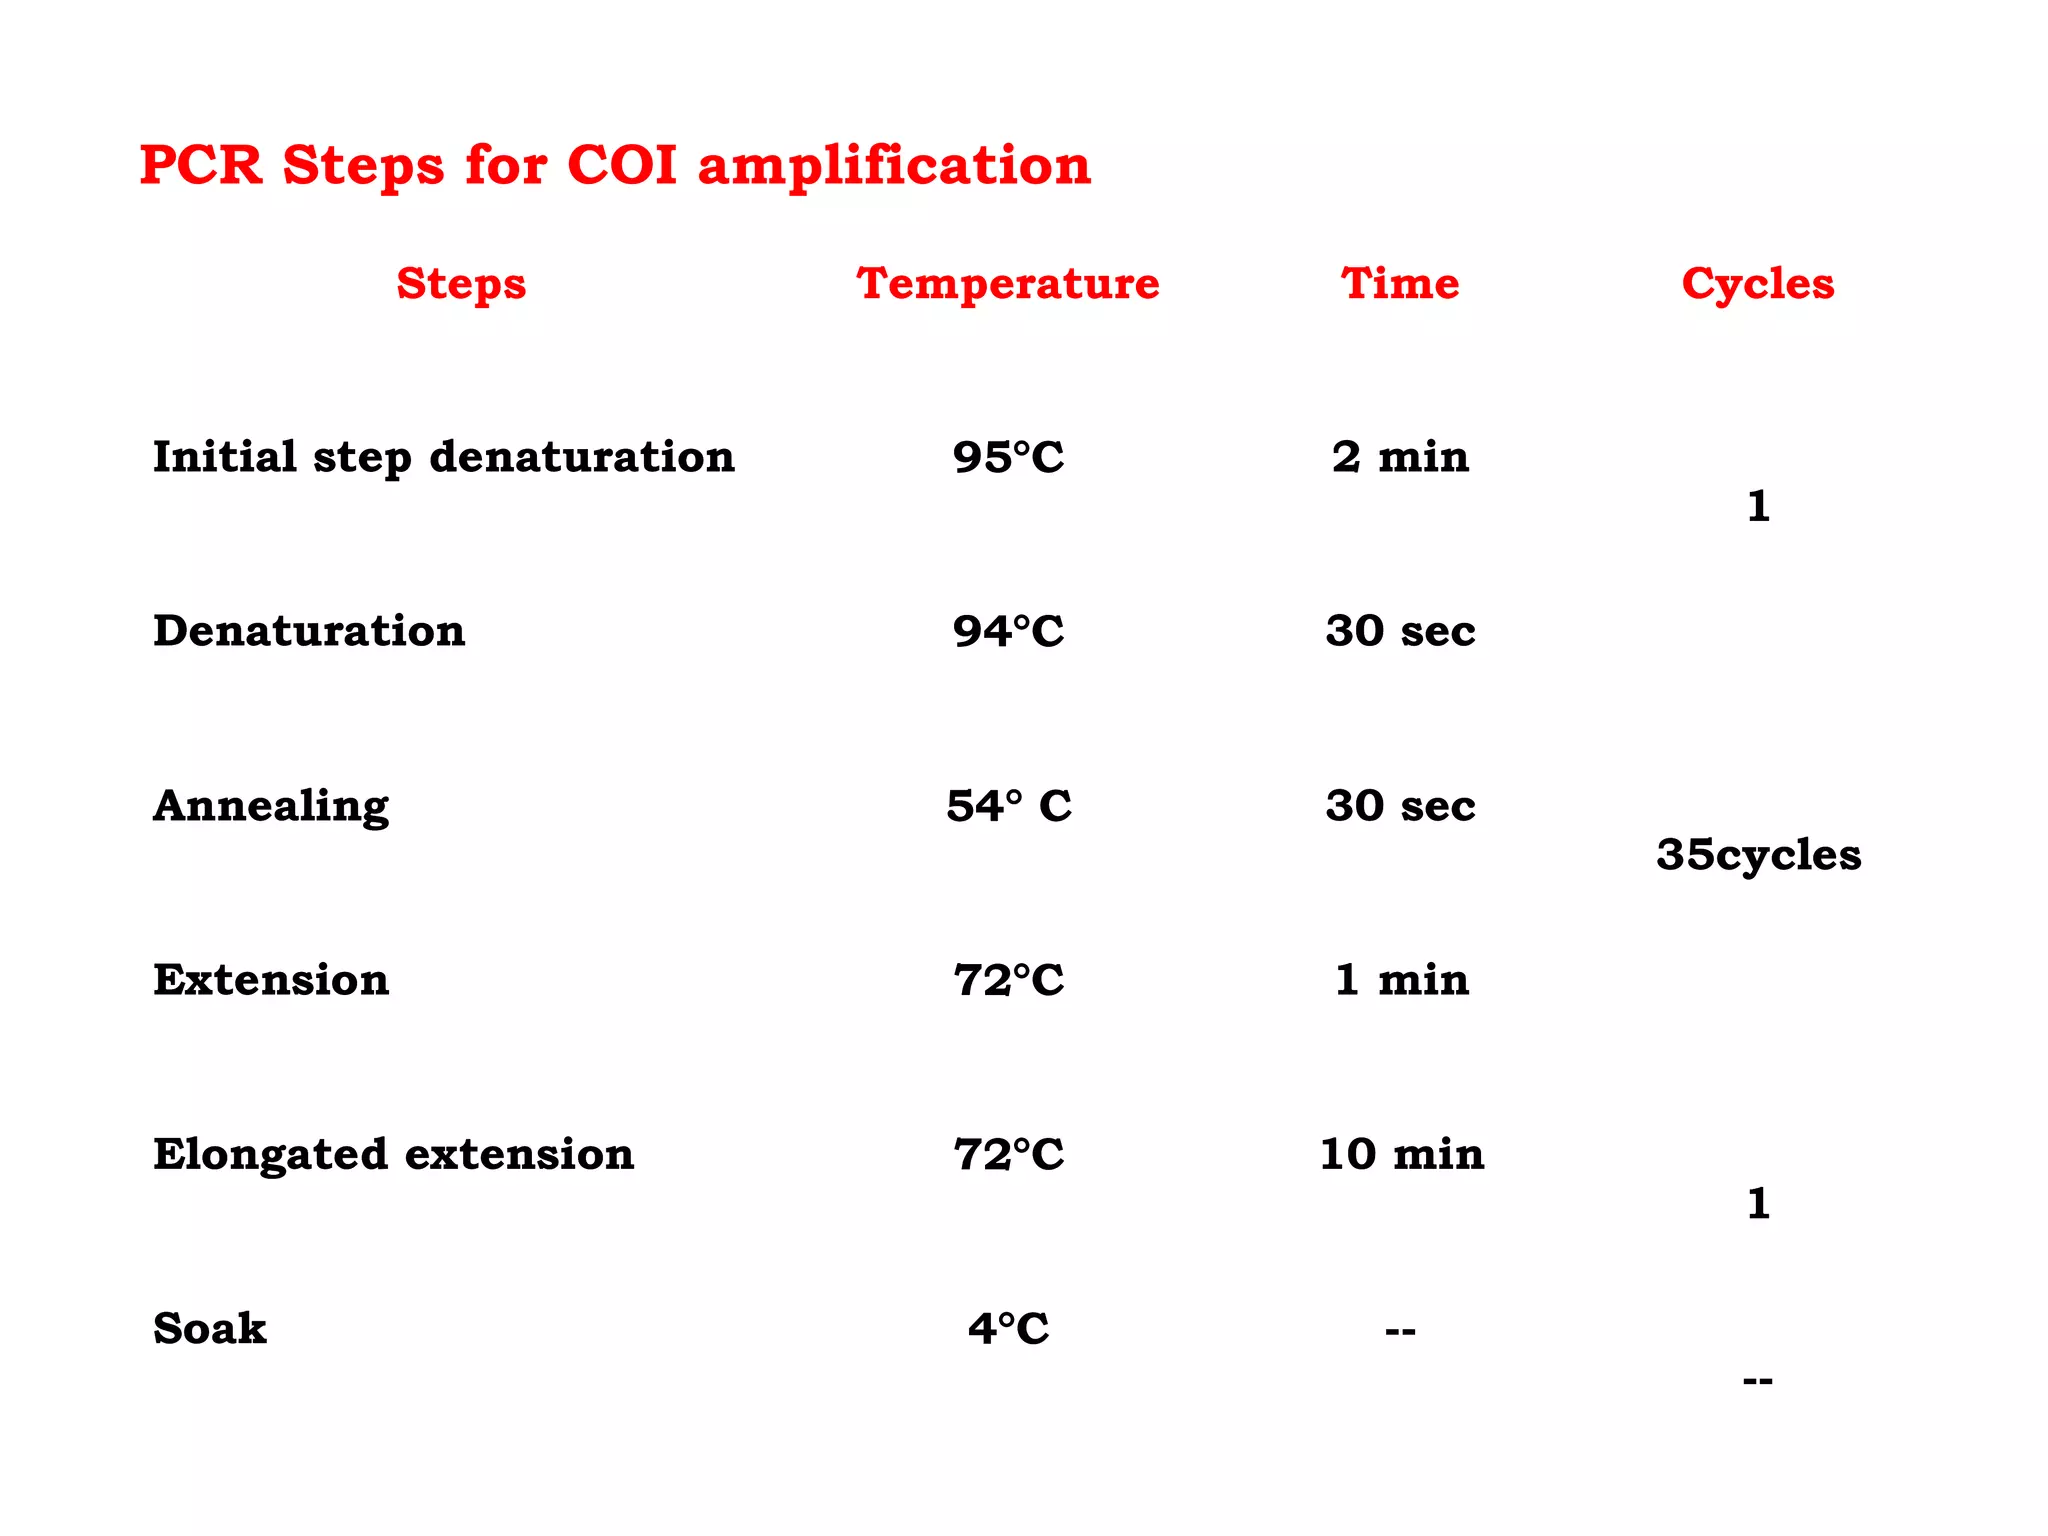
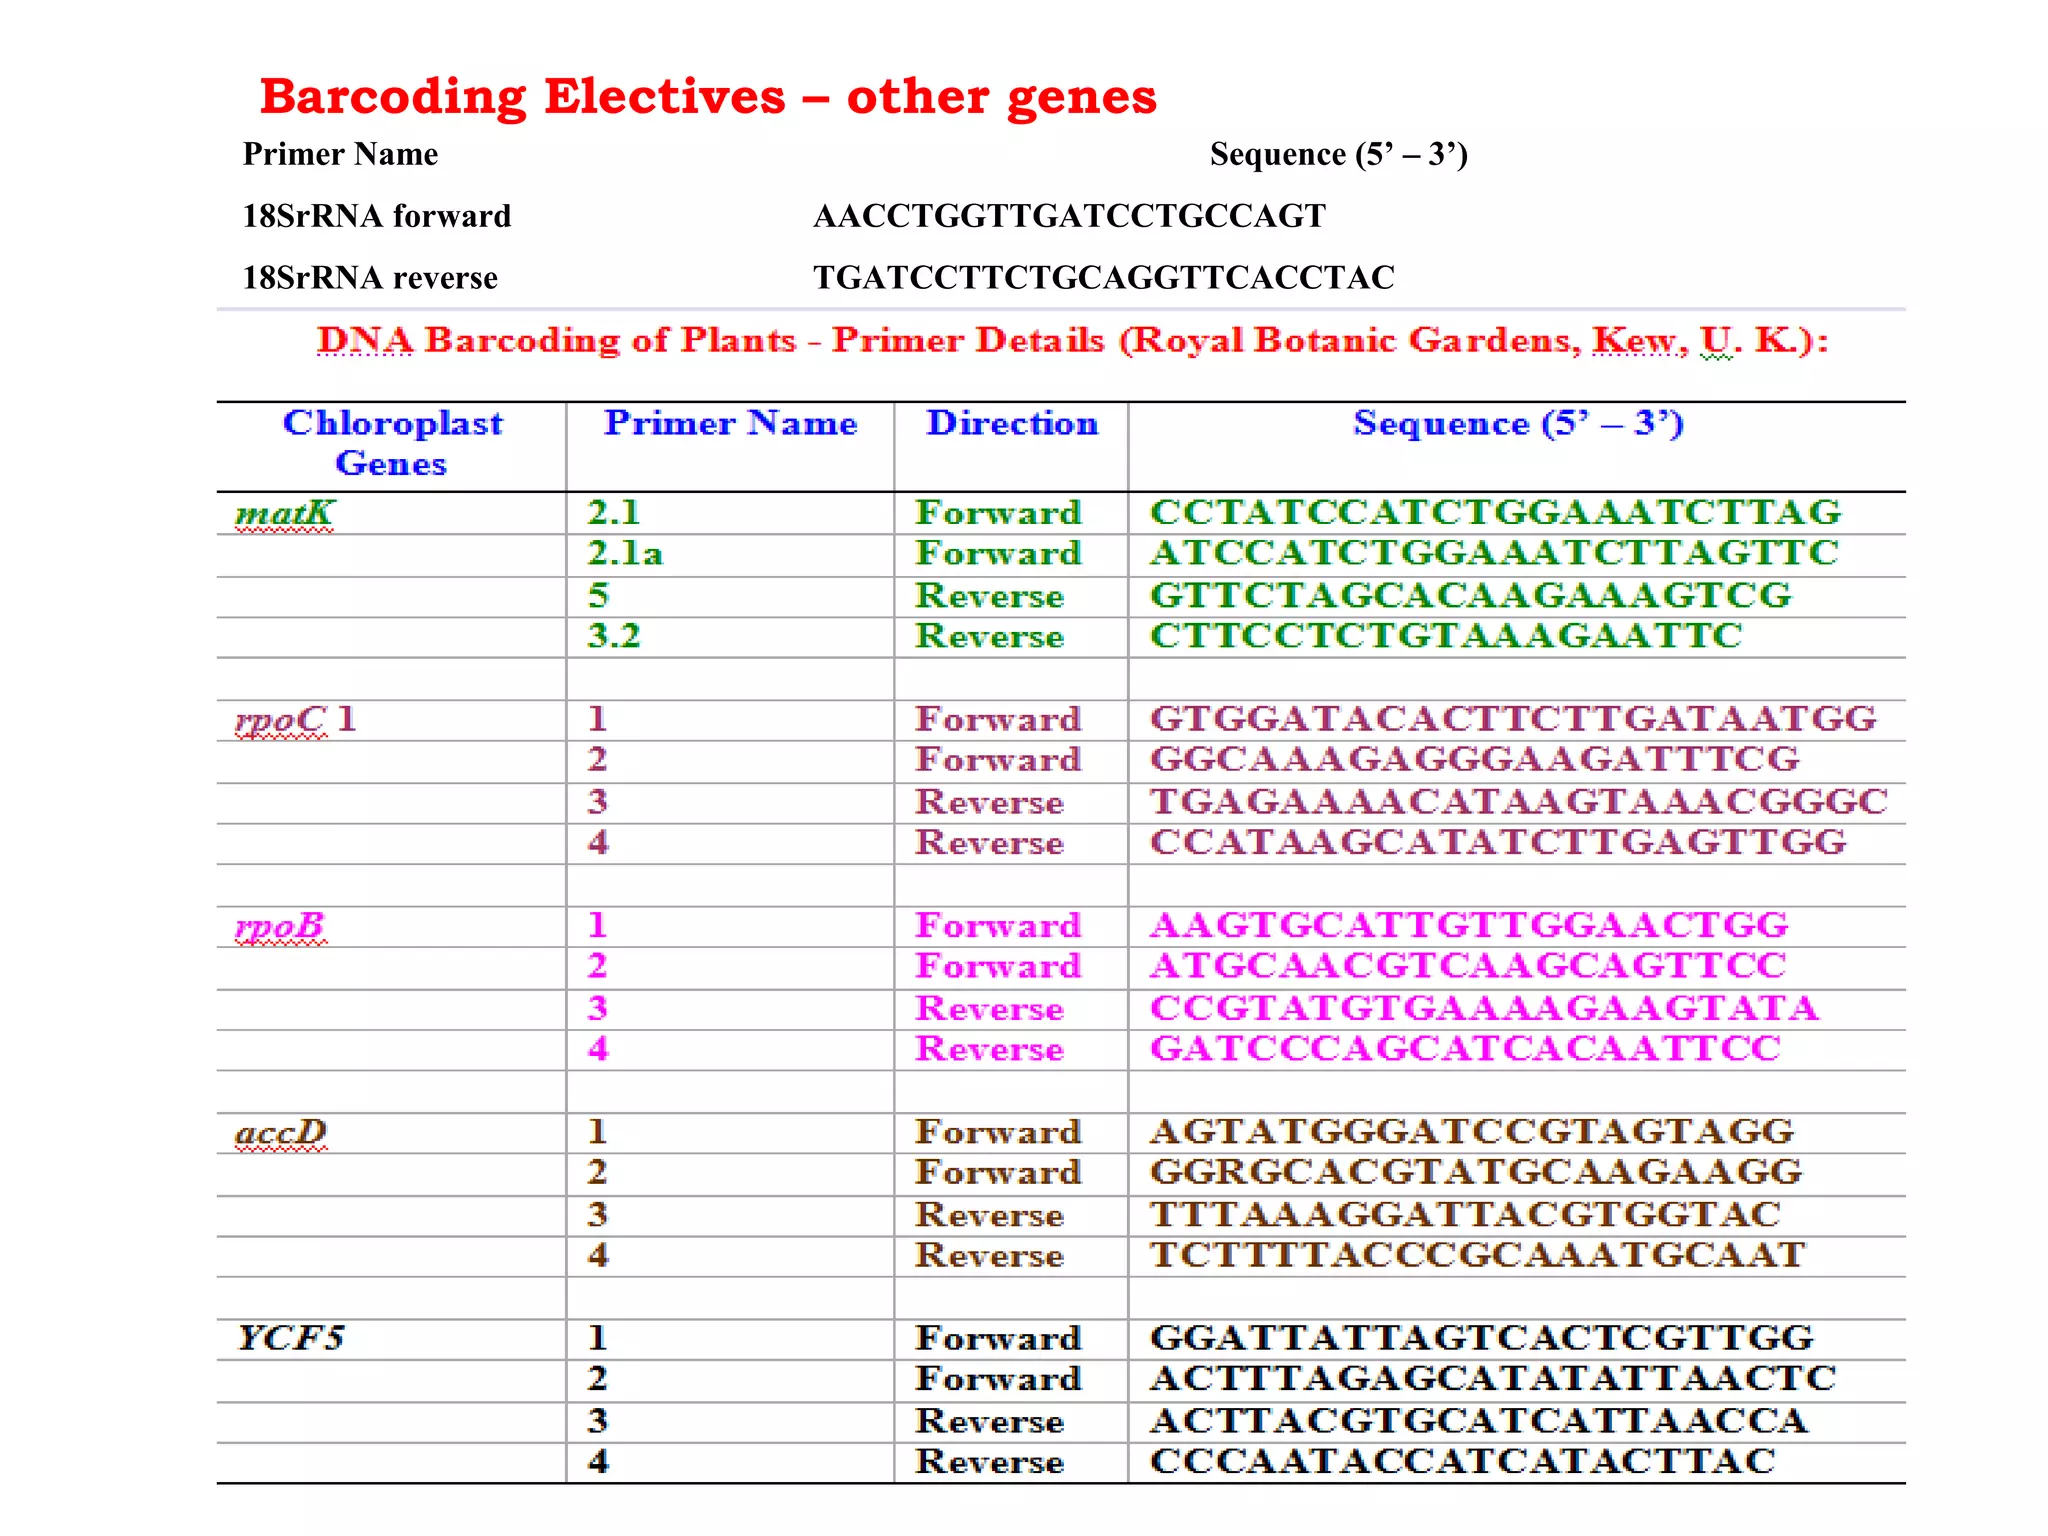
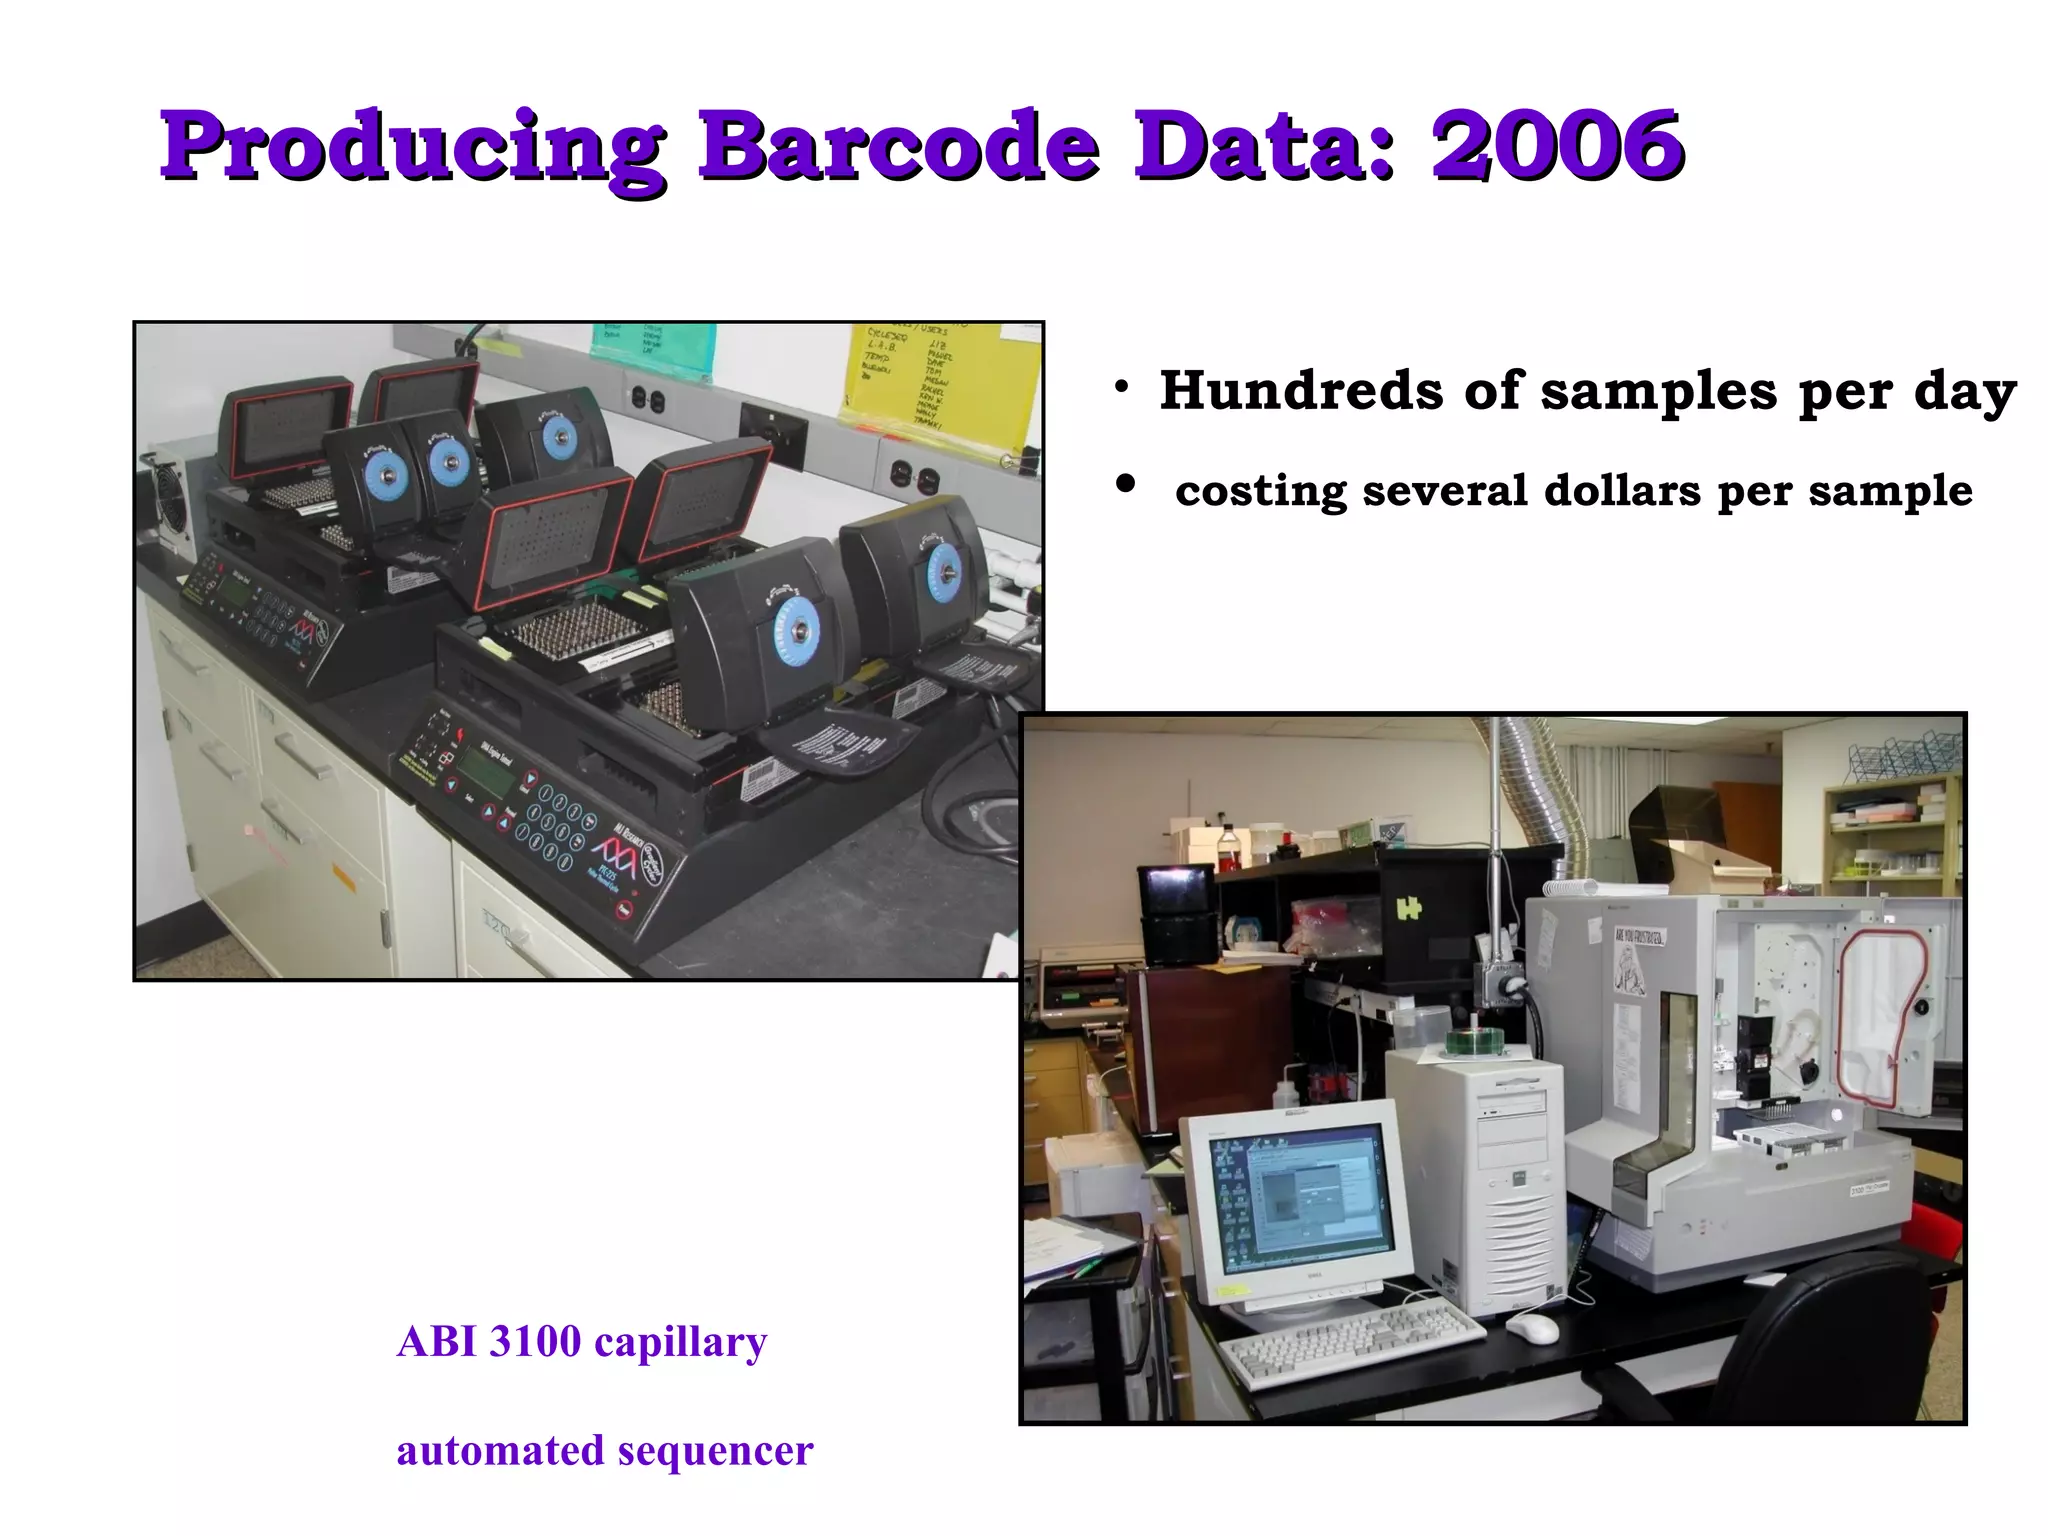
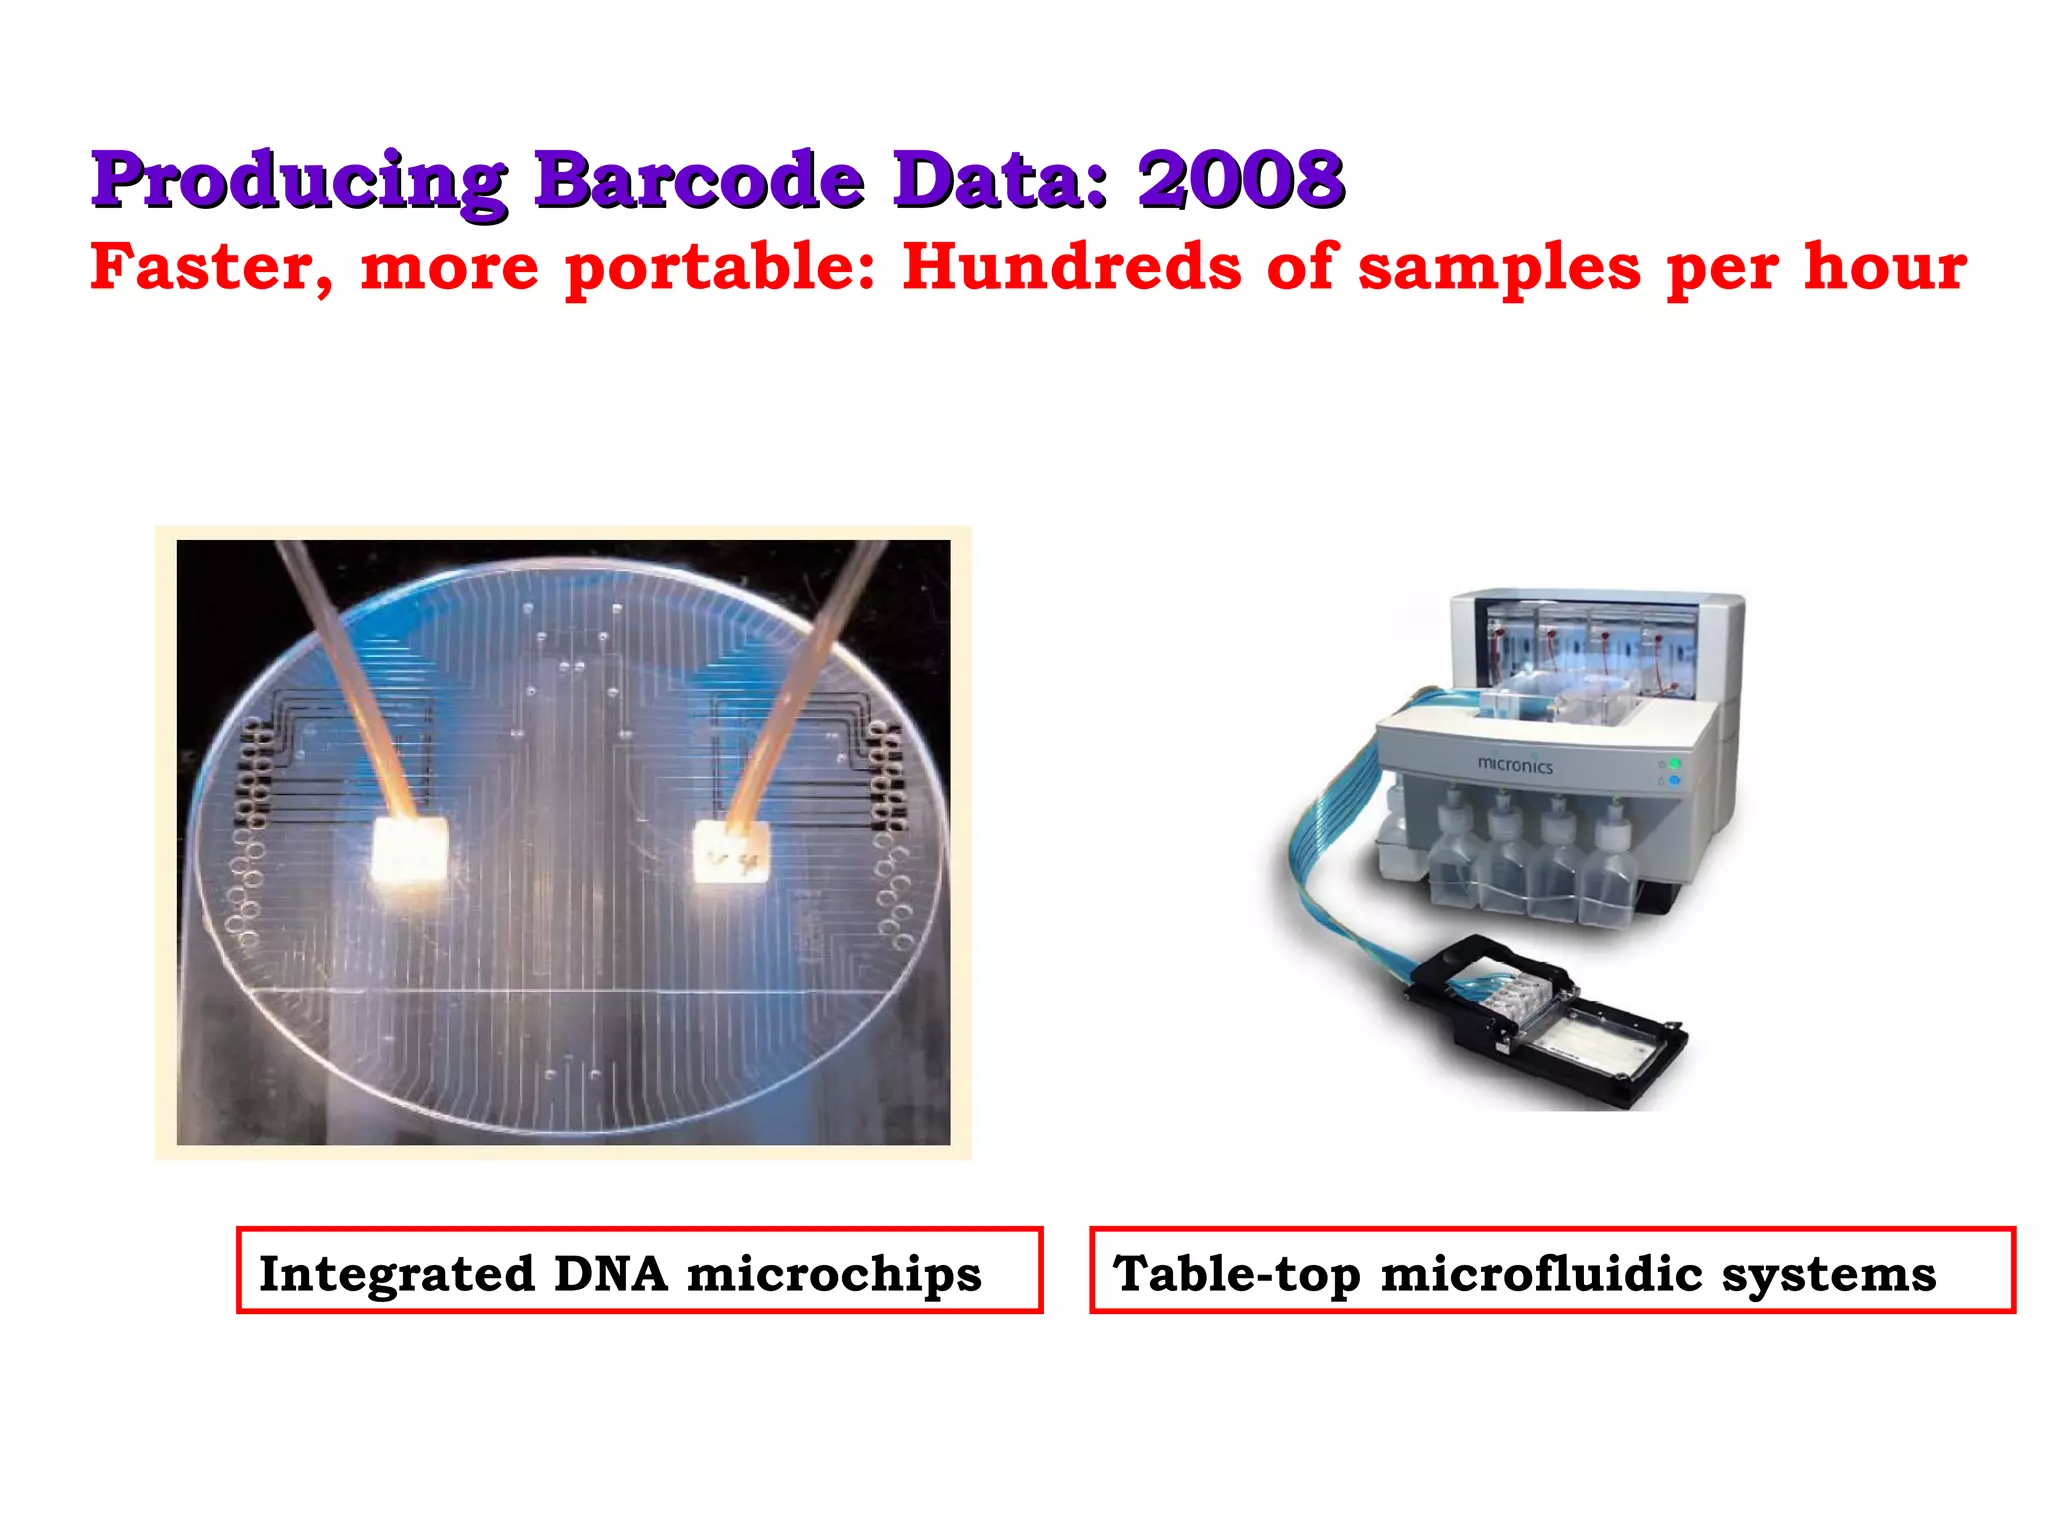
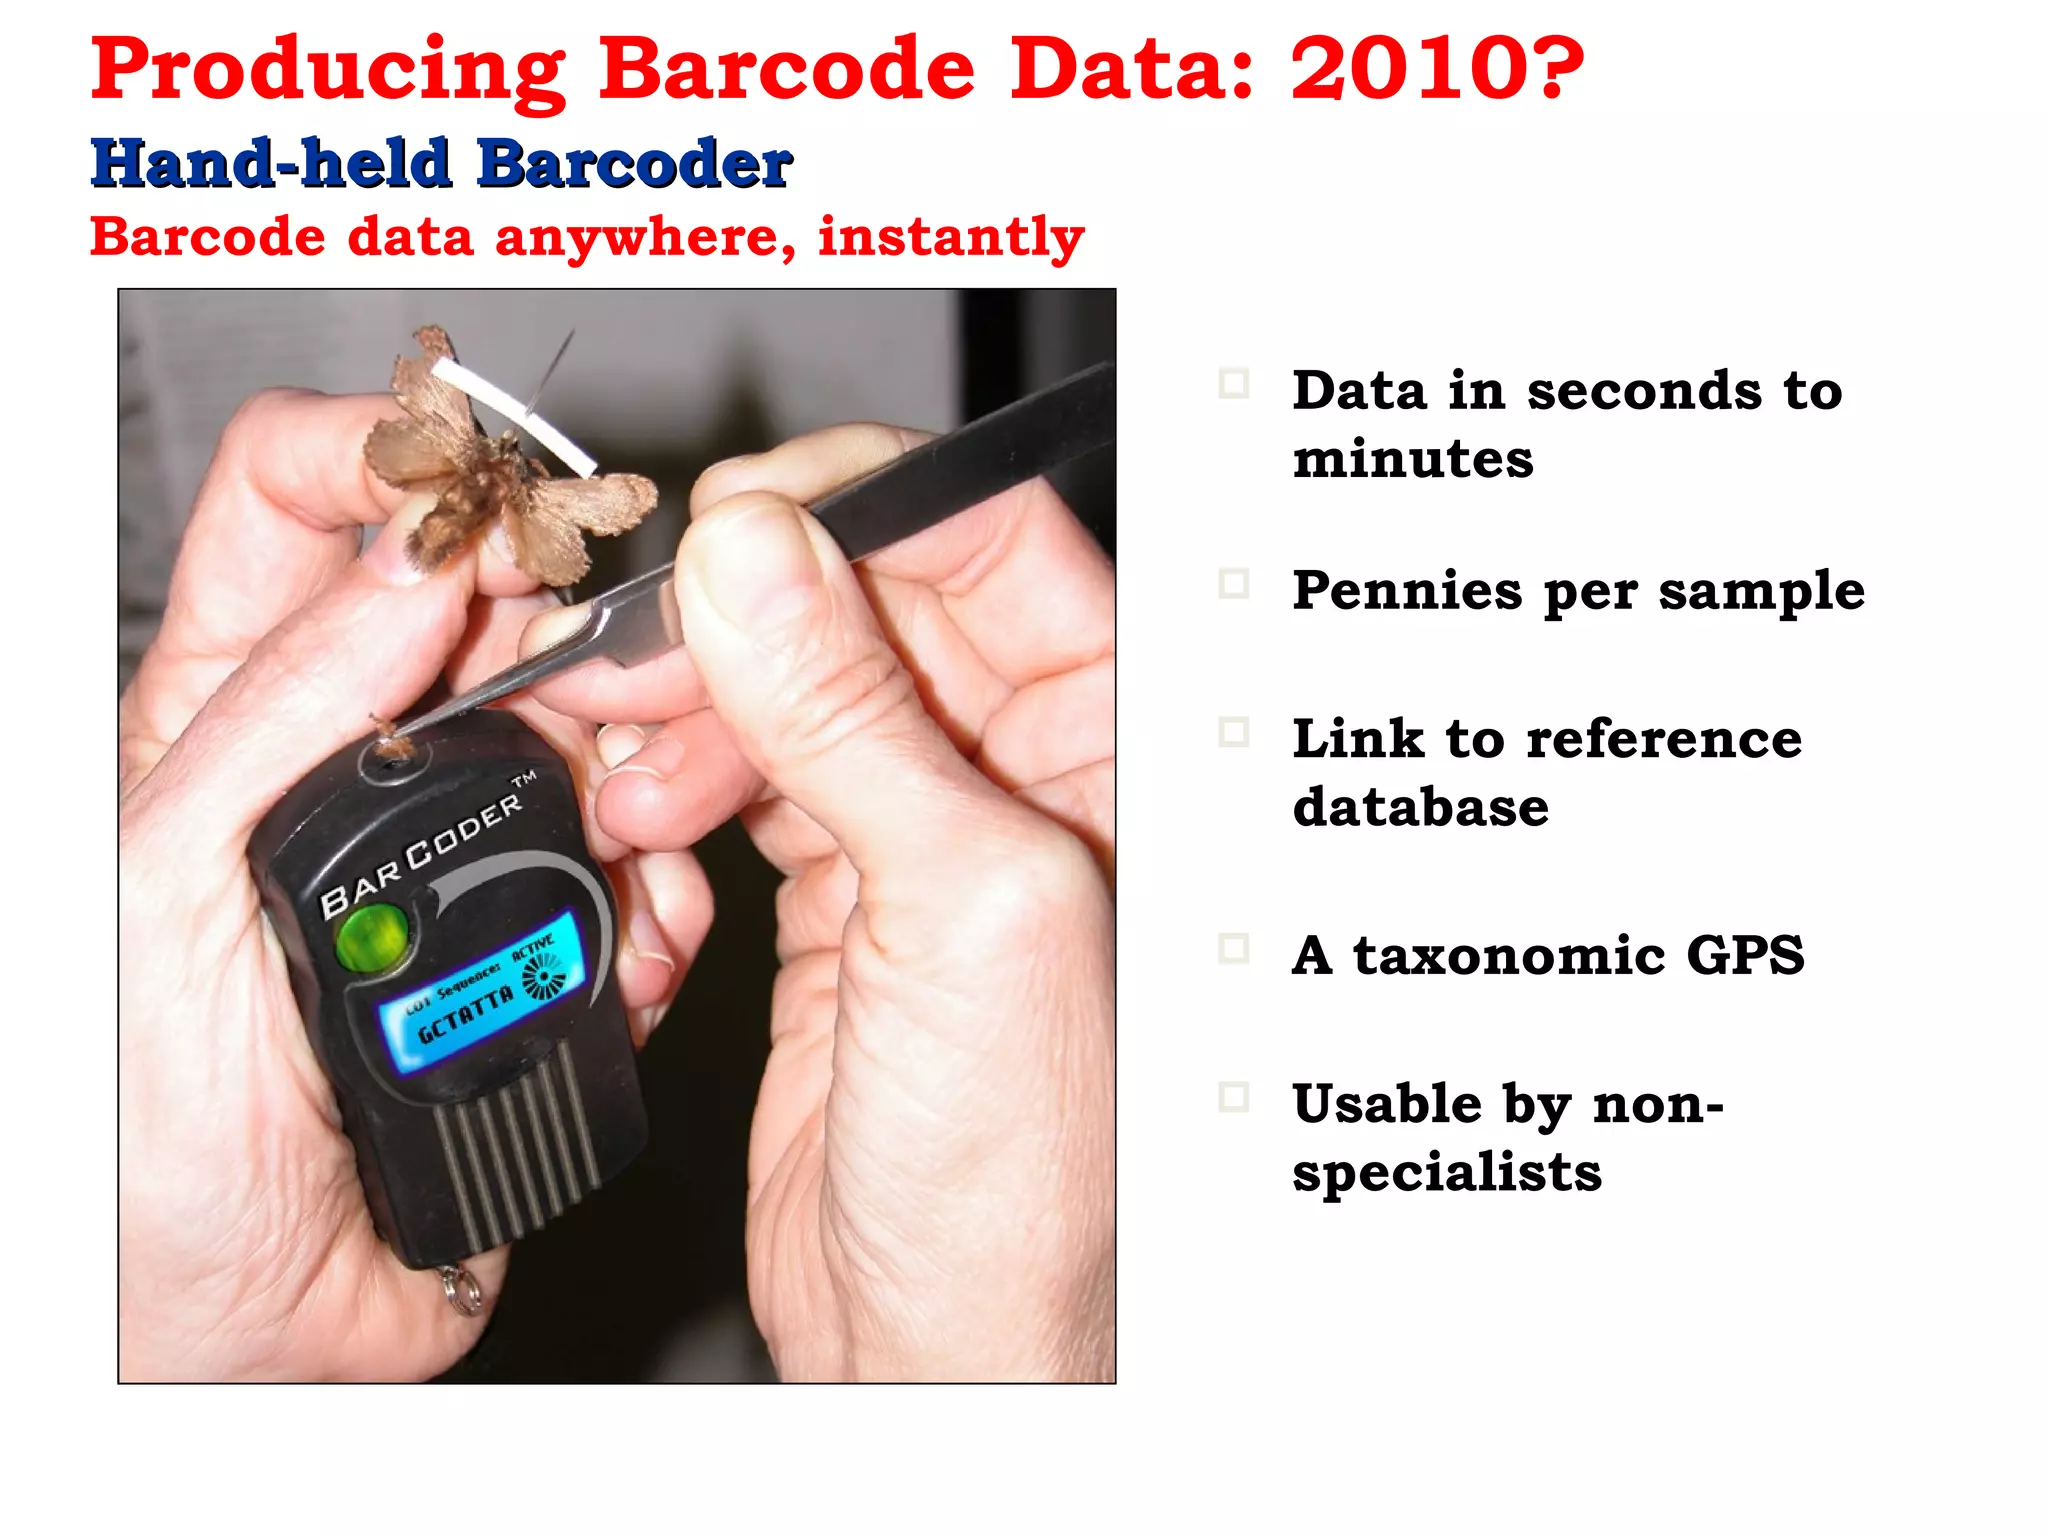
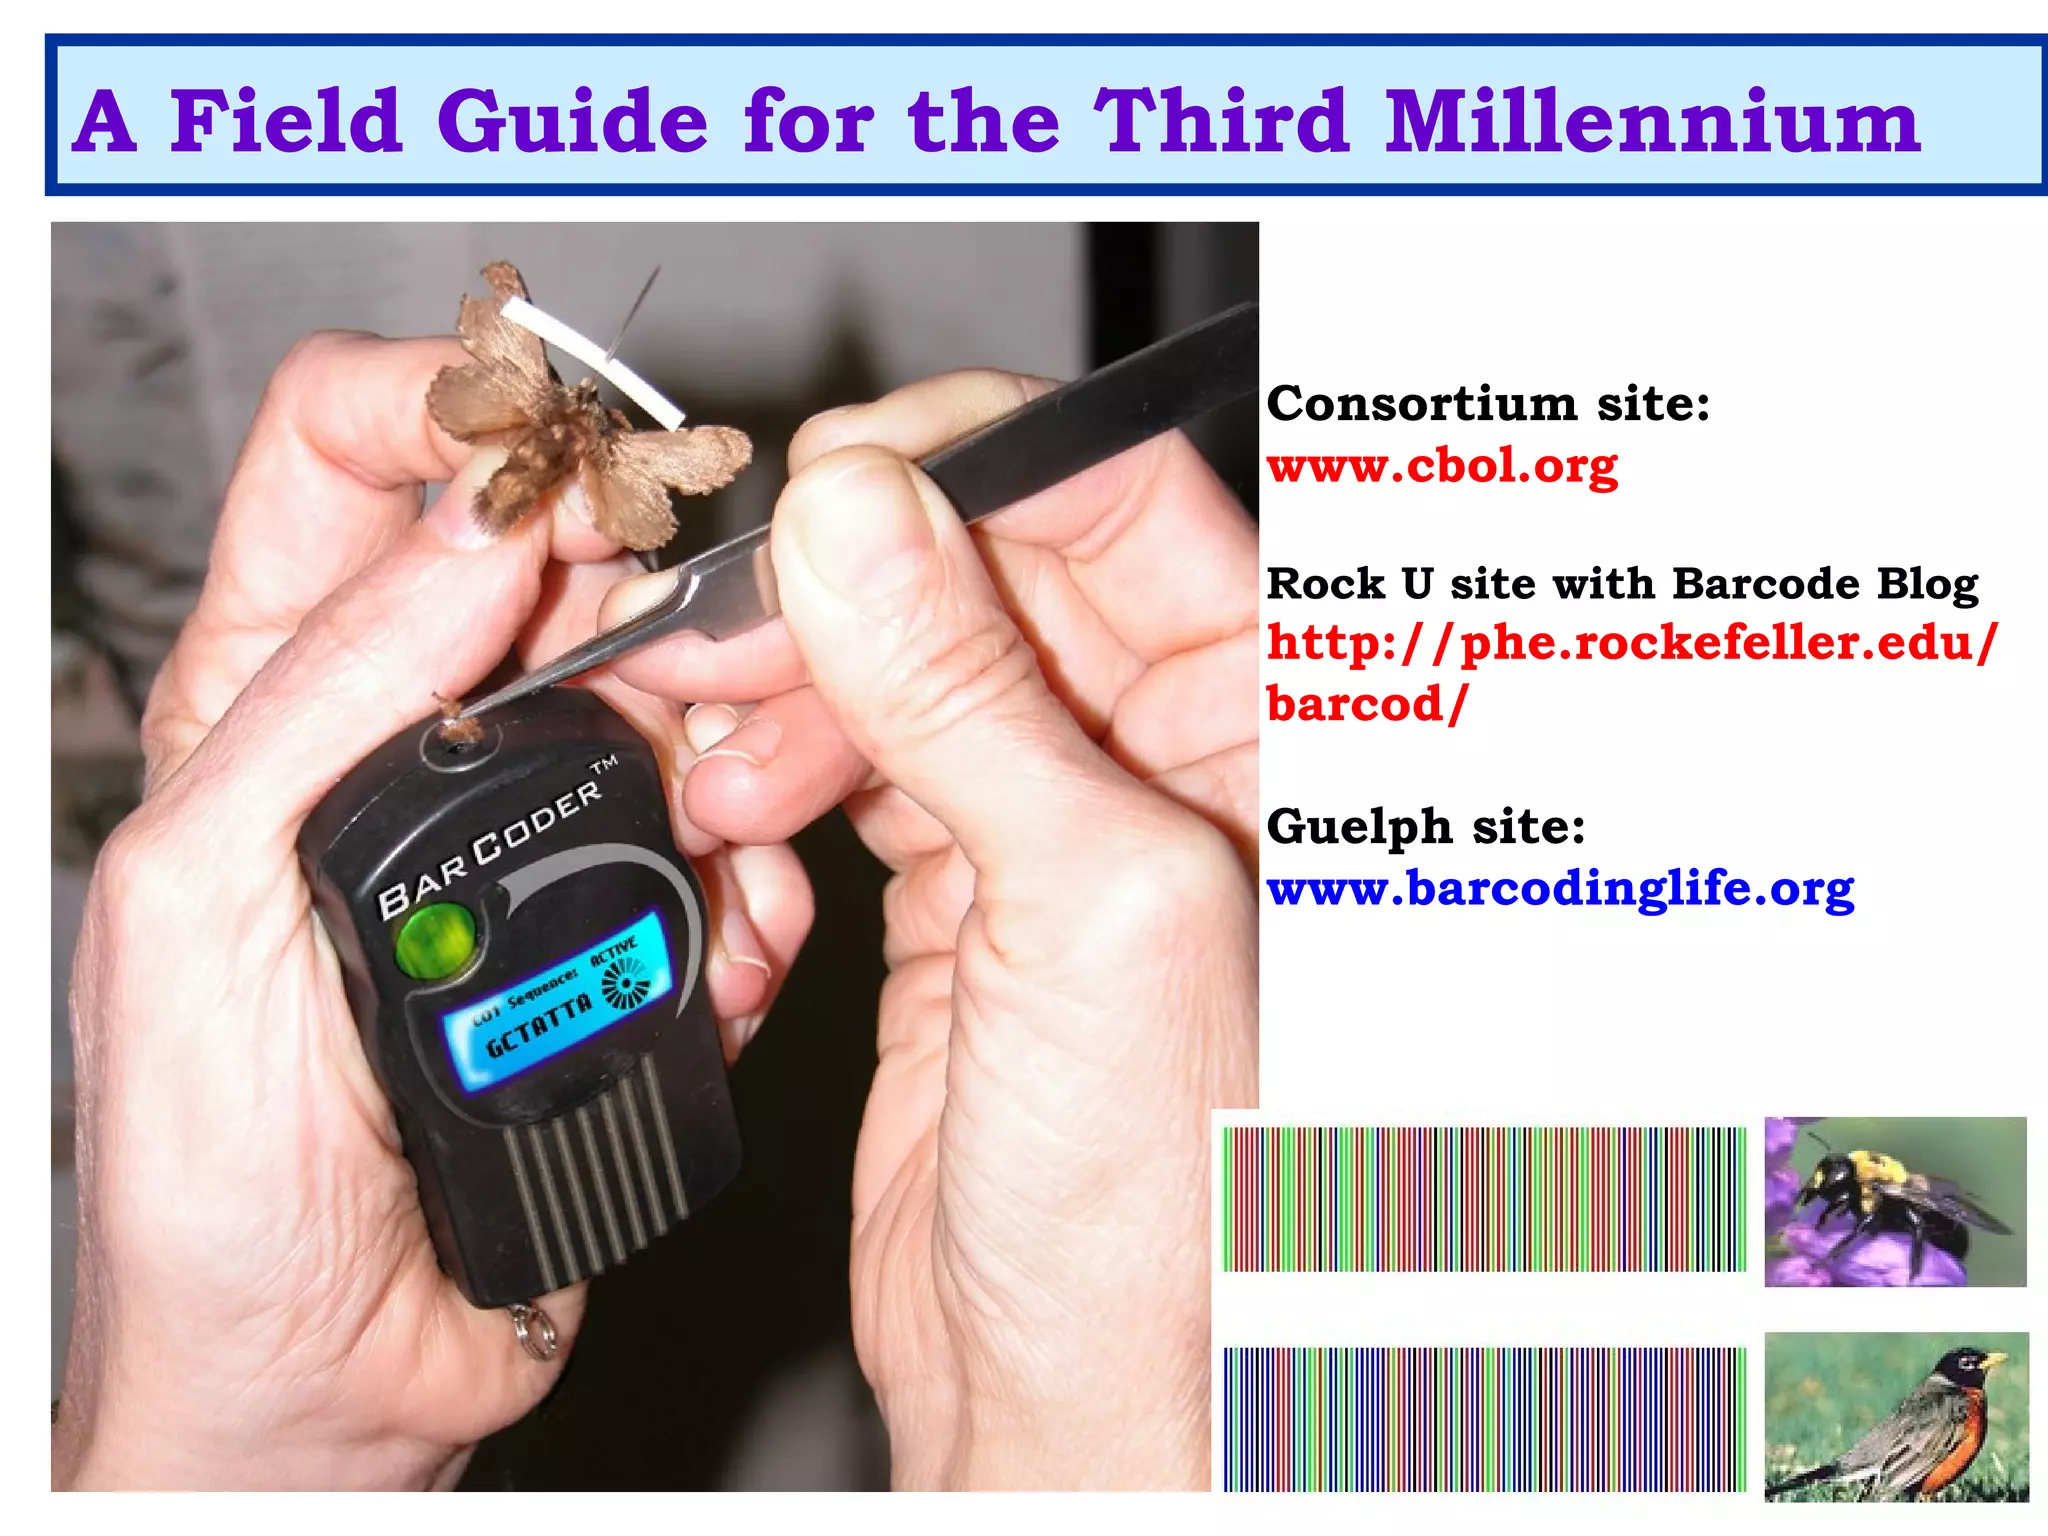
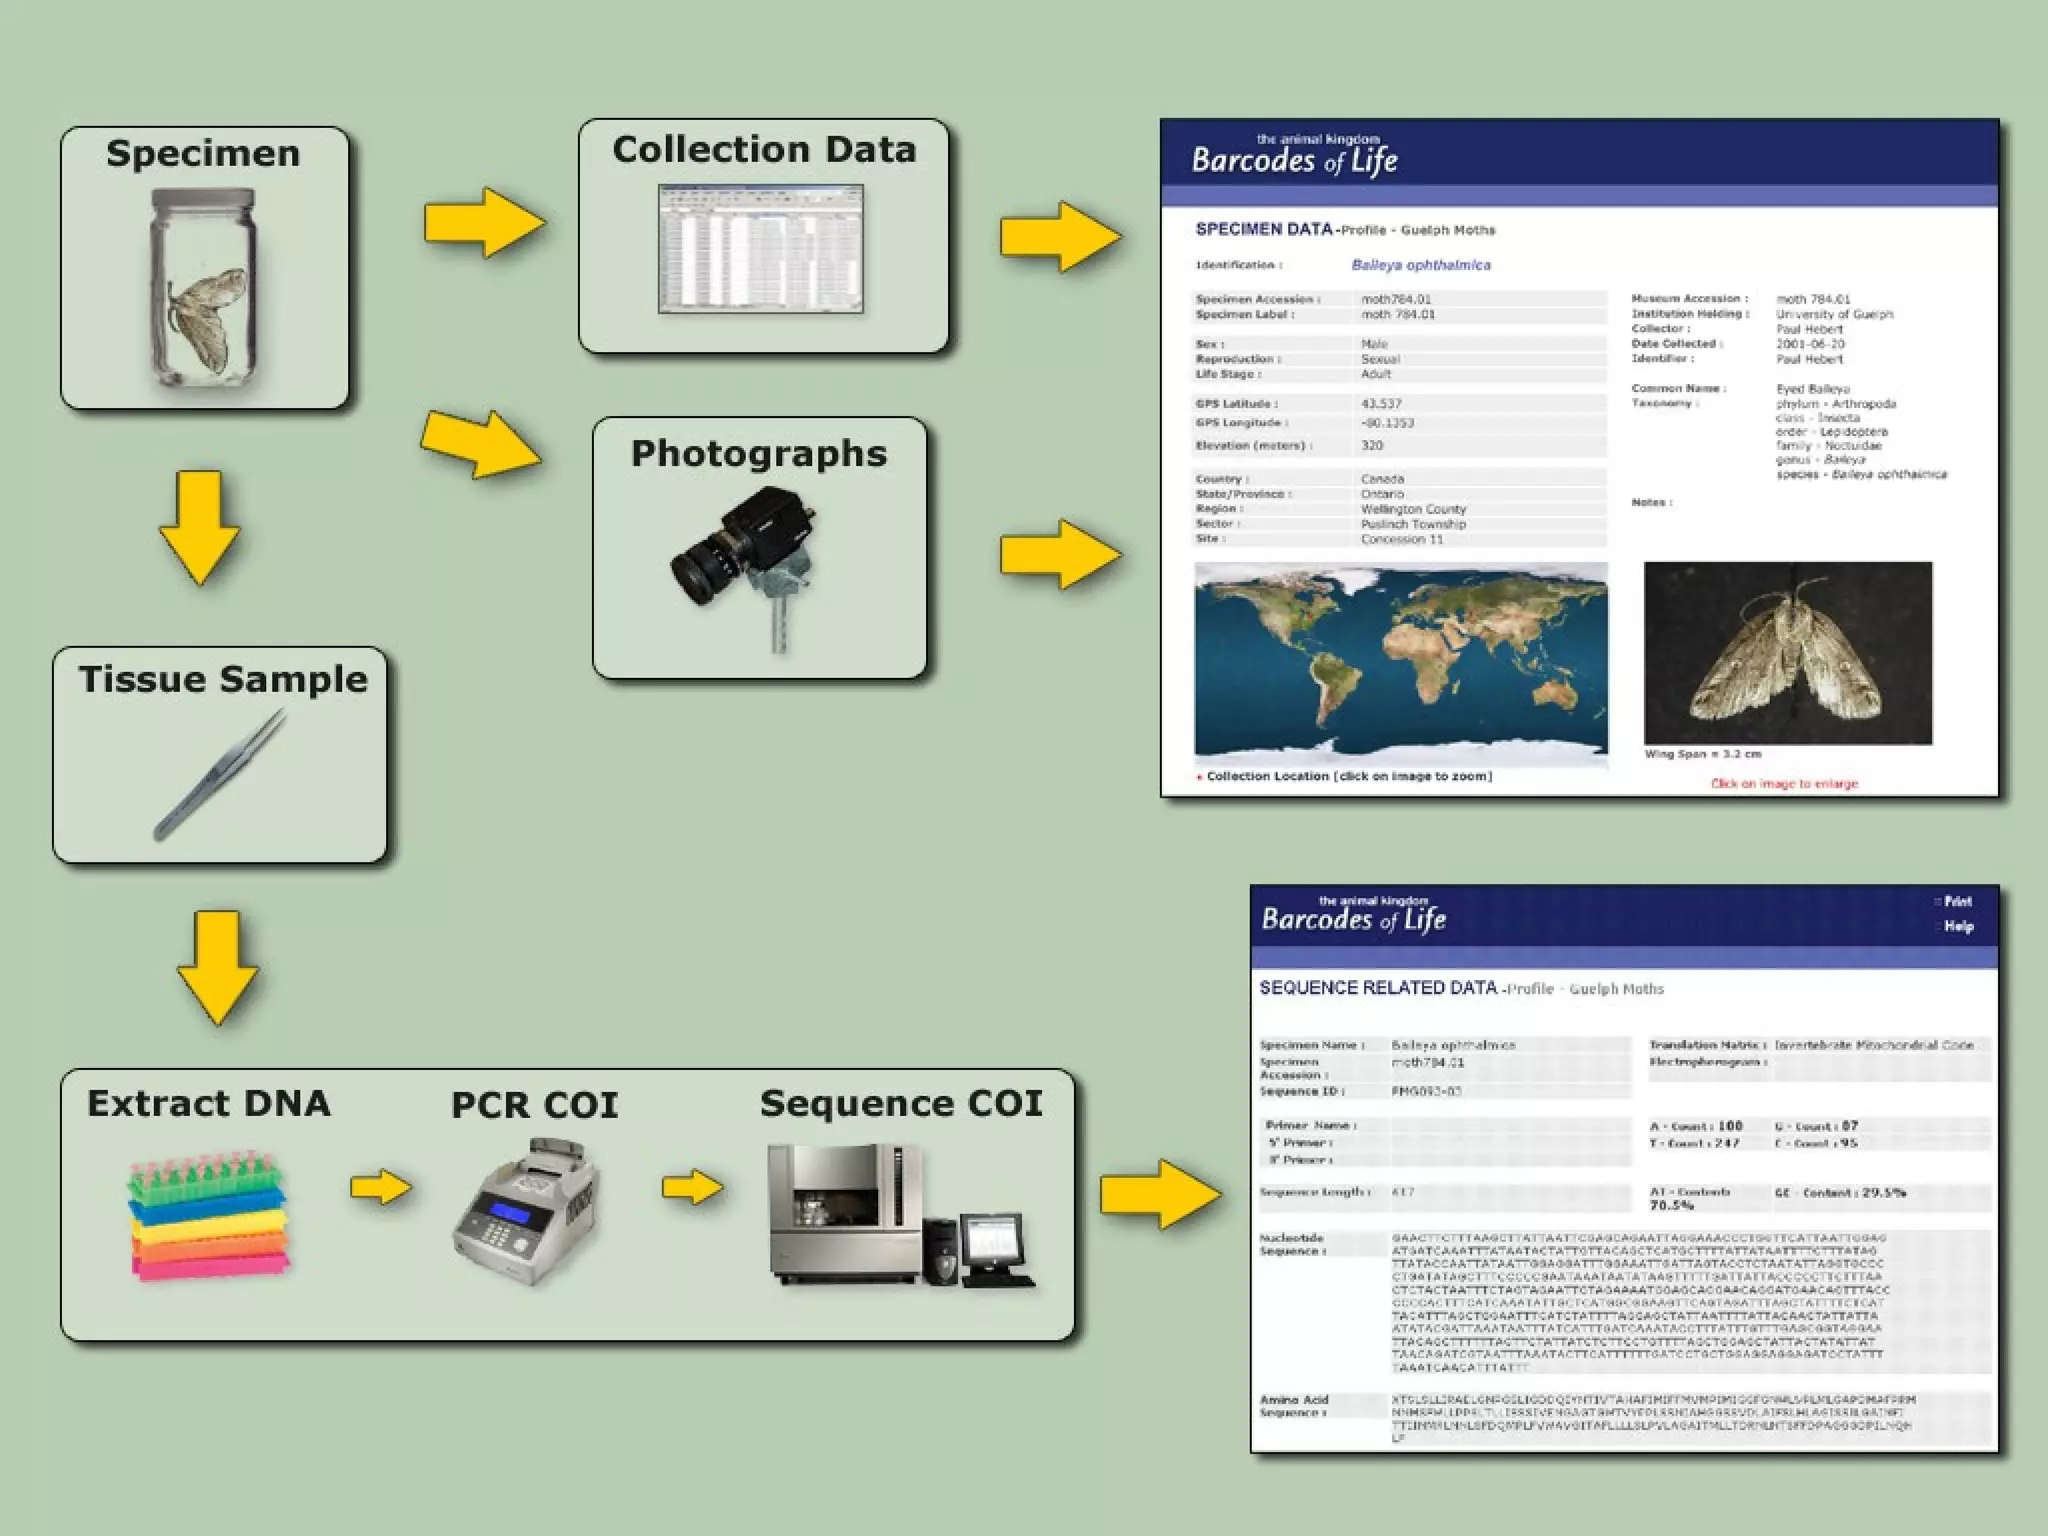


DNA barcoding uses a short, standardized gene sequence from a uniform region of mitochondrial or nuclear DNA to identify species. It has potential to identify the estimated 10 million eukaryotic species on Earth. The cytochrome c oxidase I (COI) gene region is commonly used for animals. DNA barcoding can identify specimens at all life stages, resolve taxonomic ambiguities, and enable development of electronic field guides. It involves tissue sampling, DNA extraction and amplification, sequencing, and comparing sequences to reference databases. Costs and time for the process are decreasing with new technologies. Global efforts aim to compile barcodes for all known eukaryotes.


