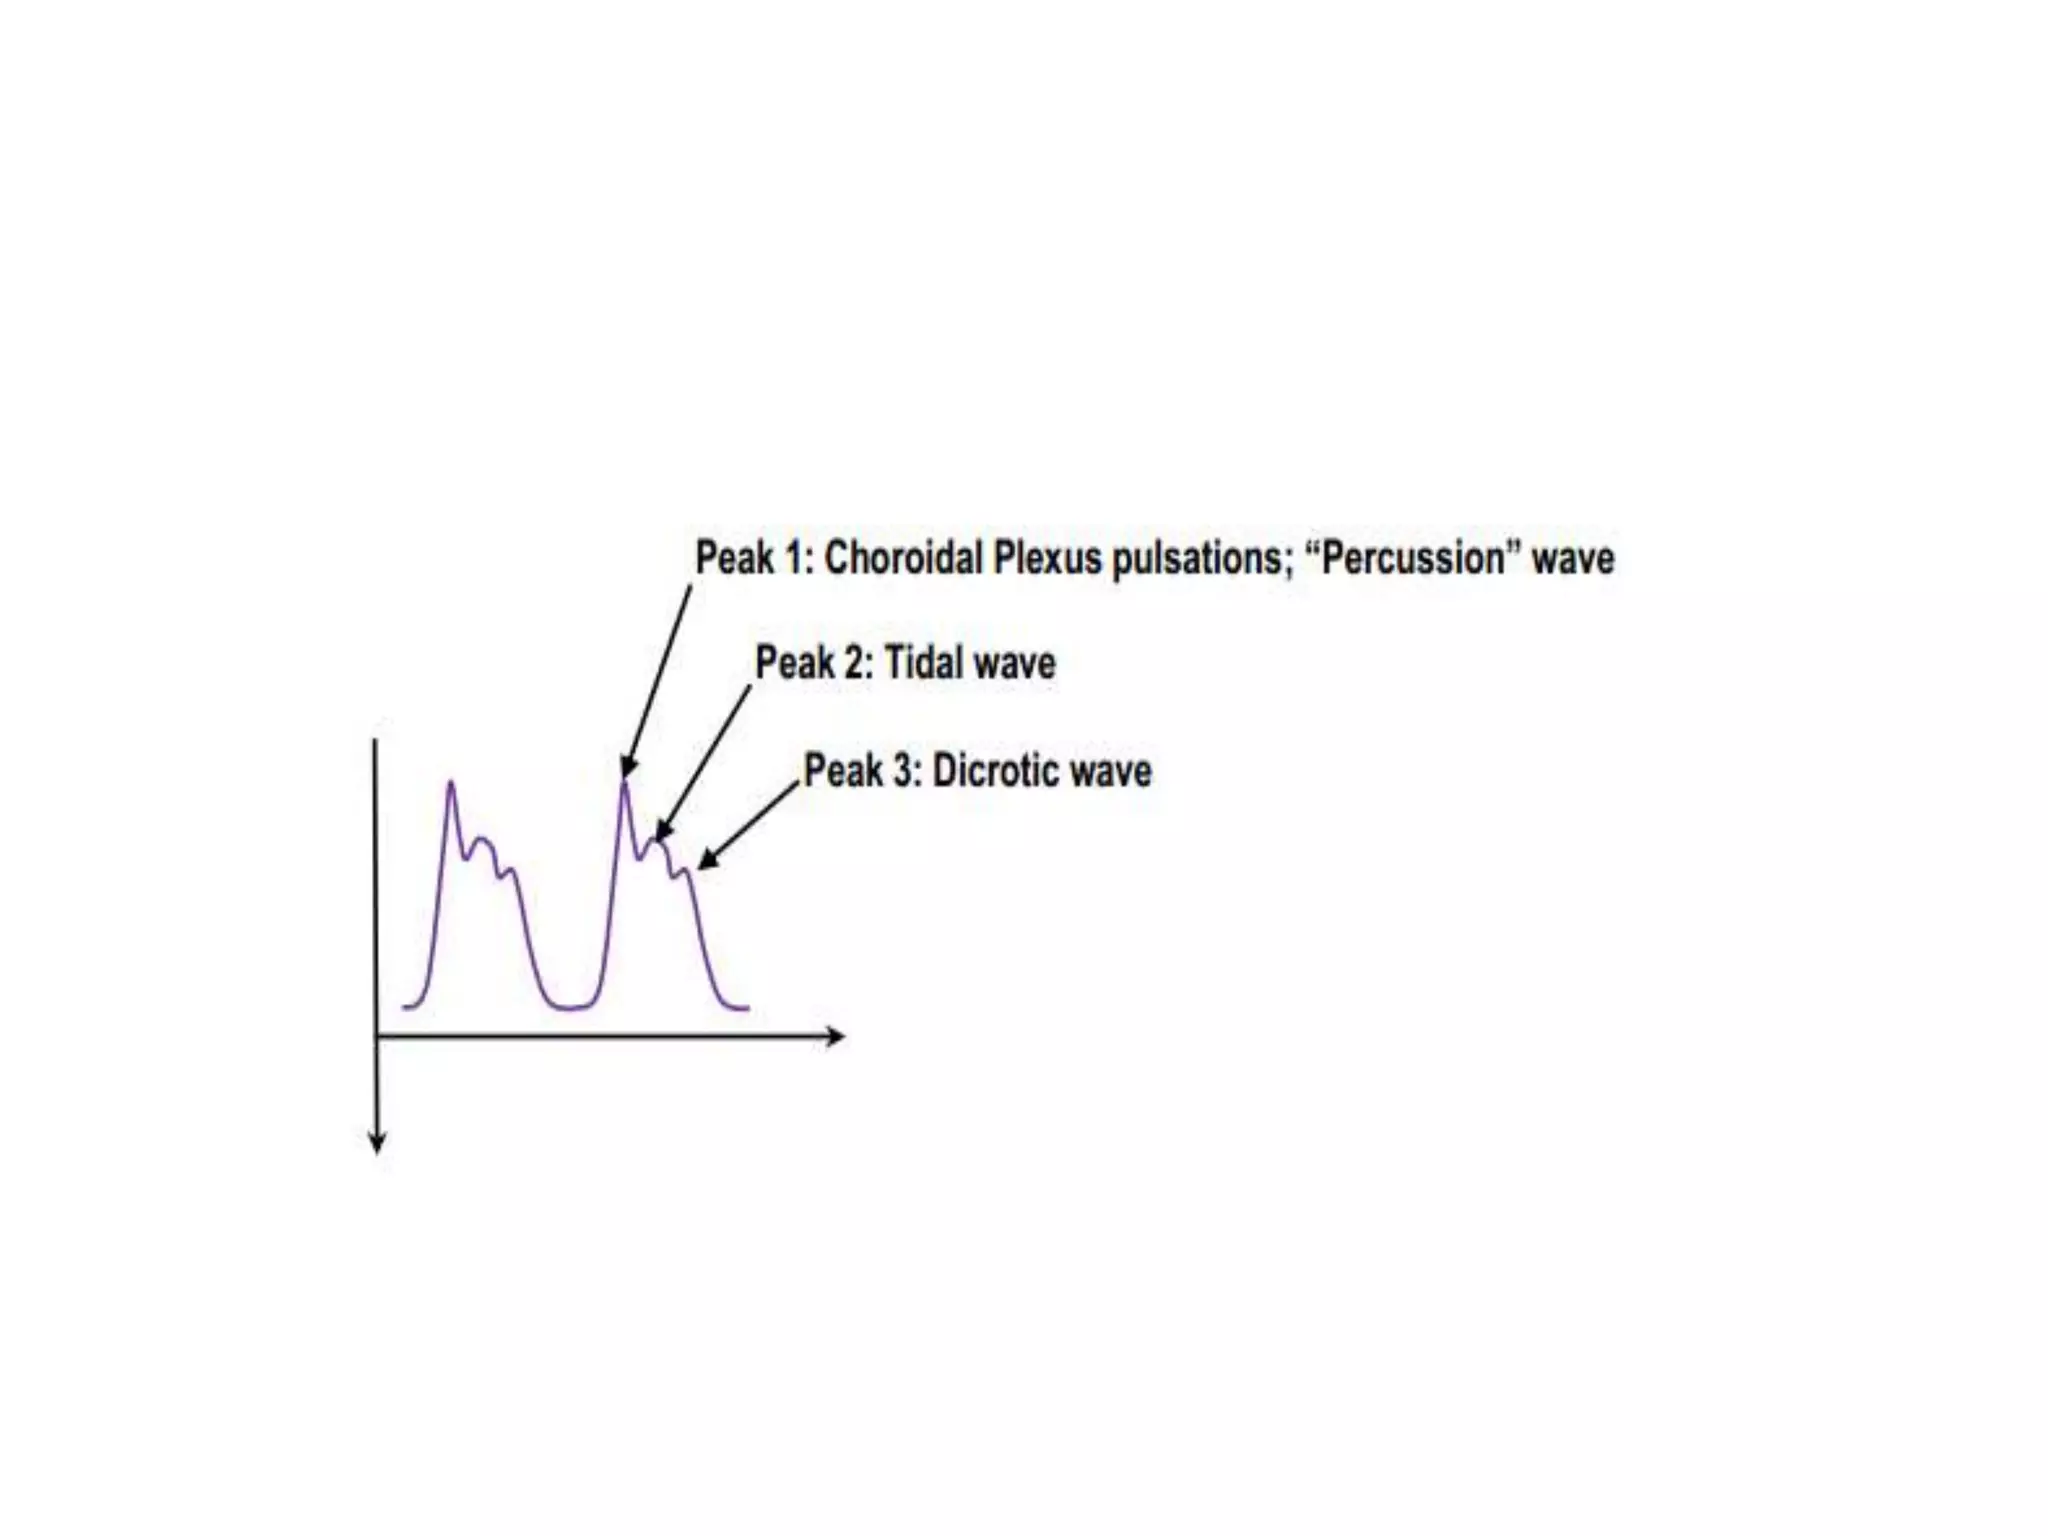
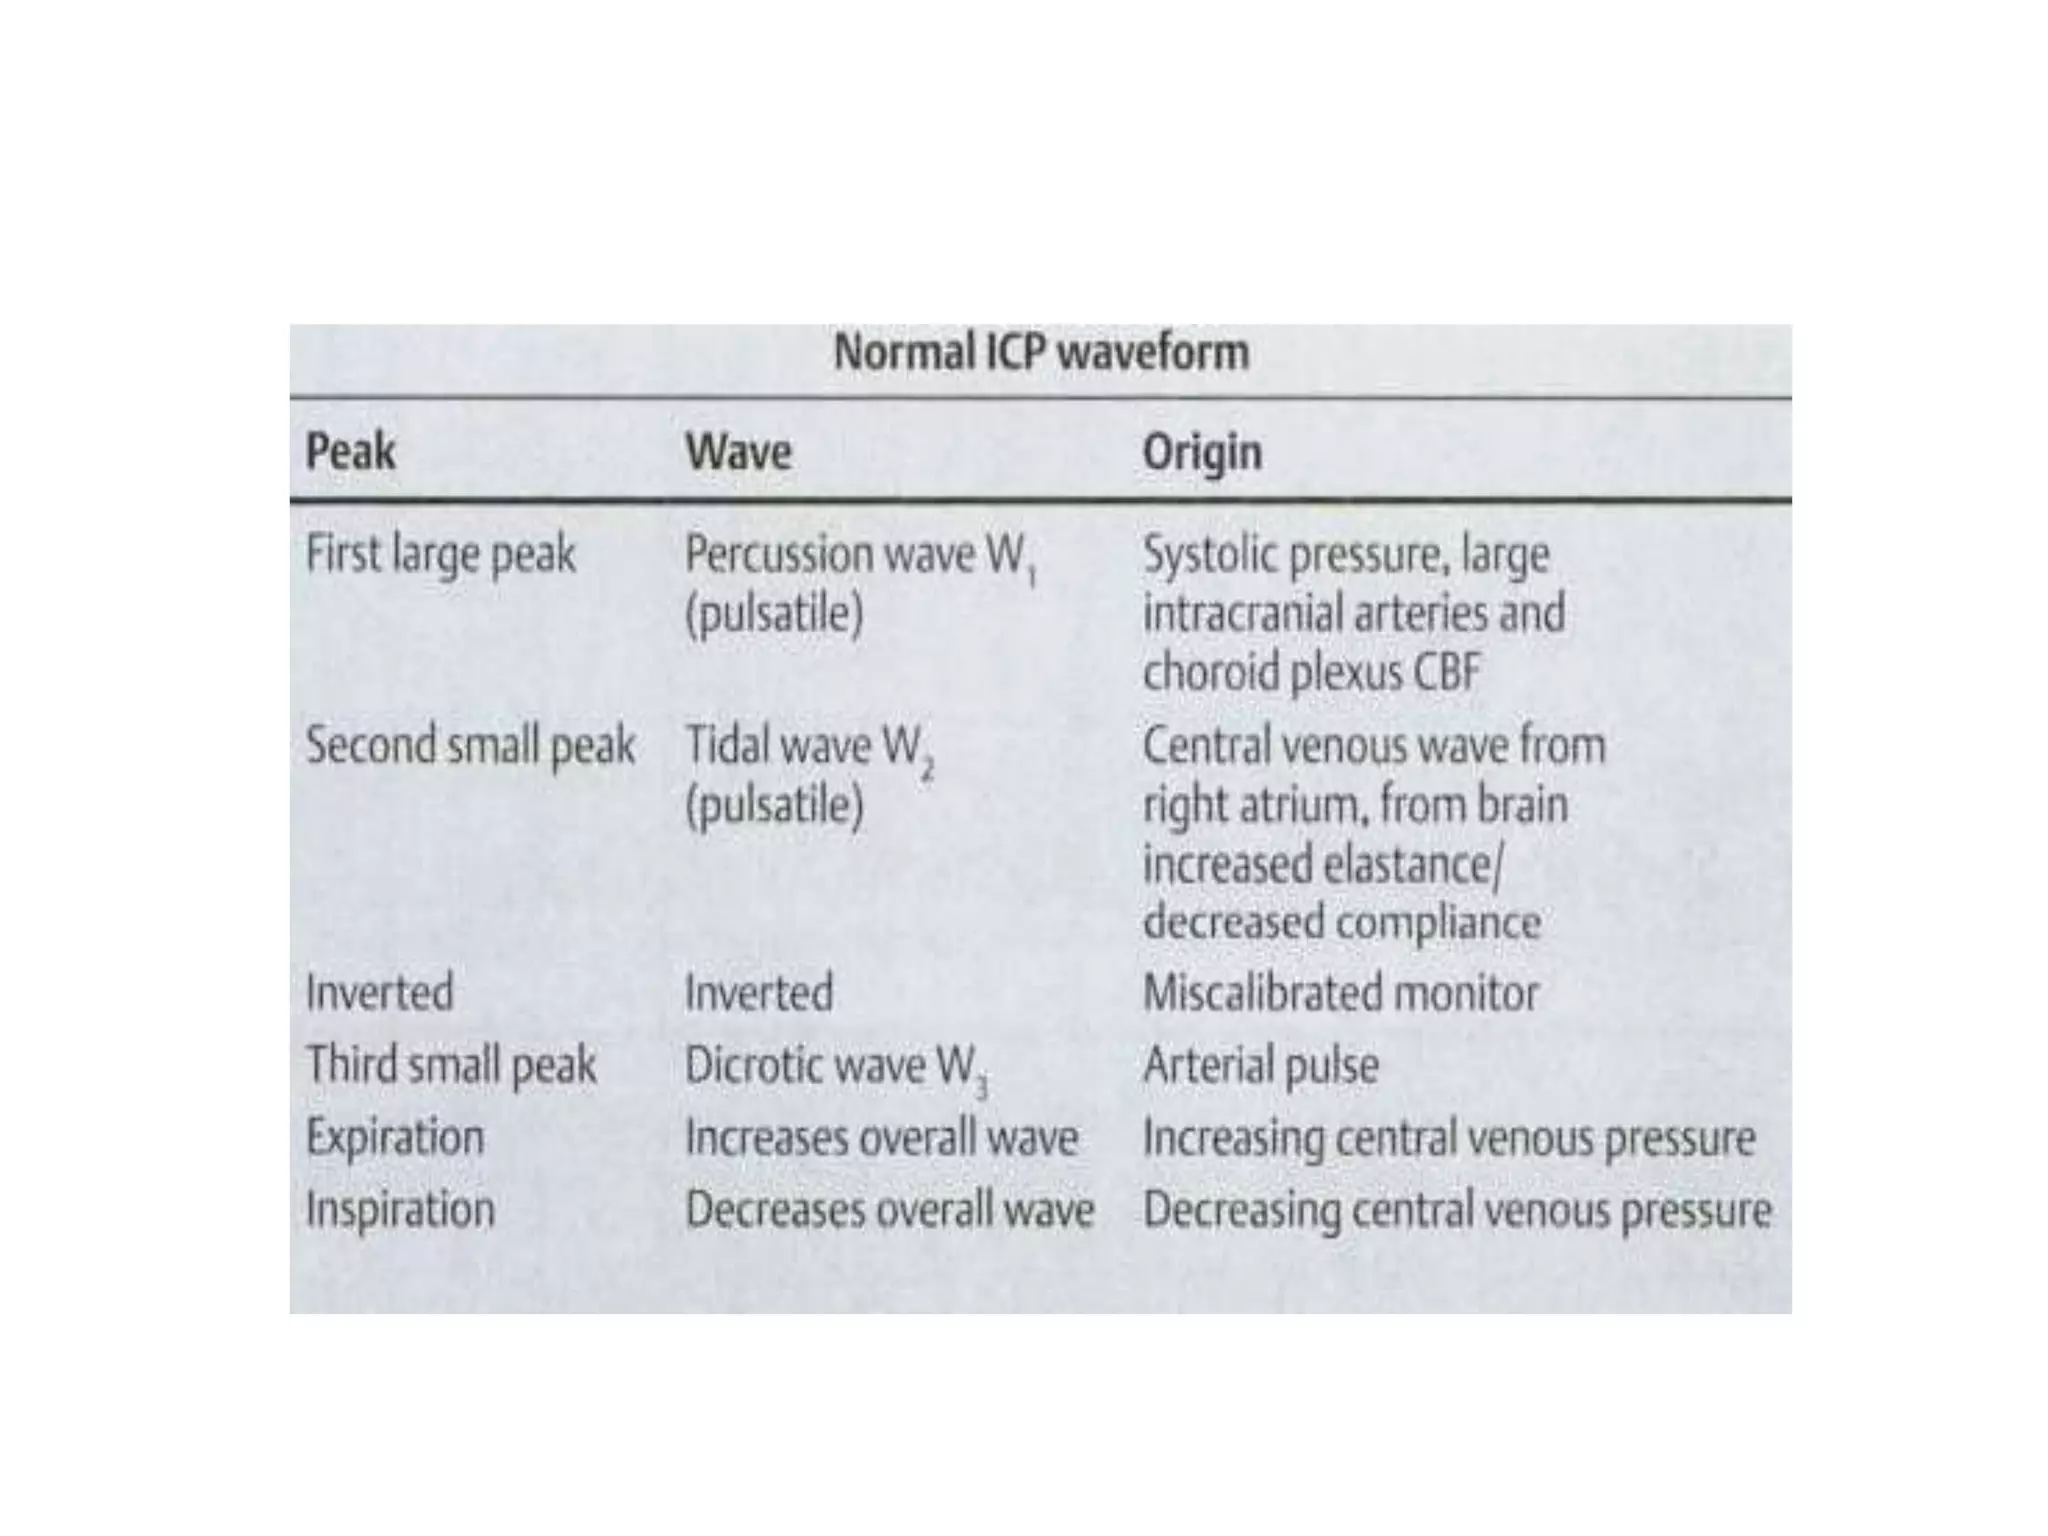
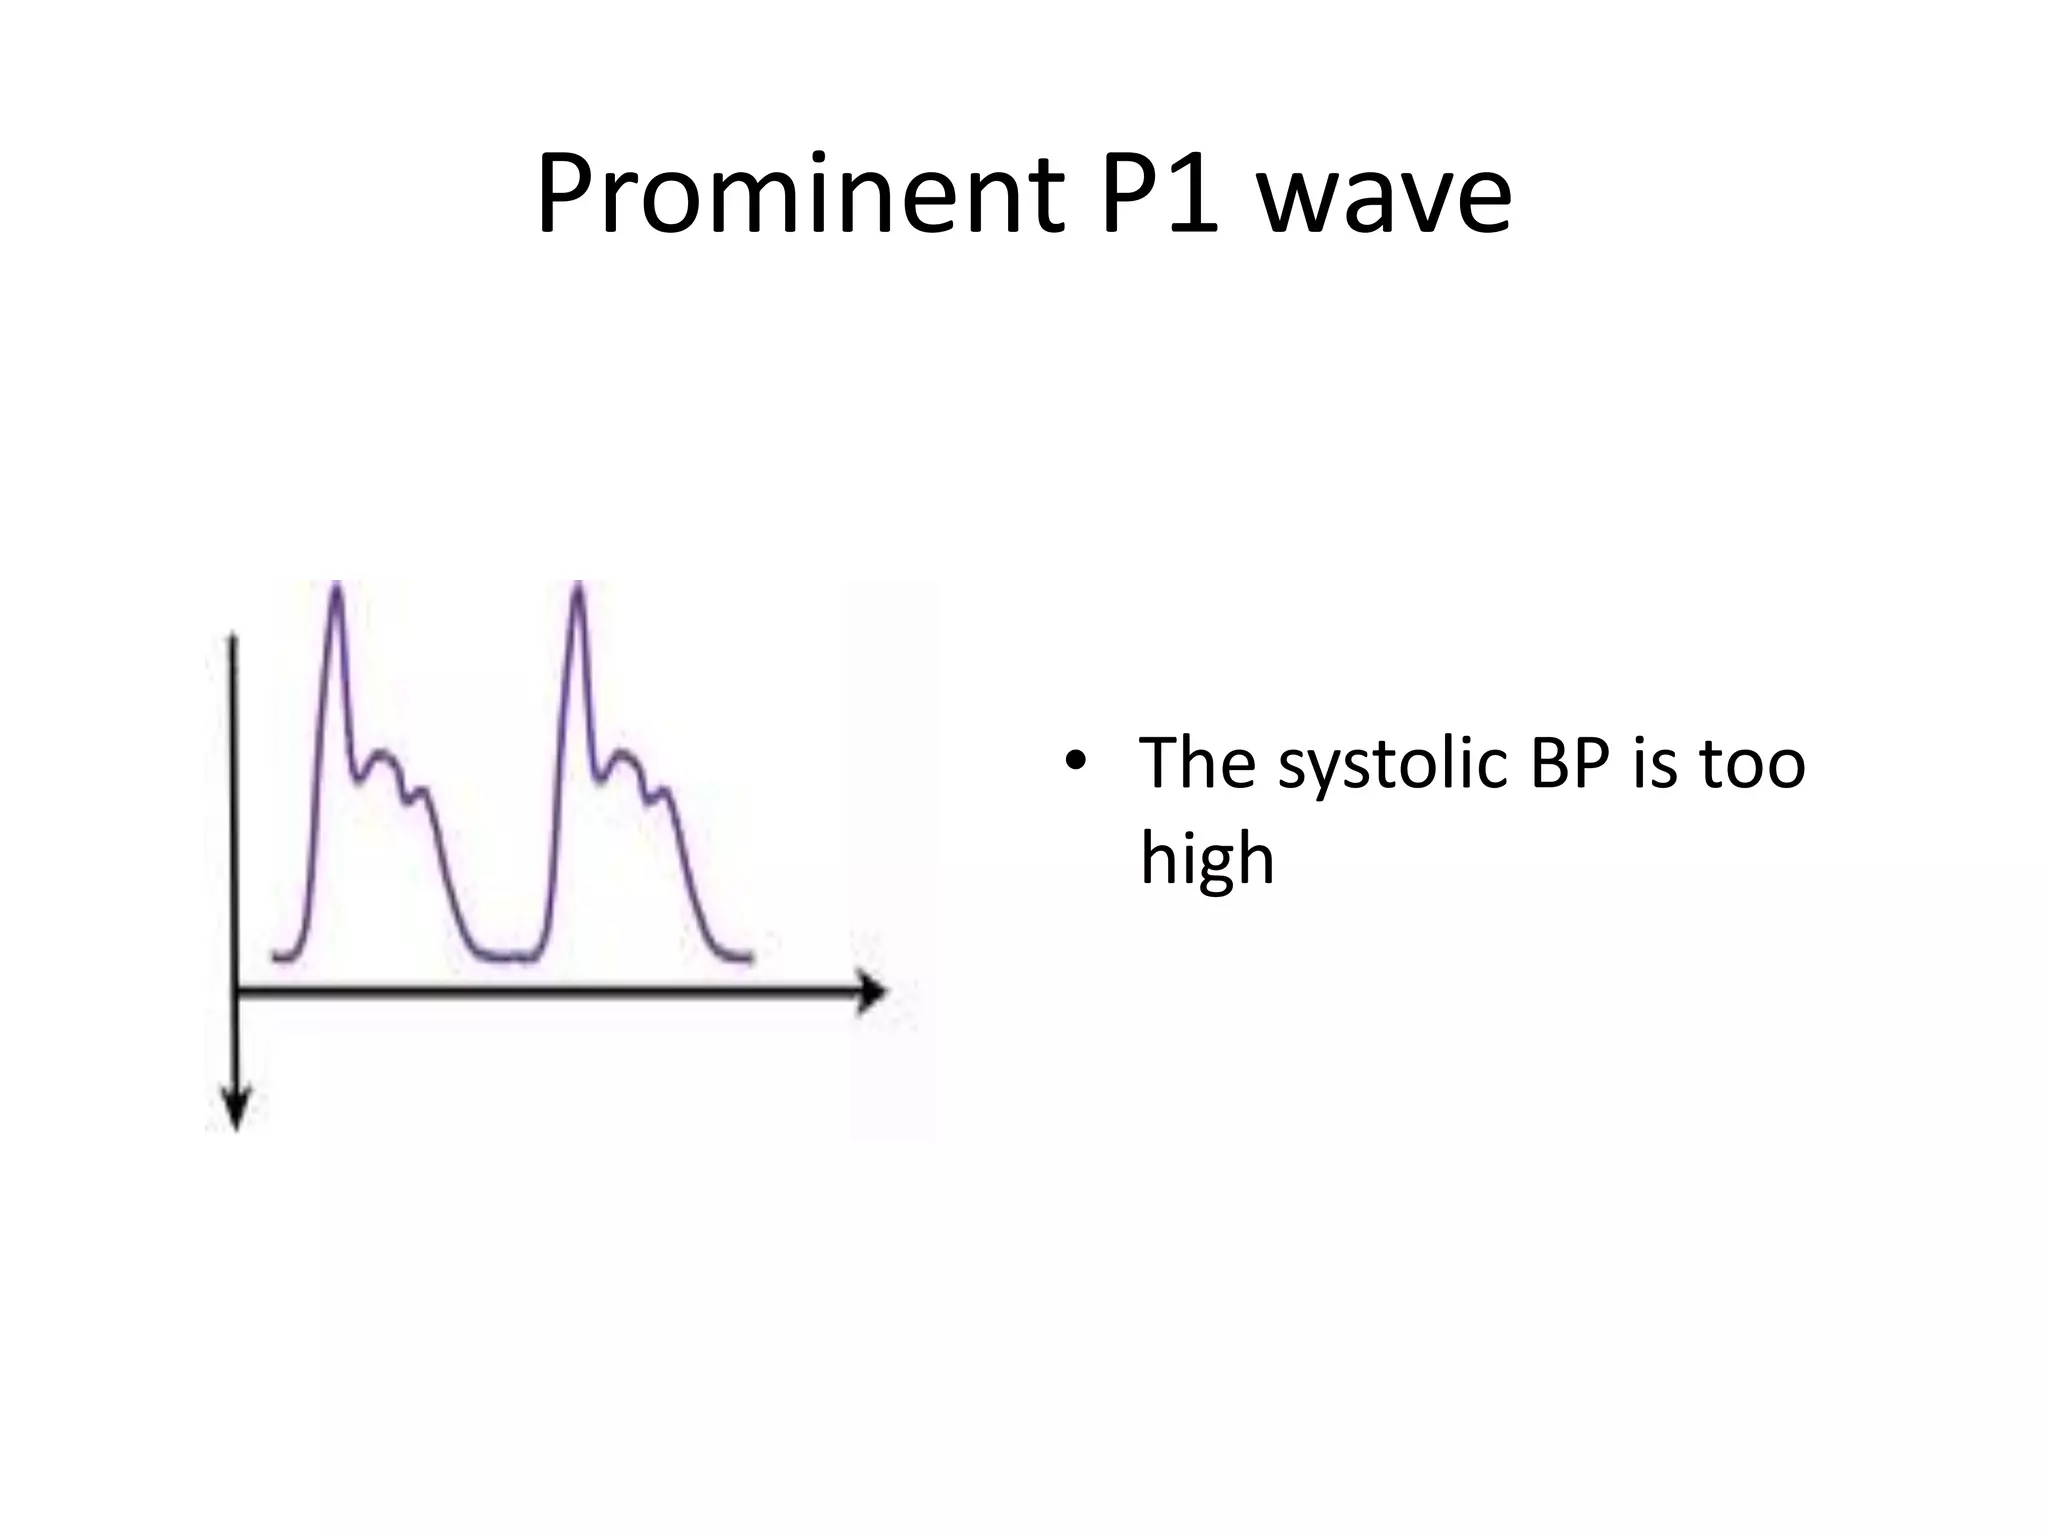
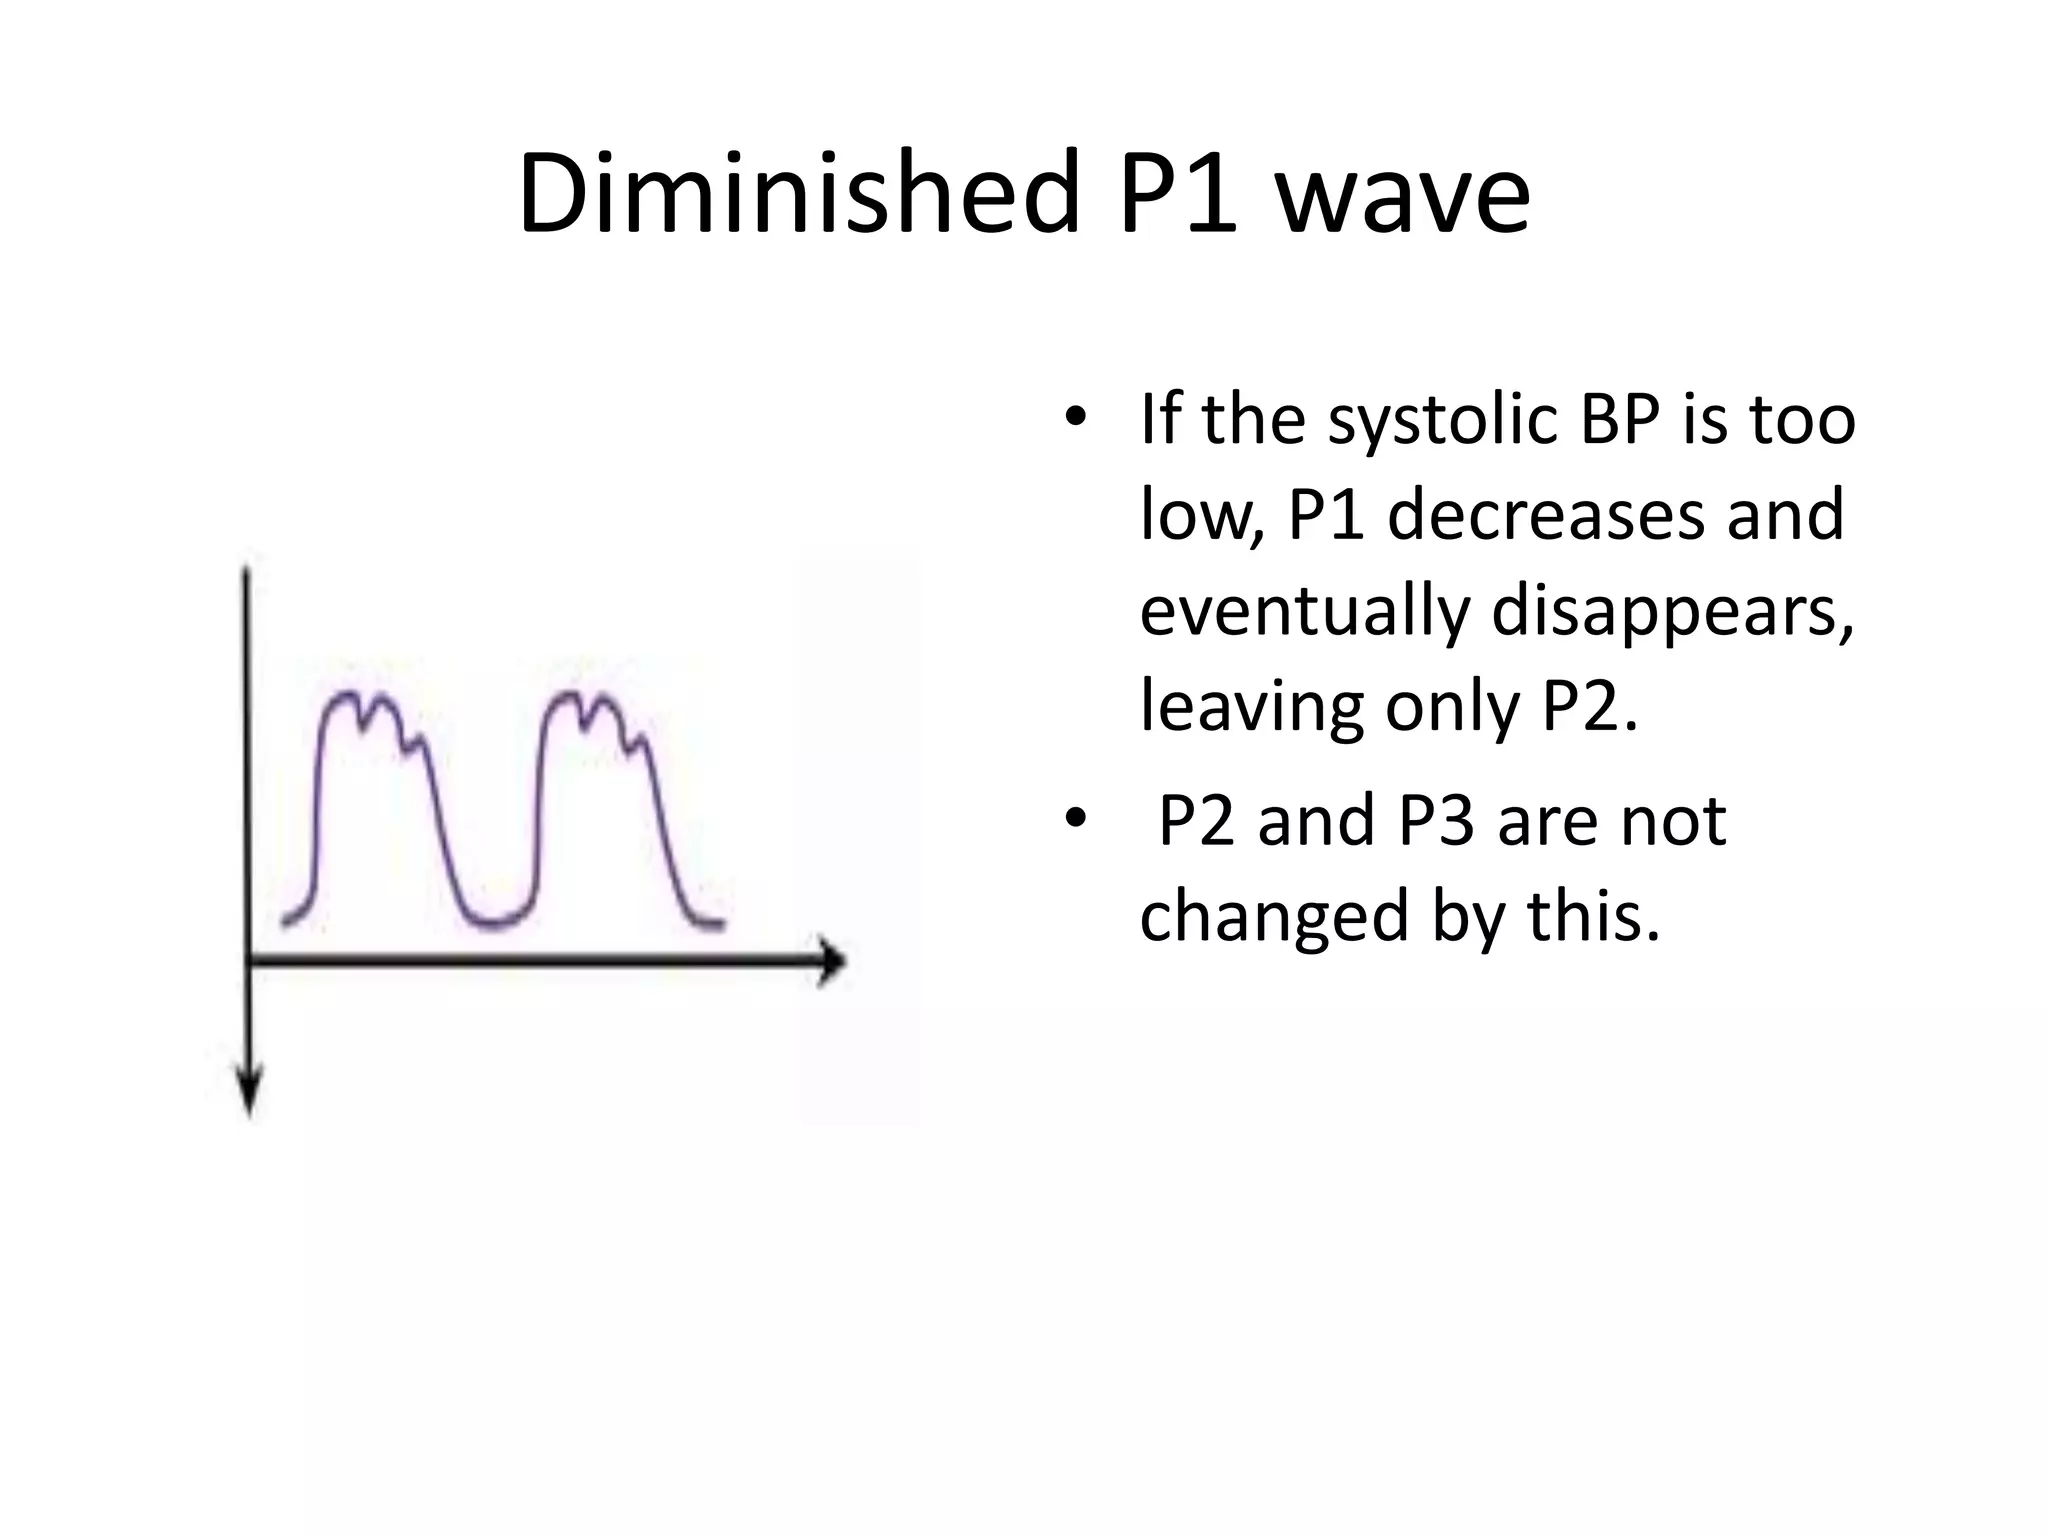
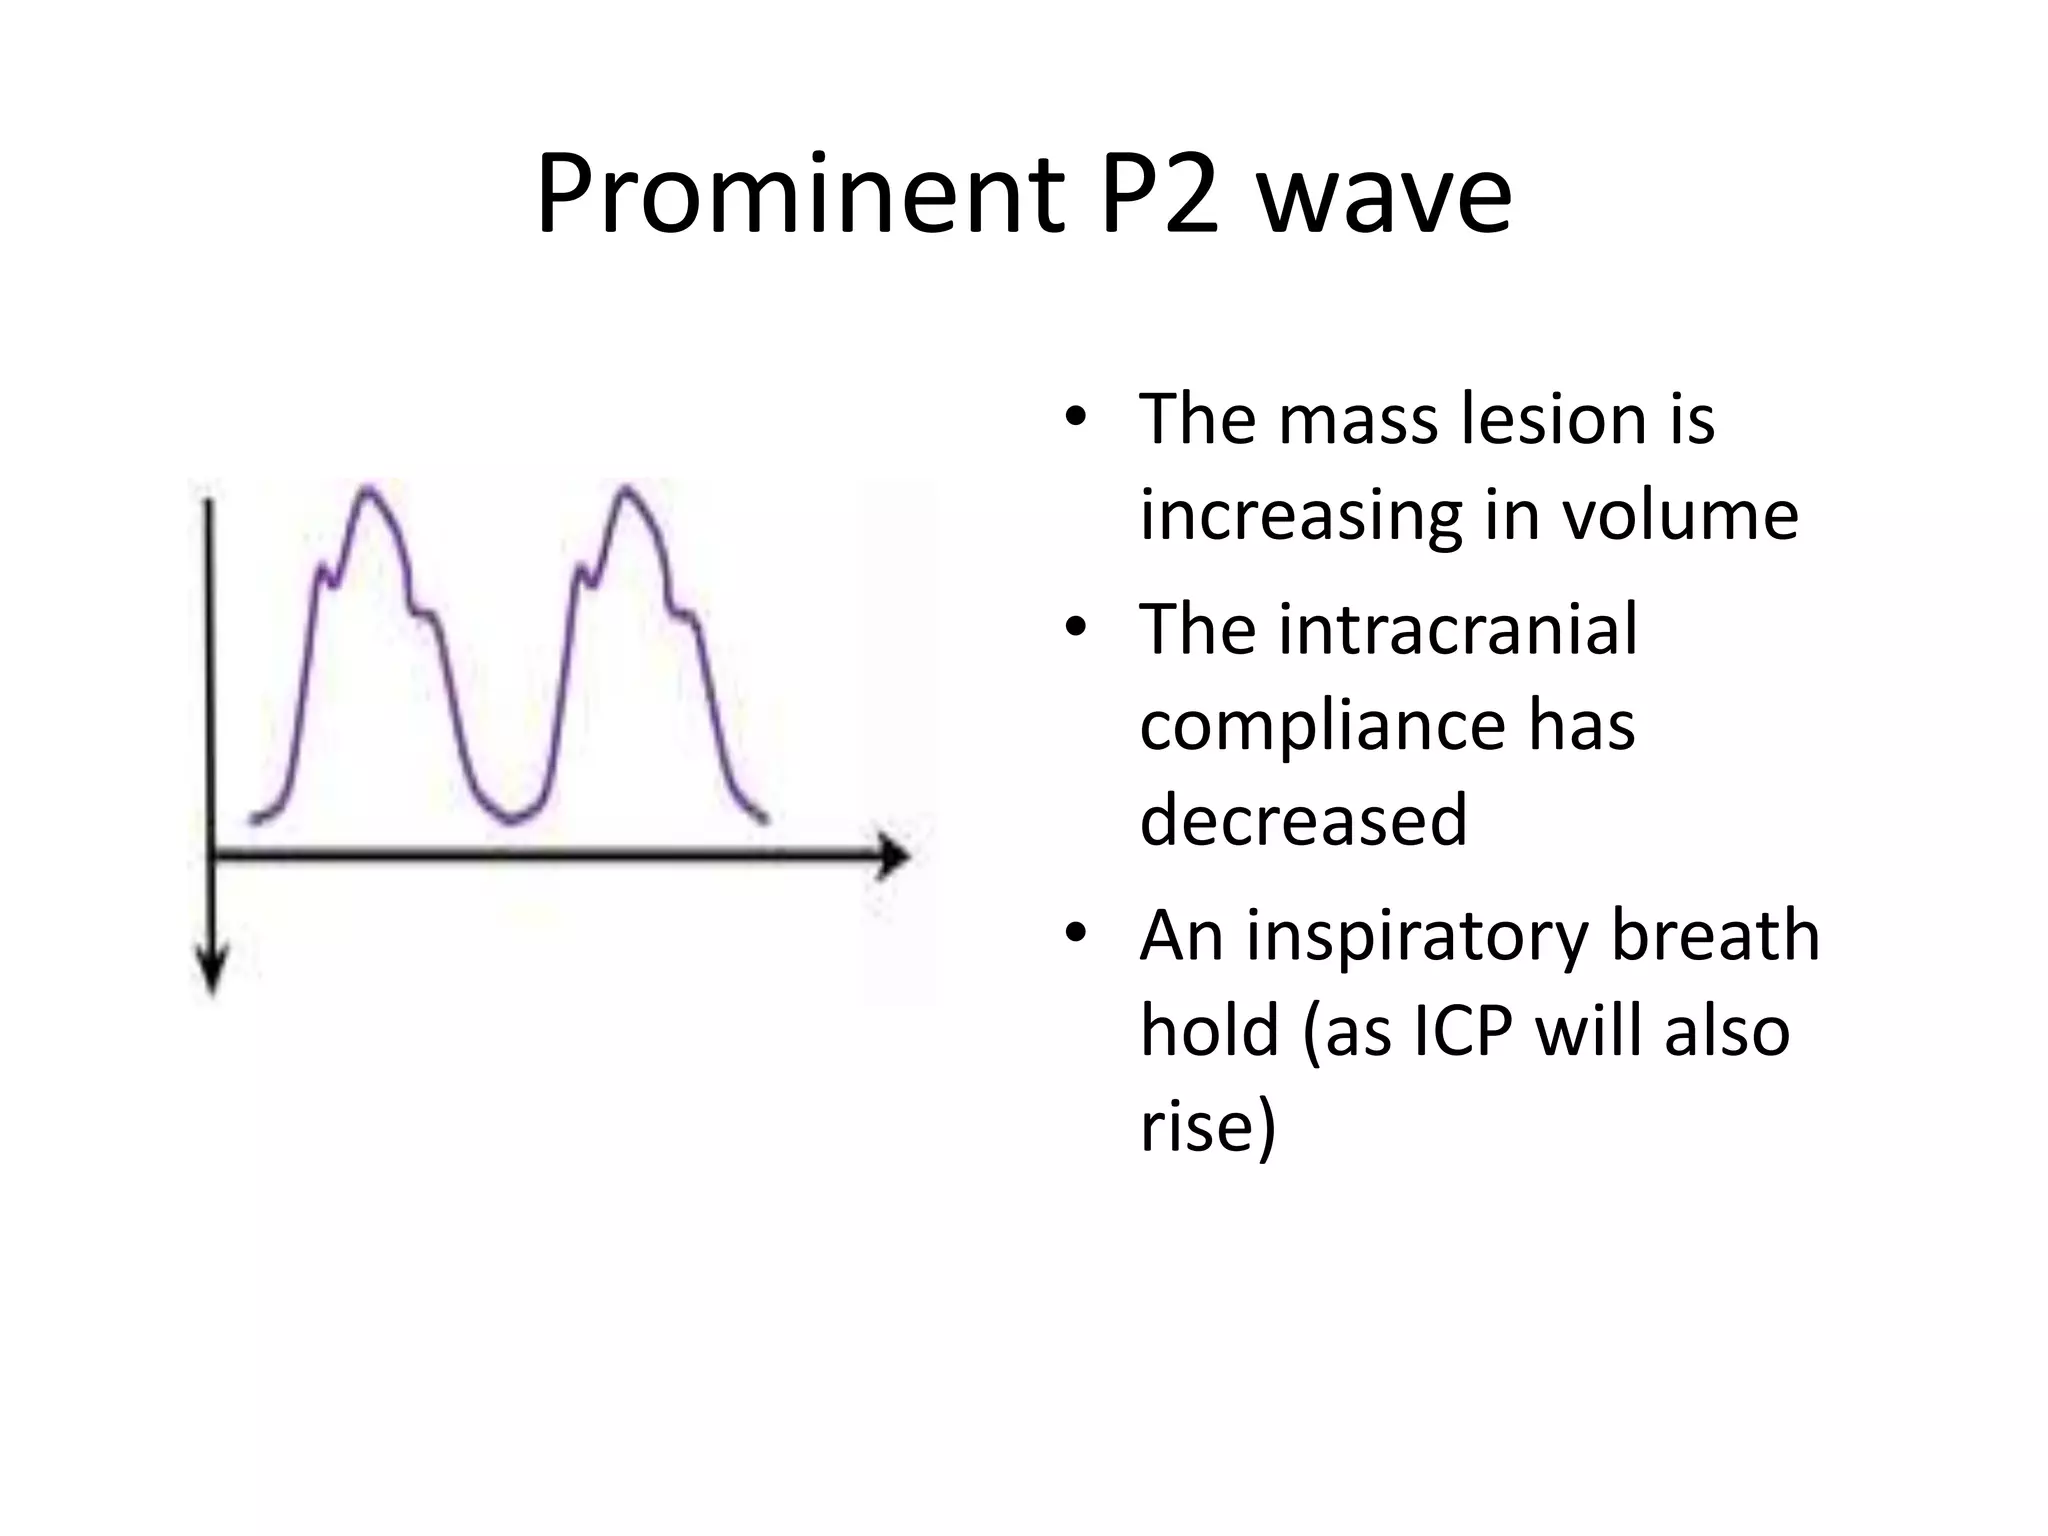
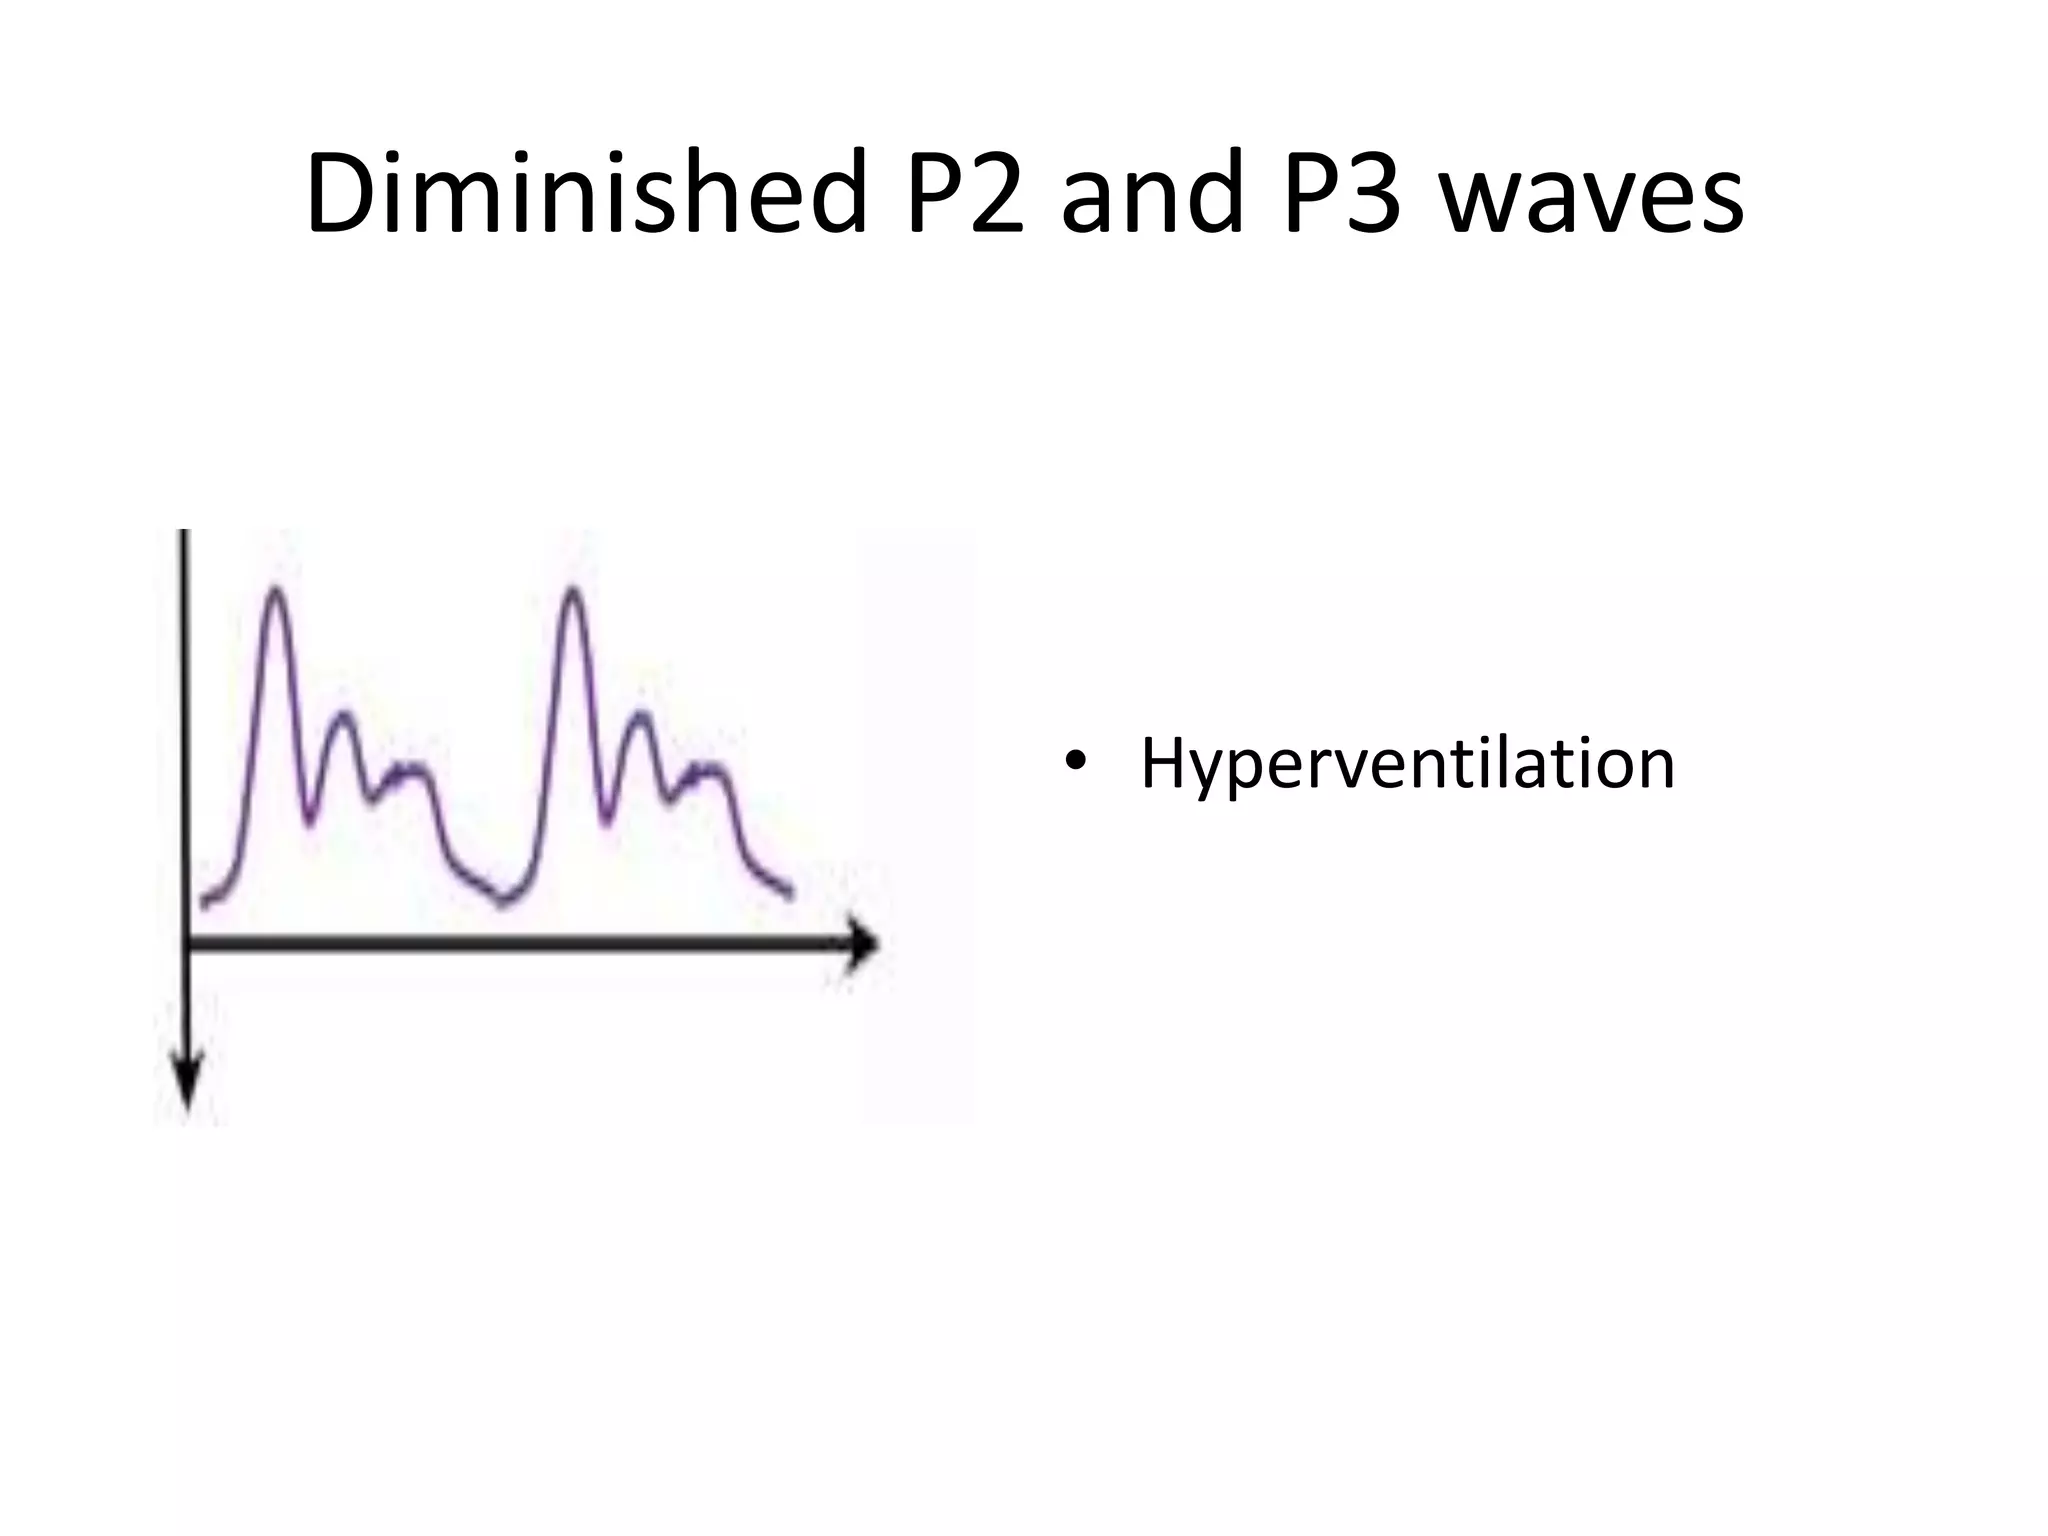
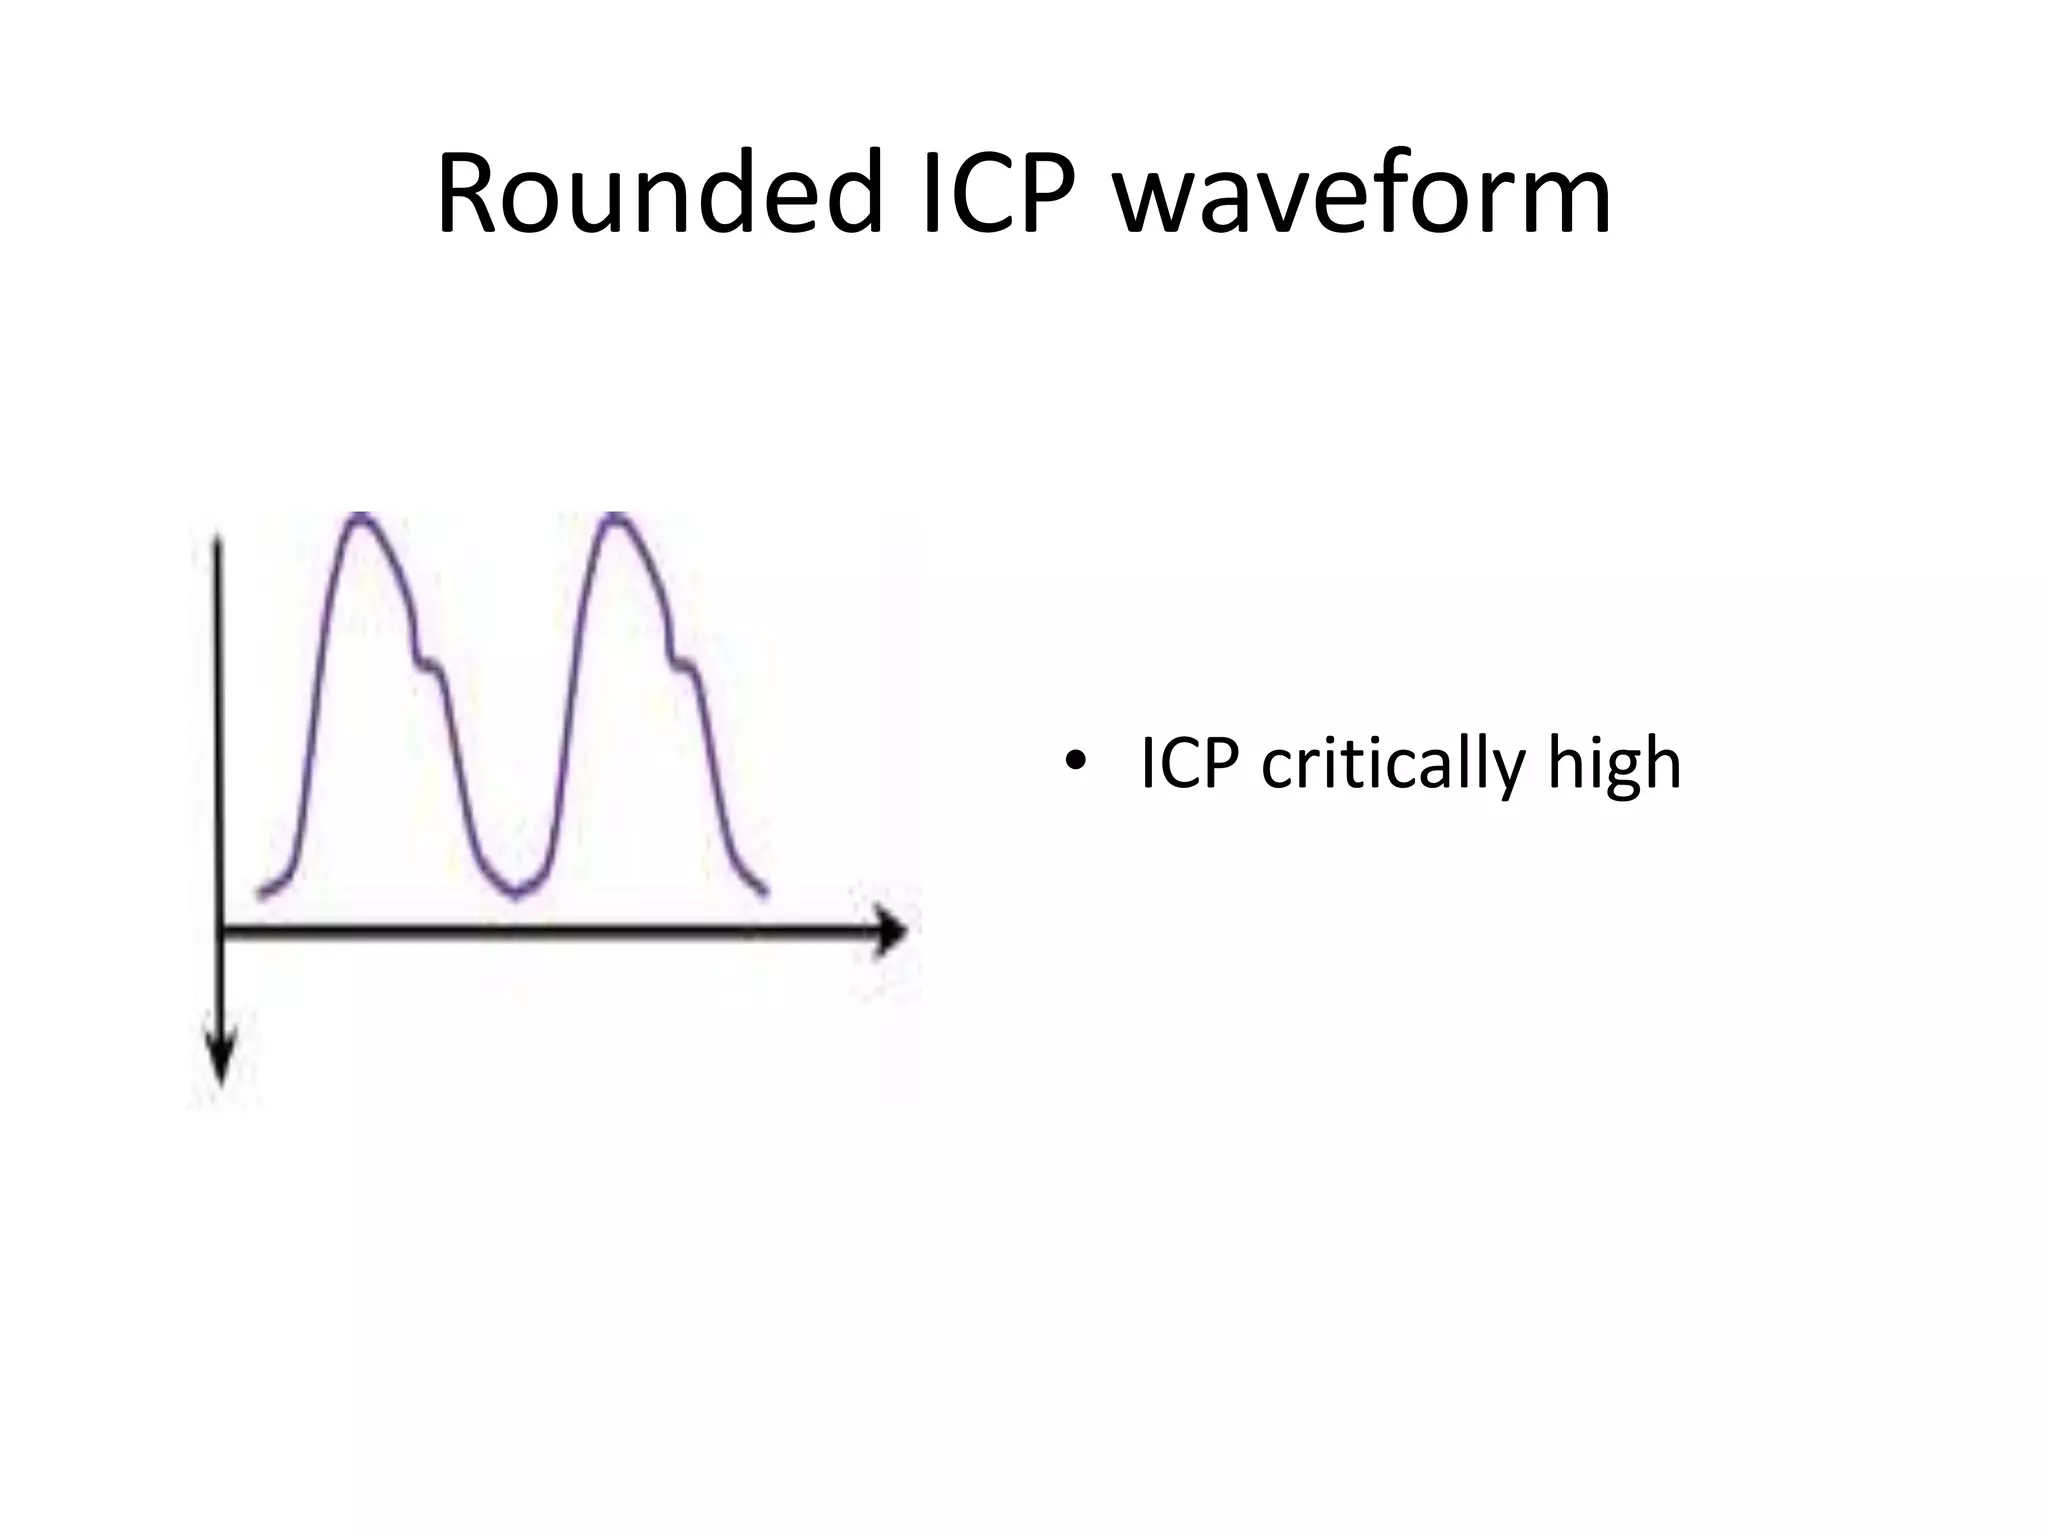
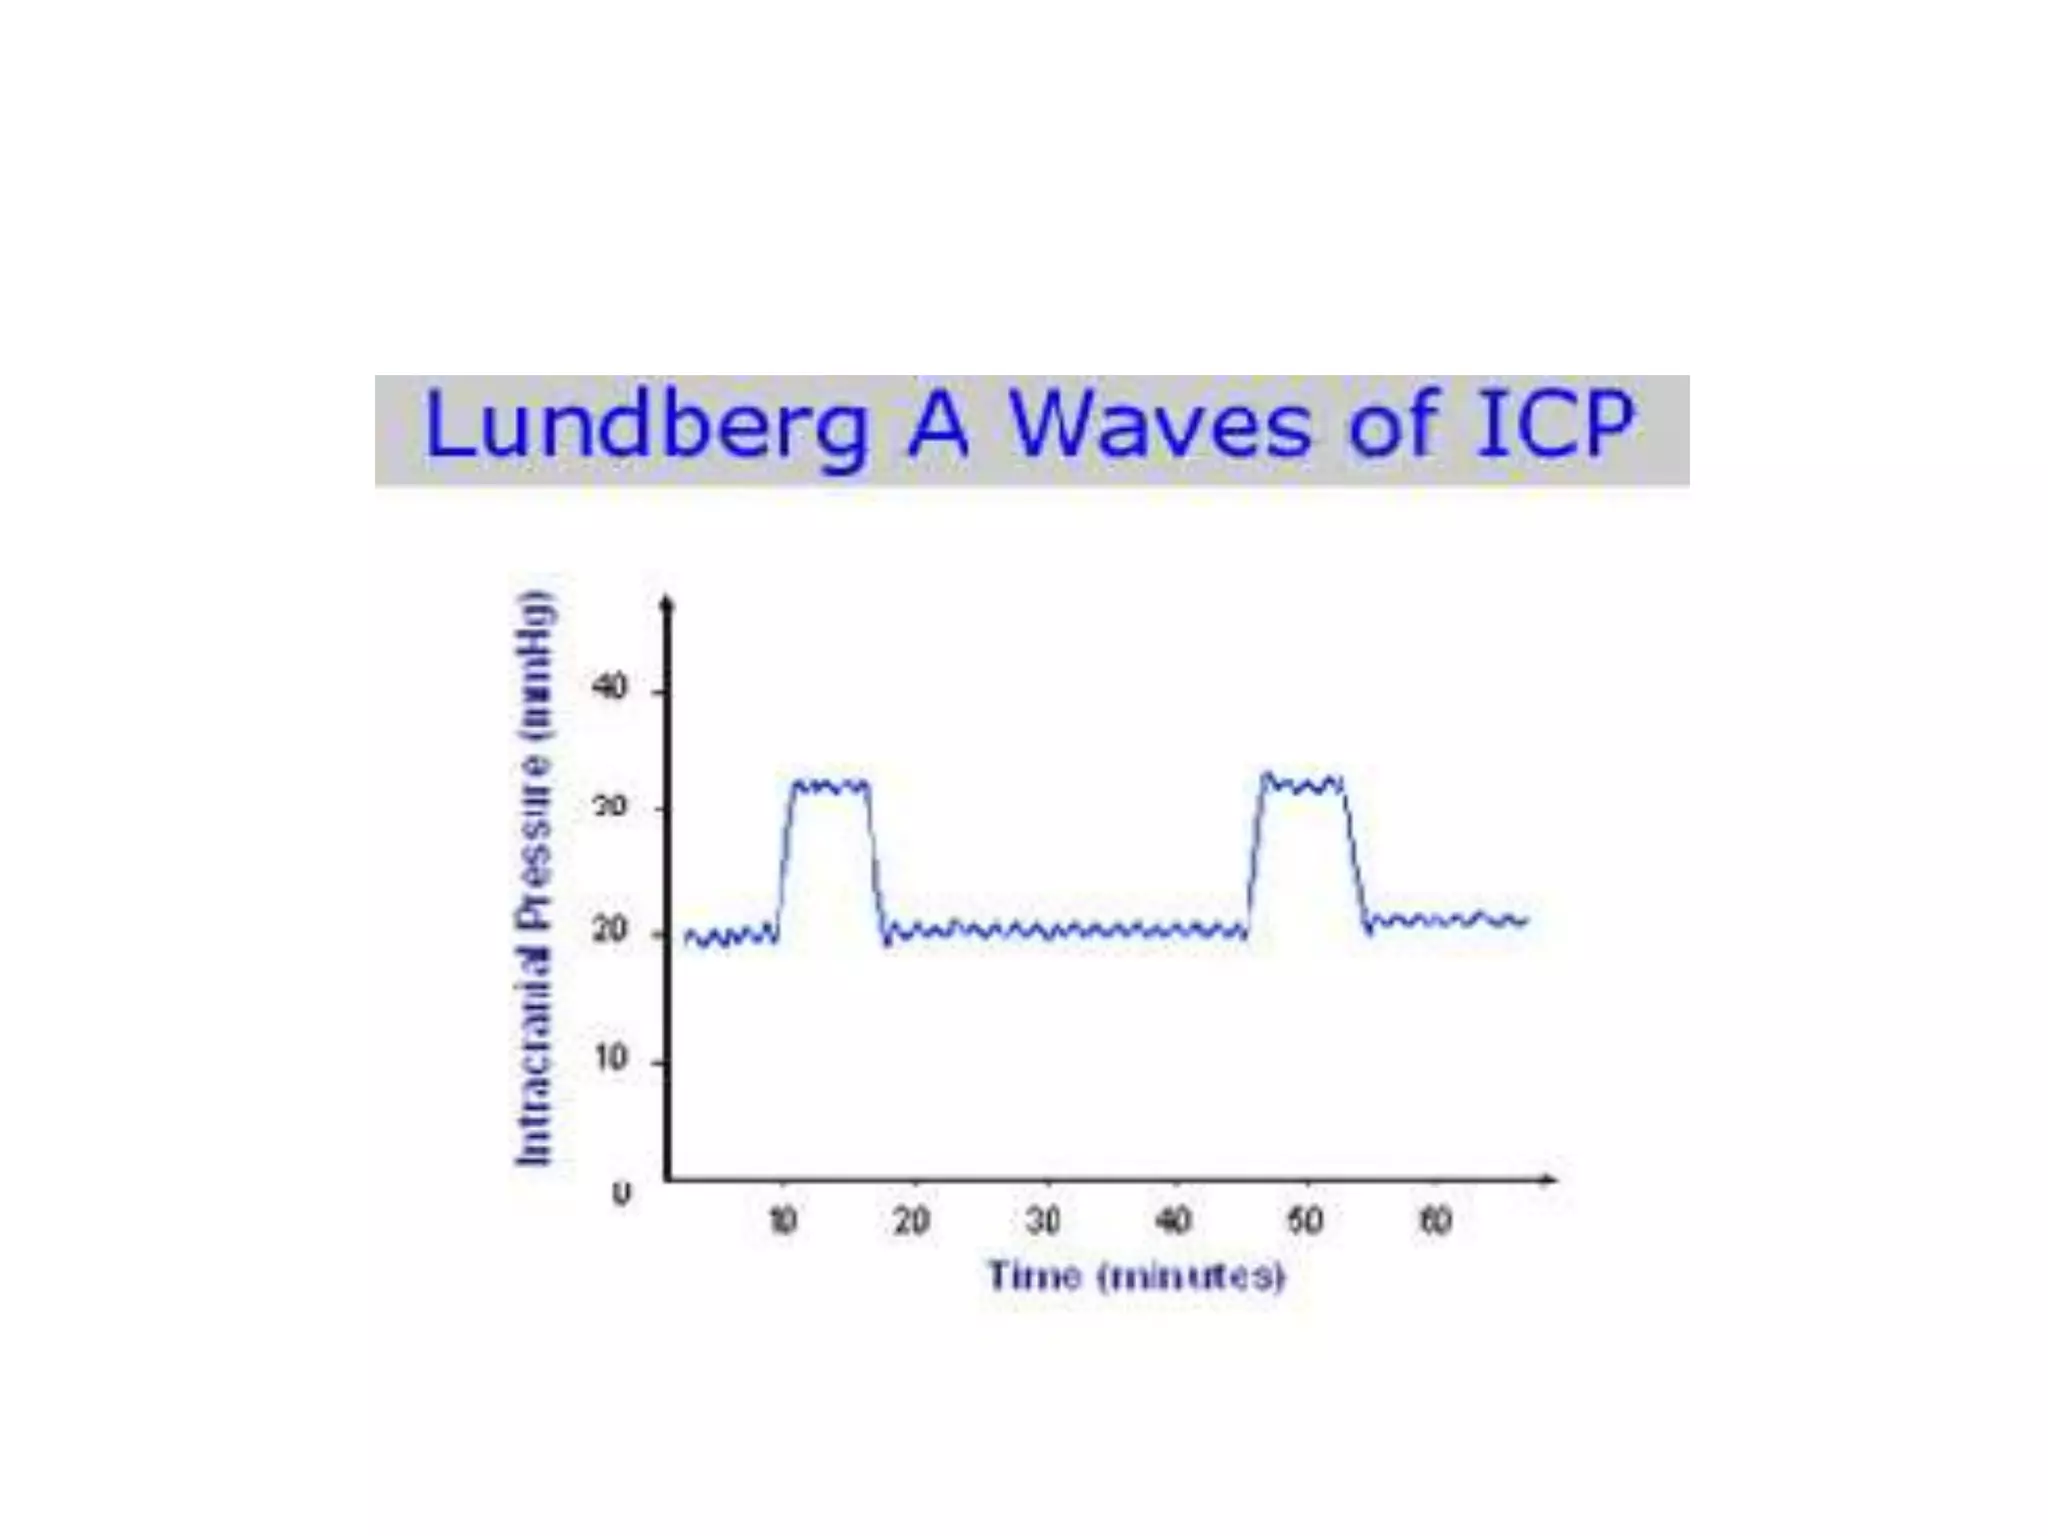
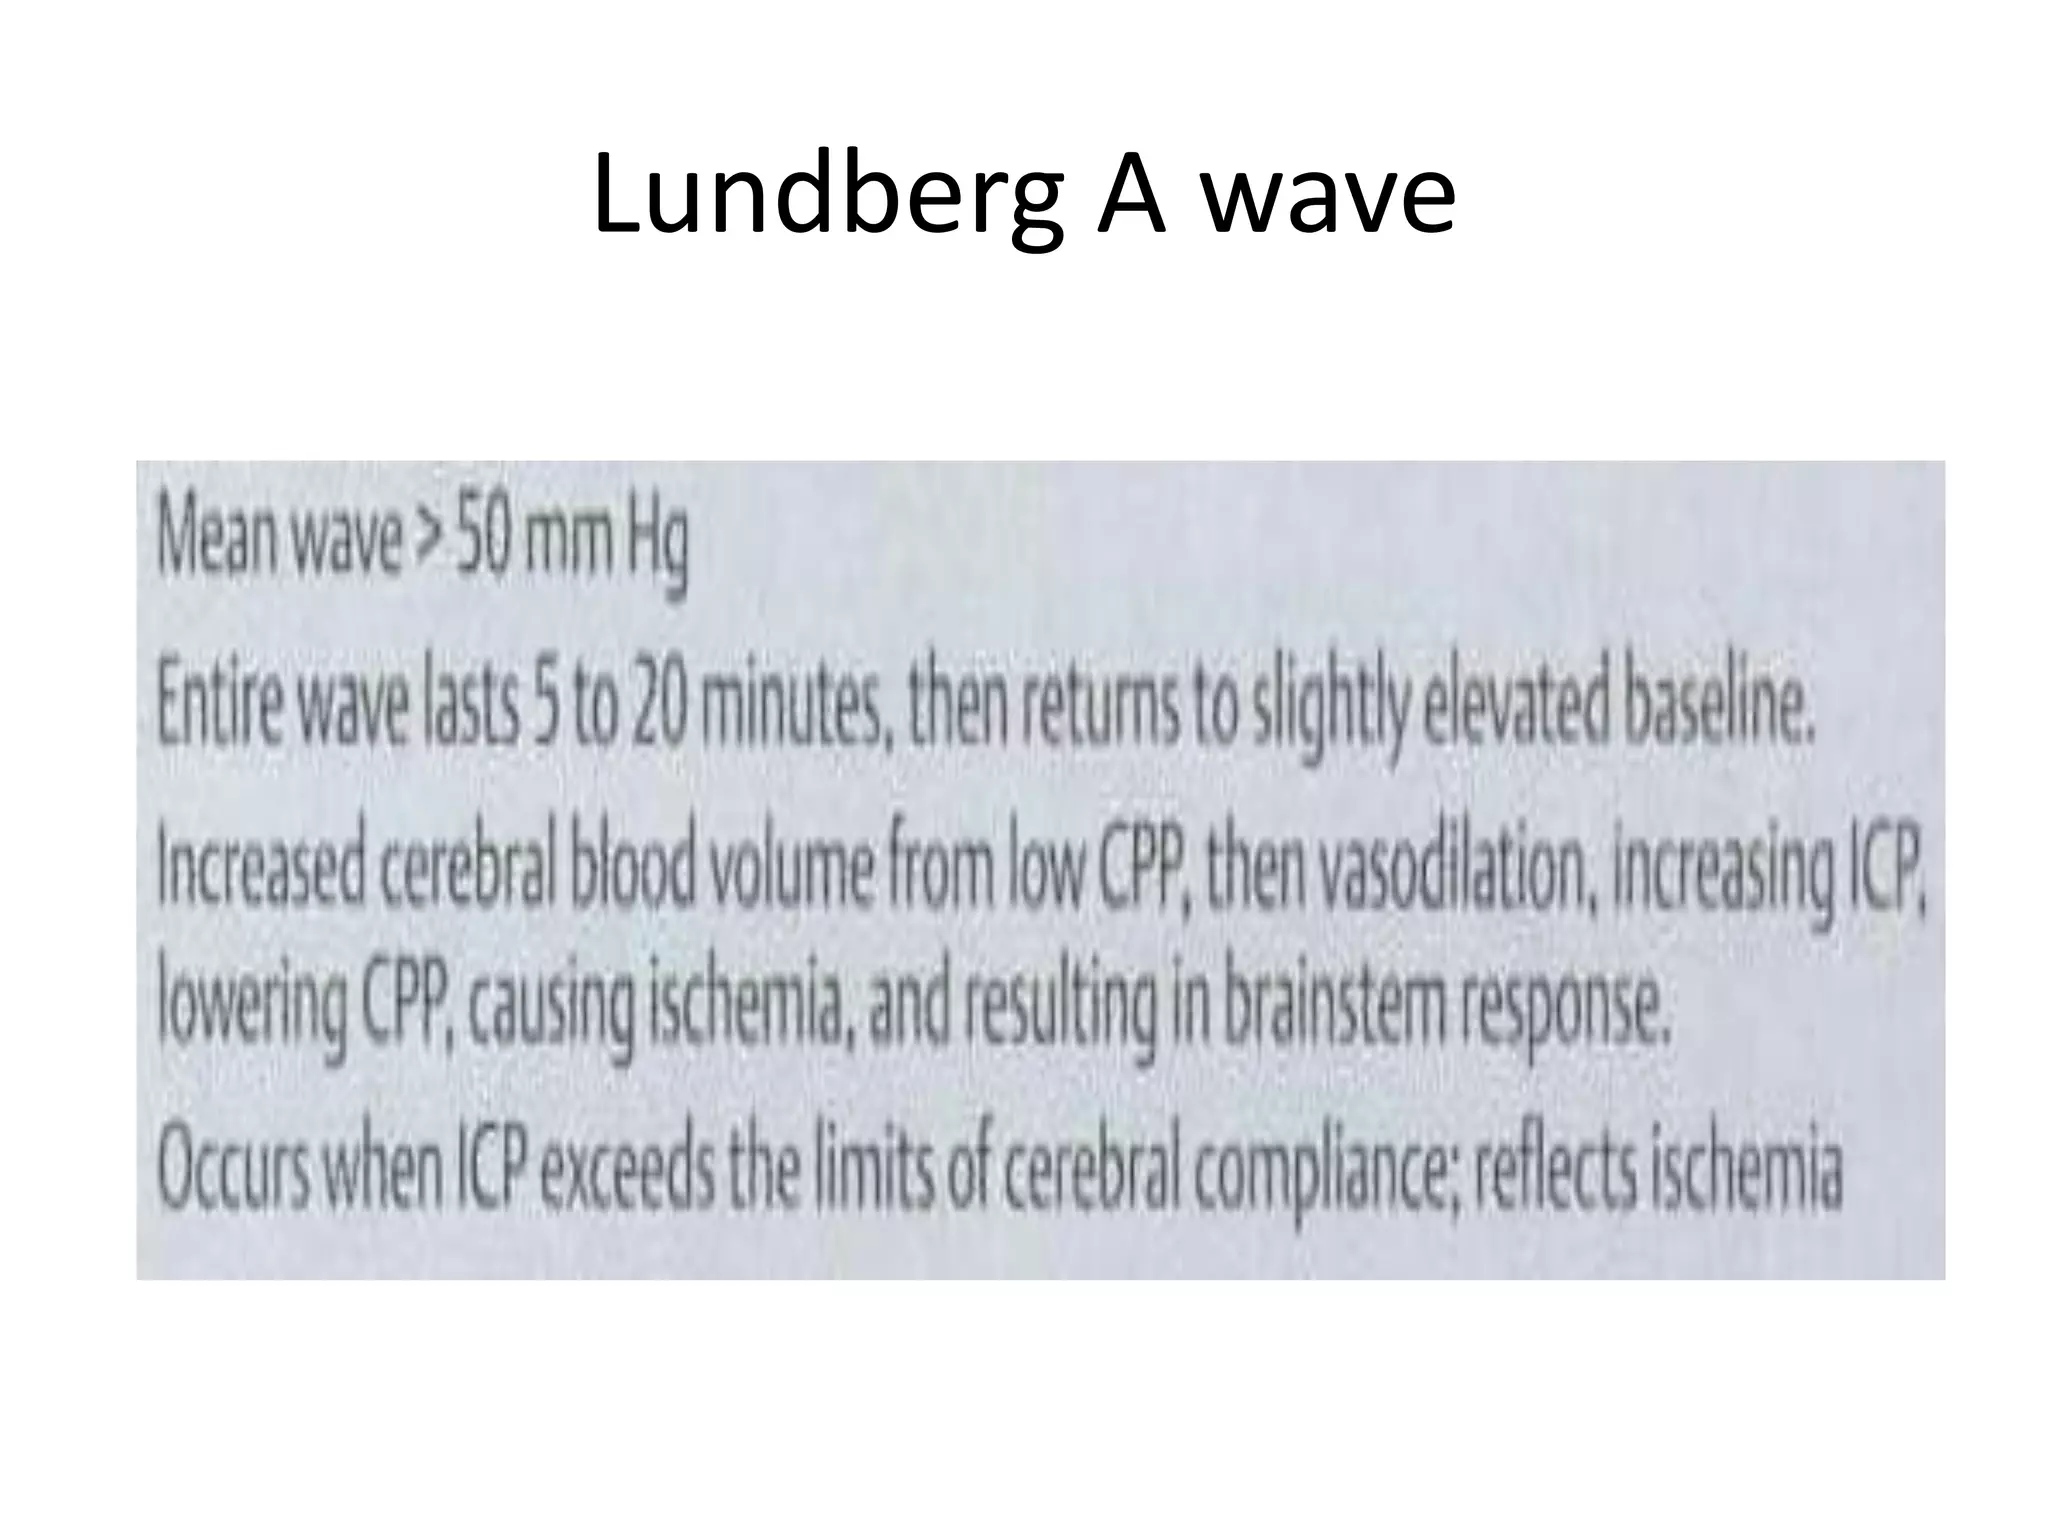
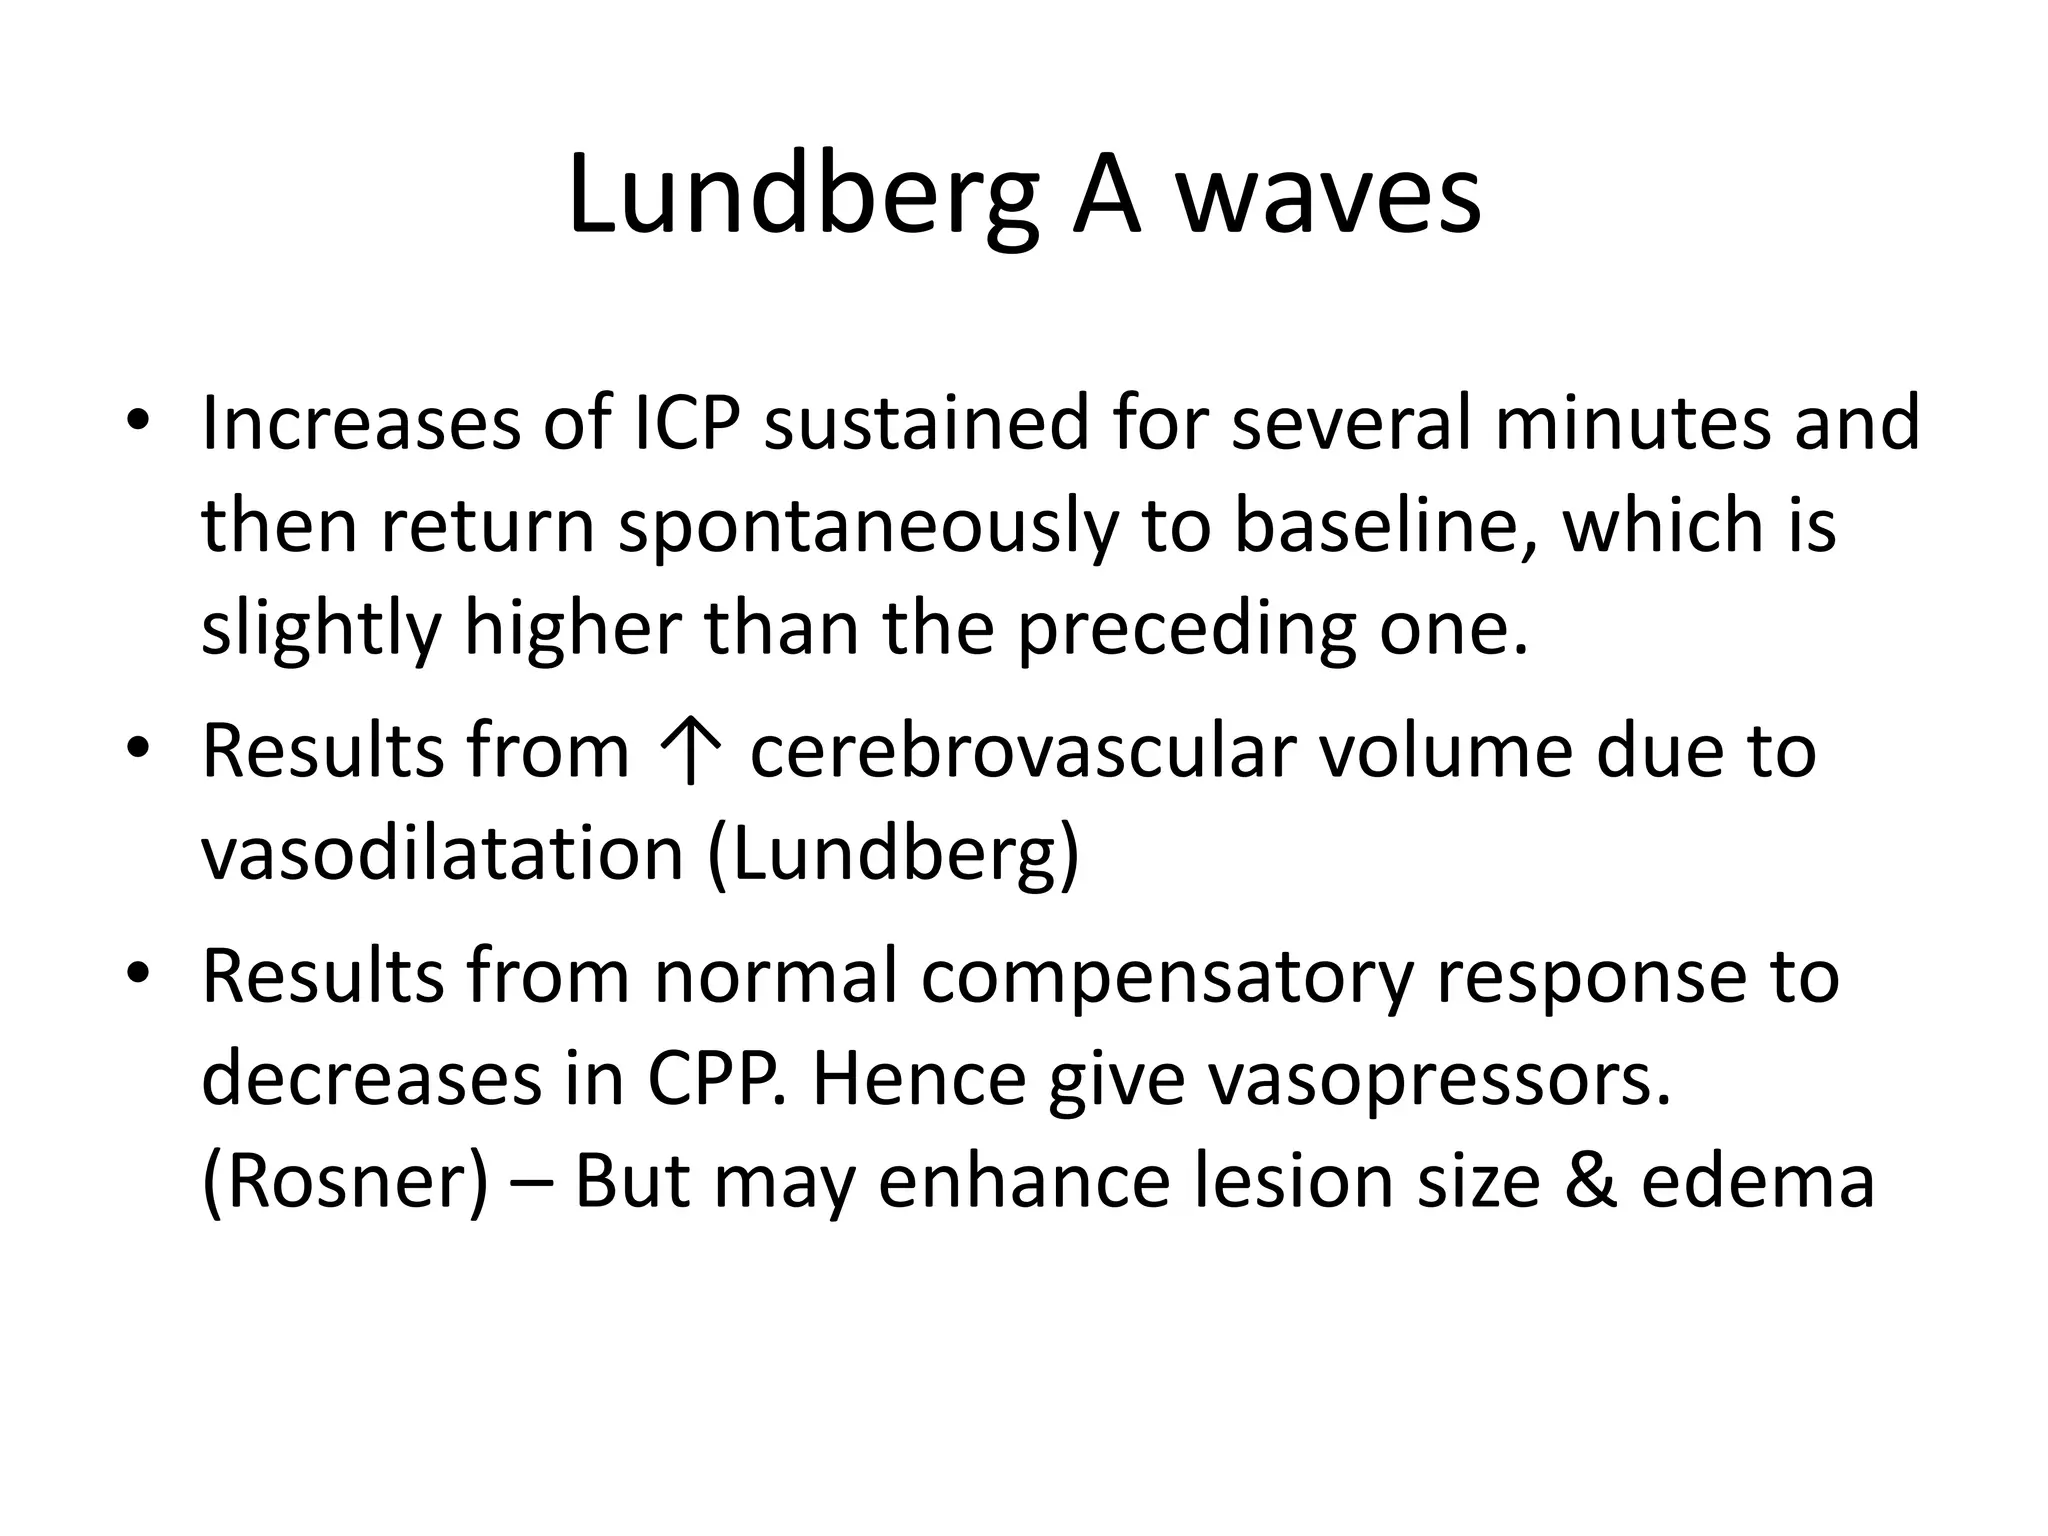
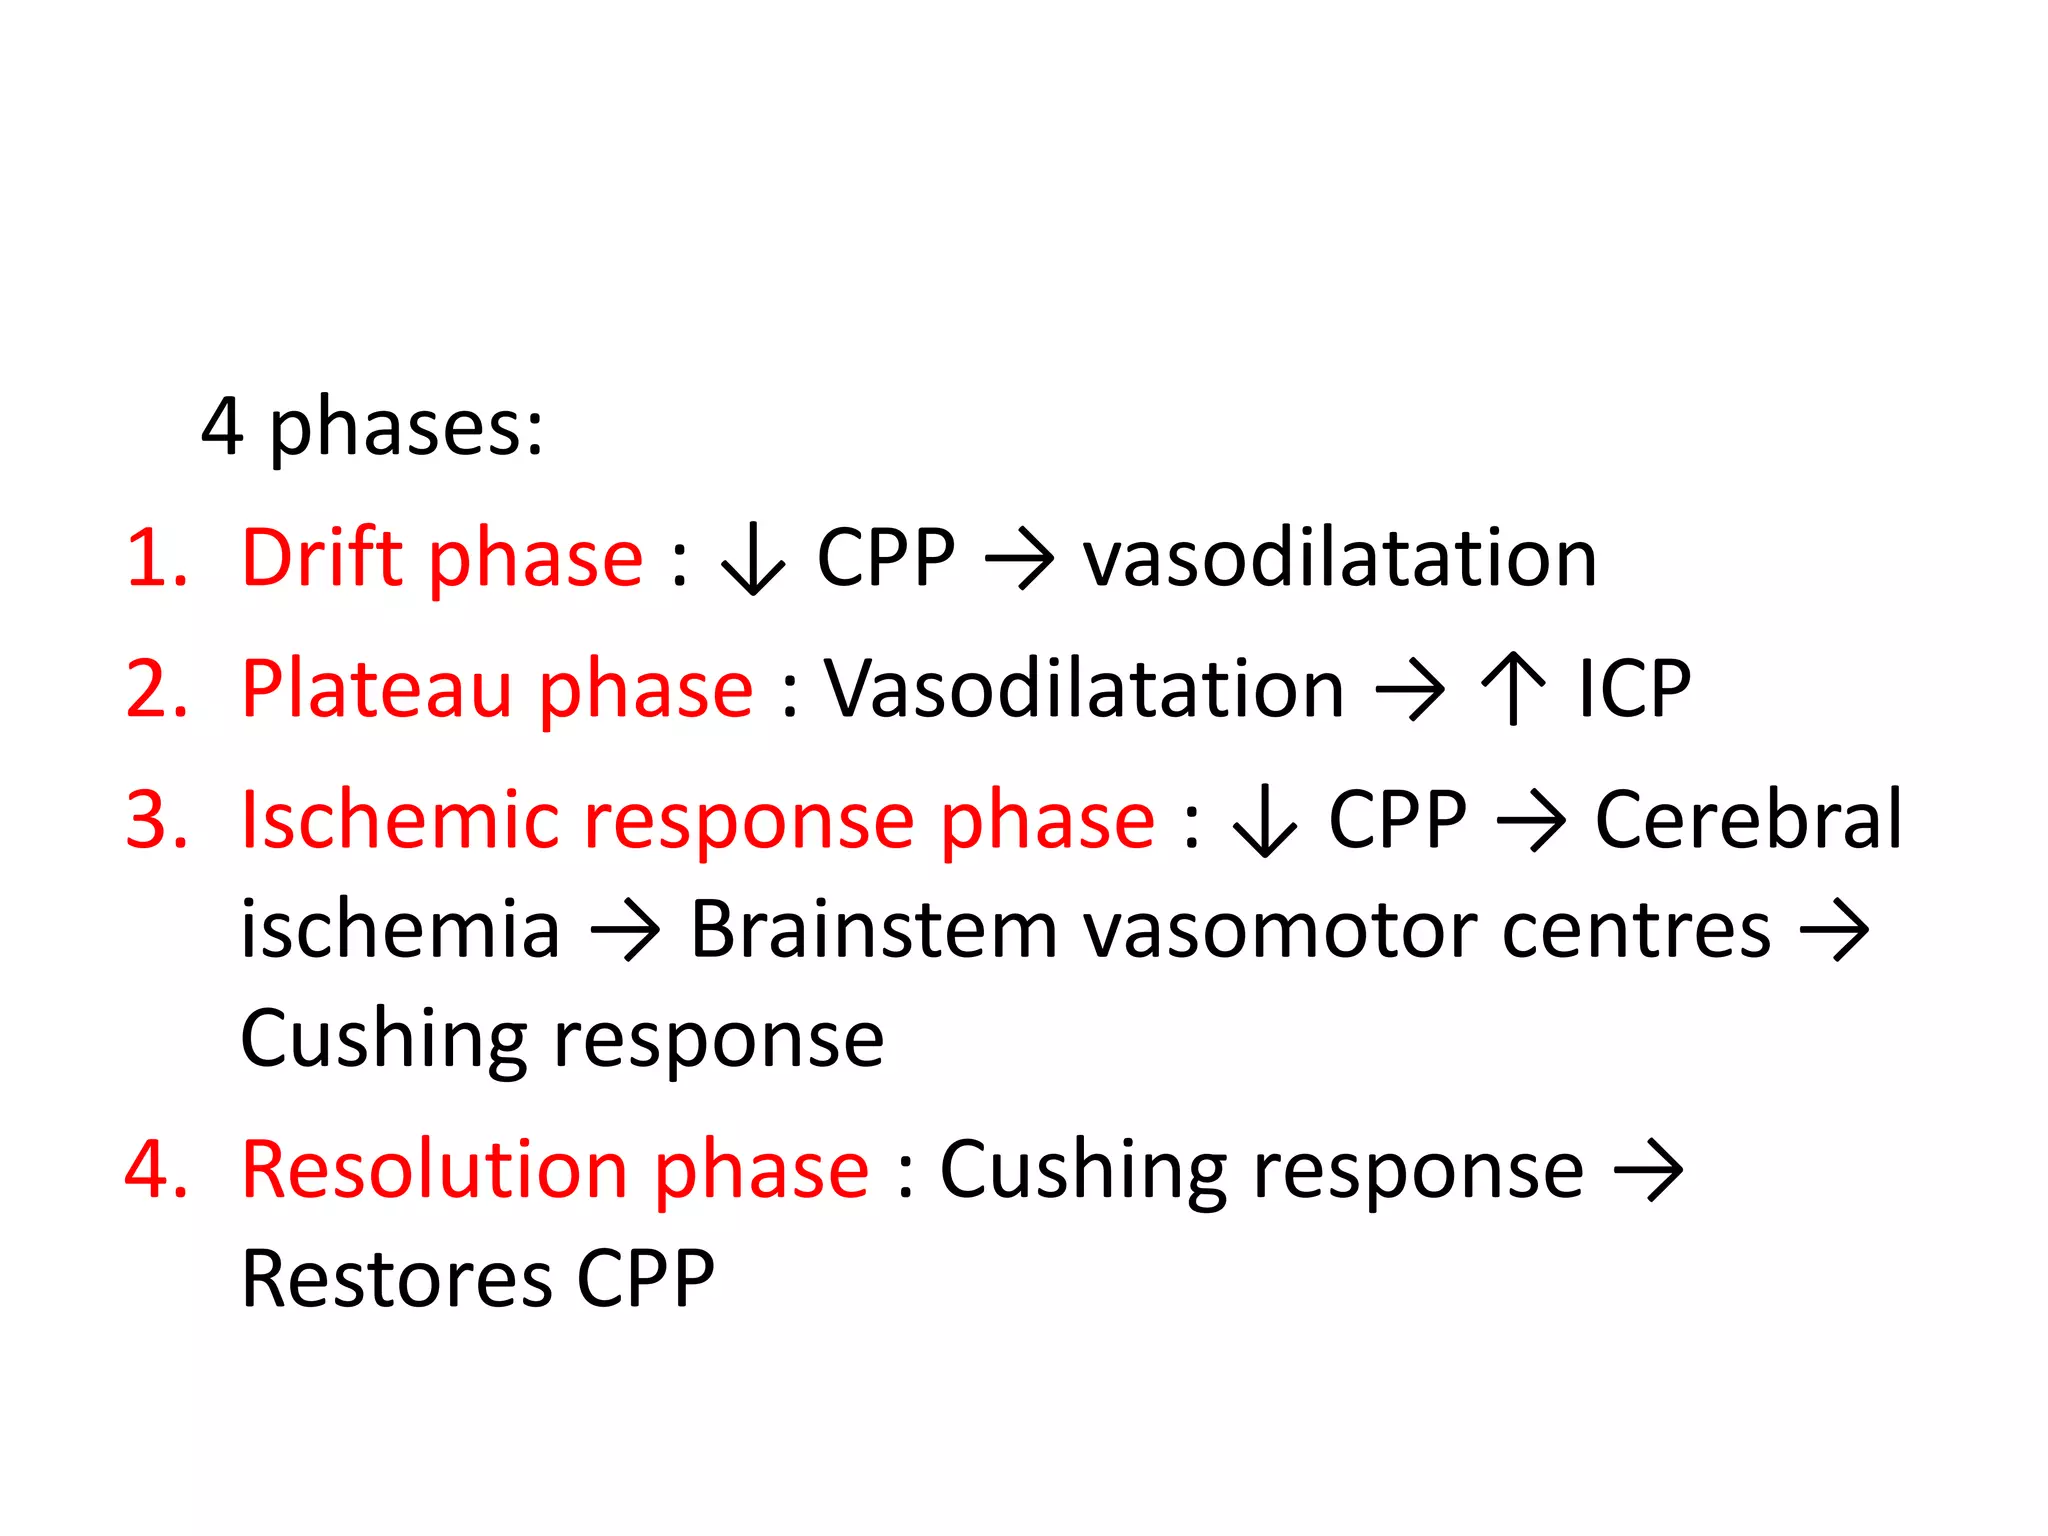
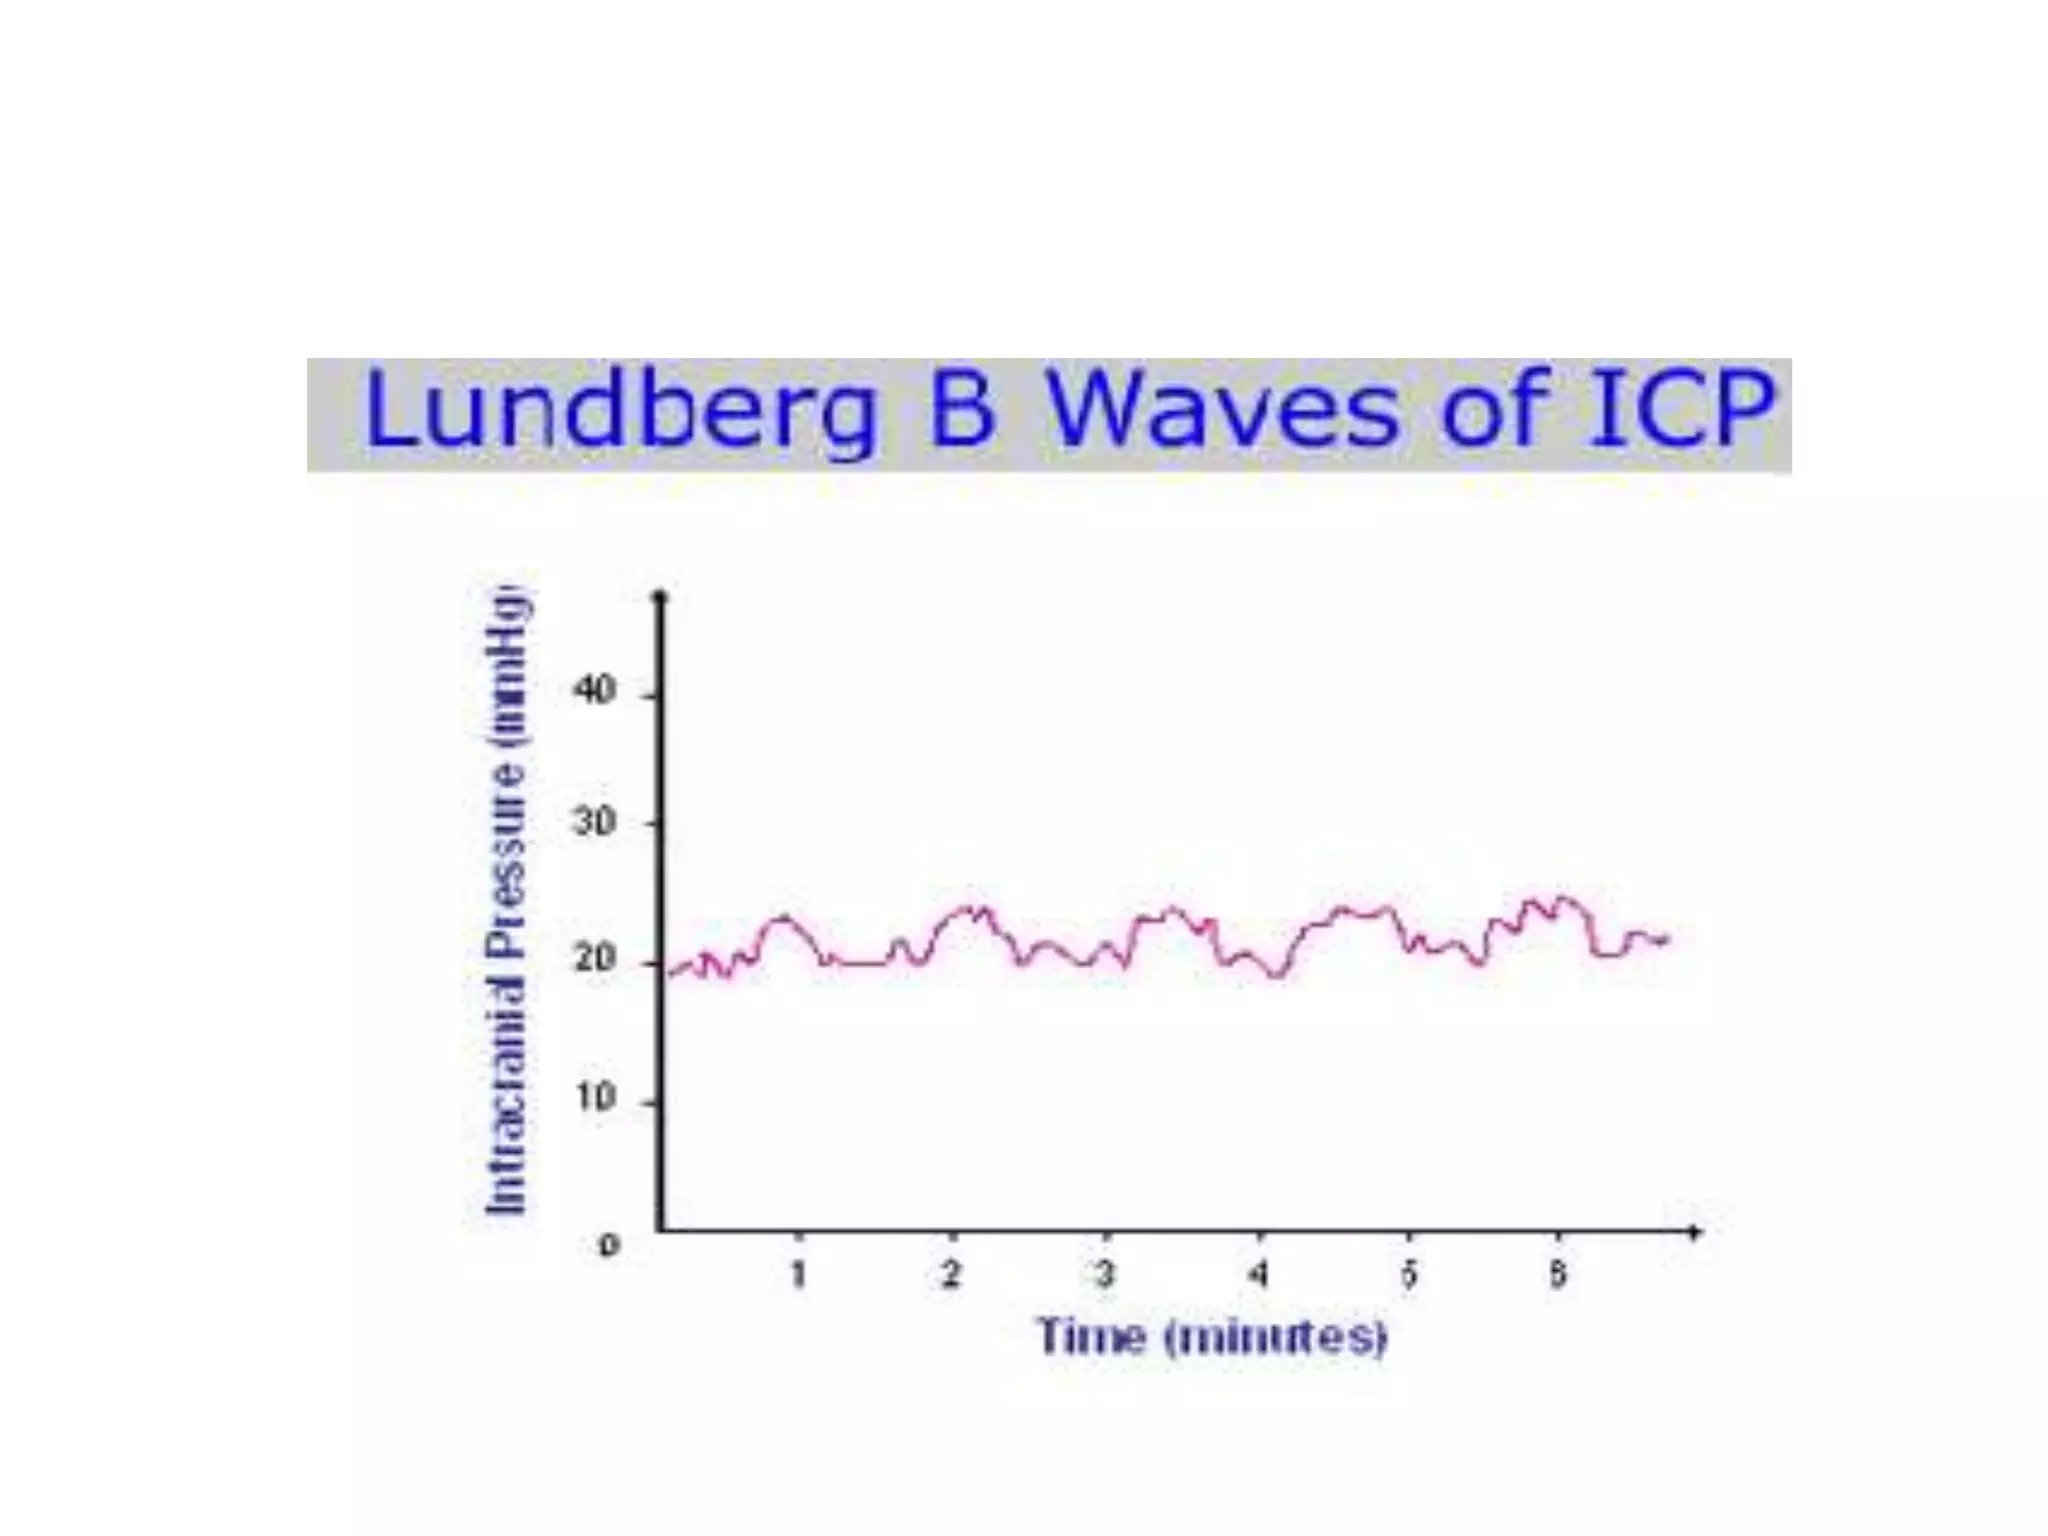
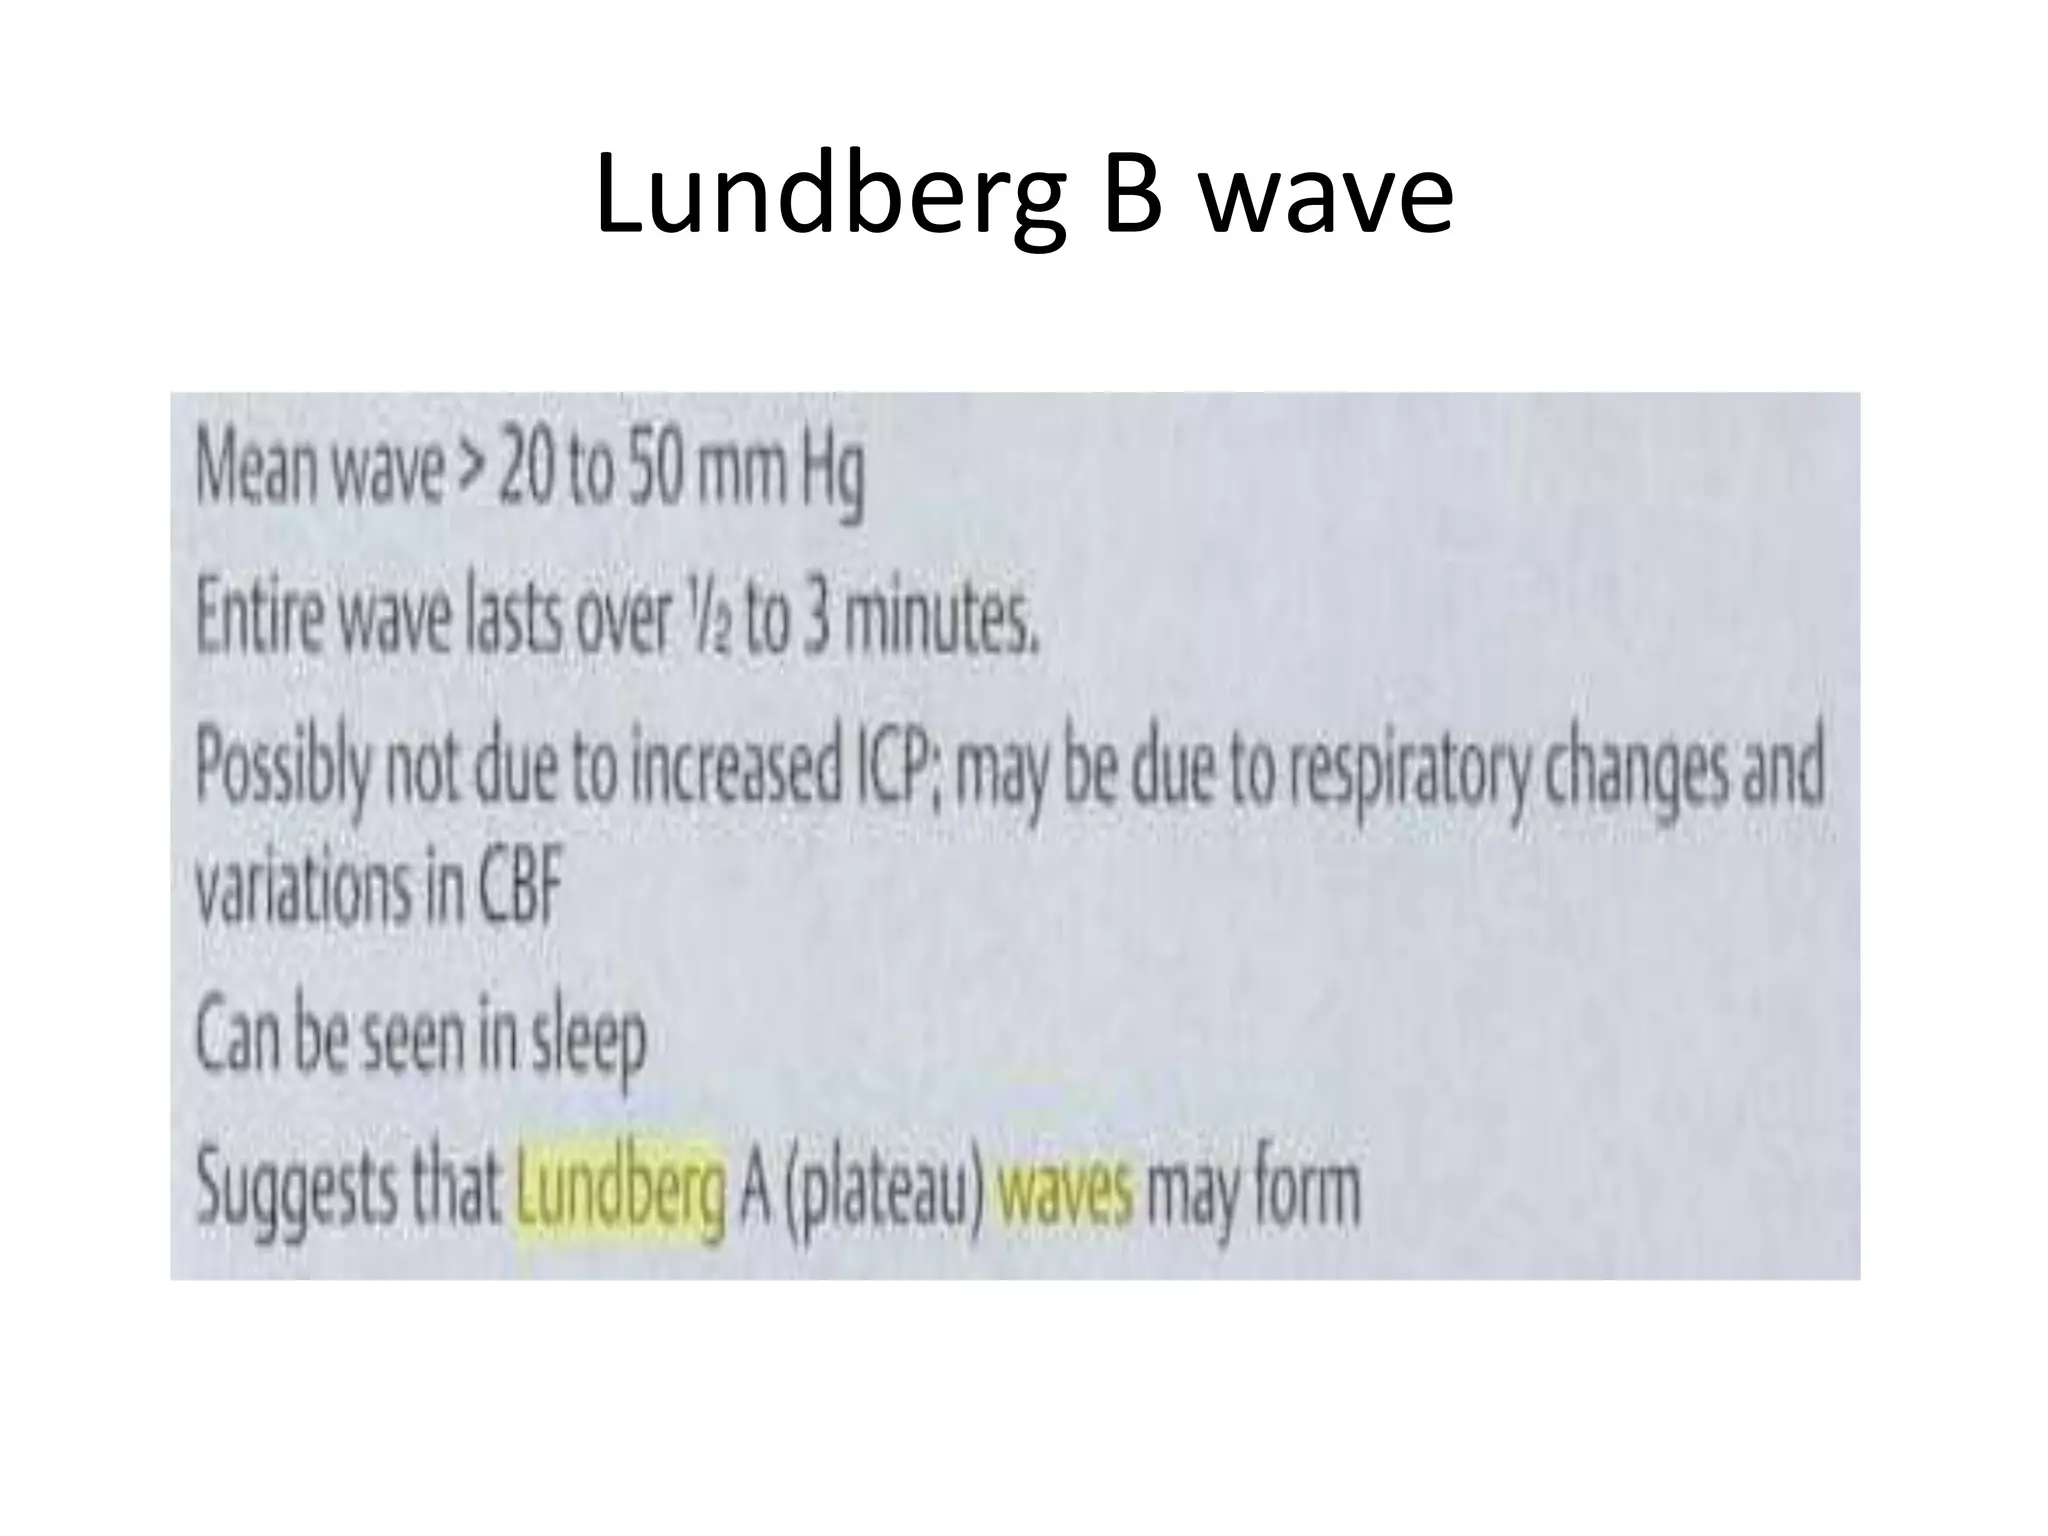
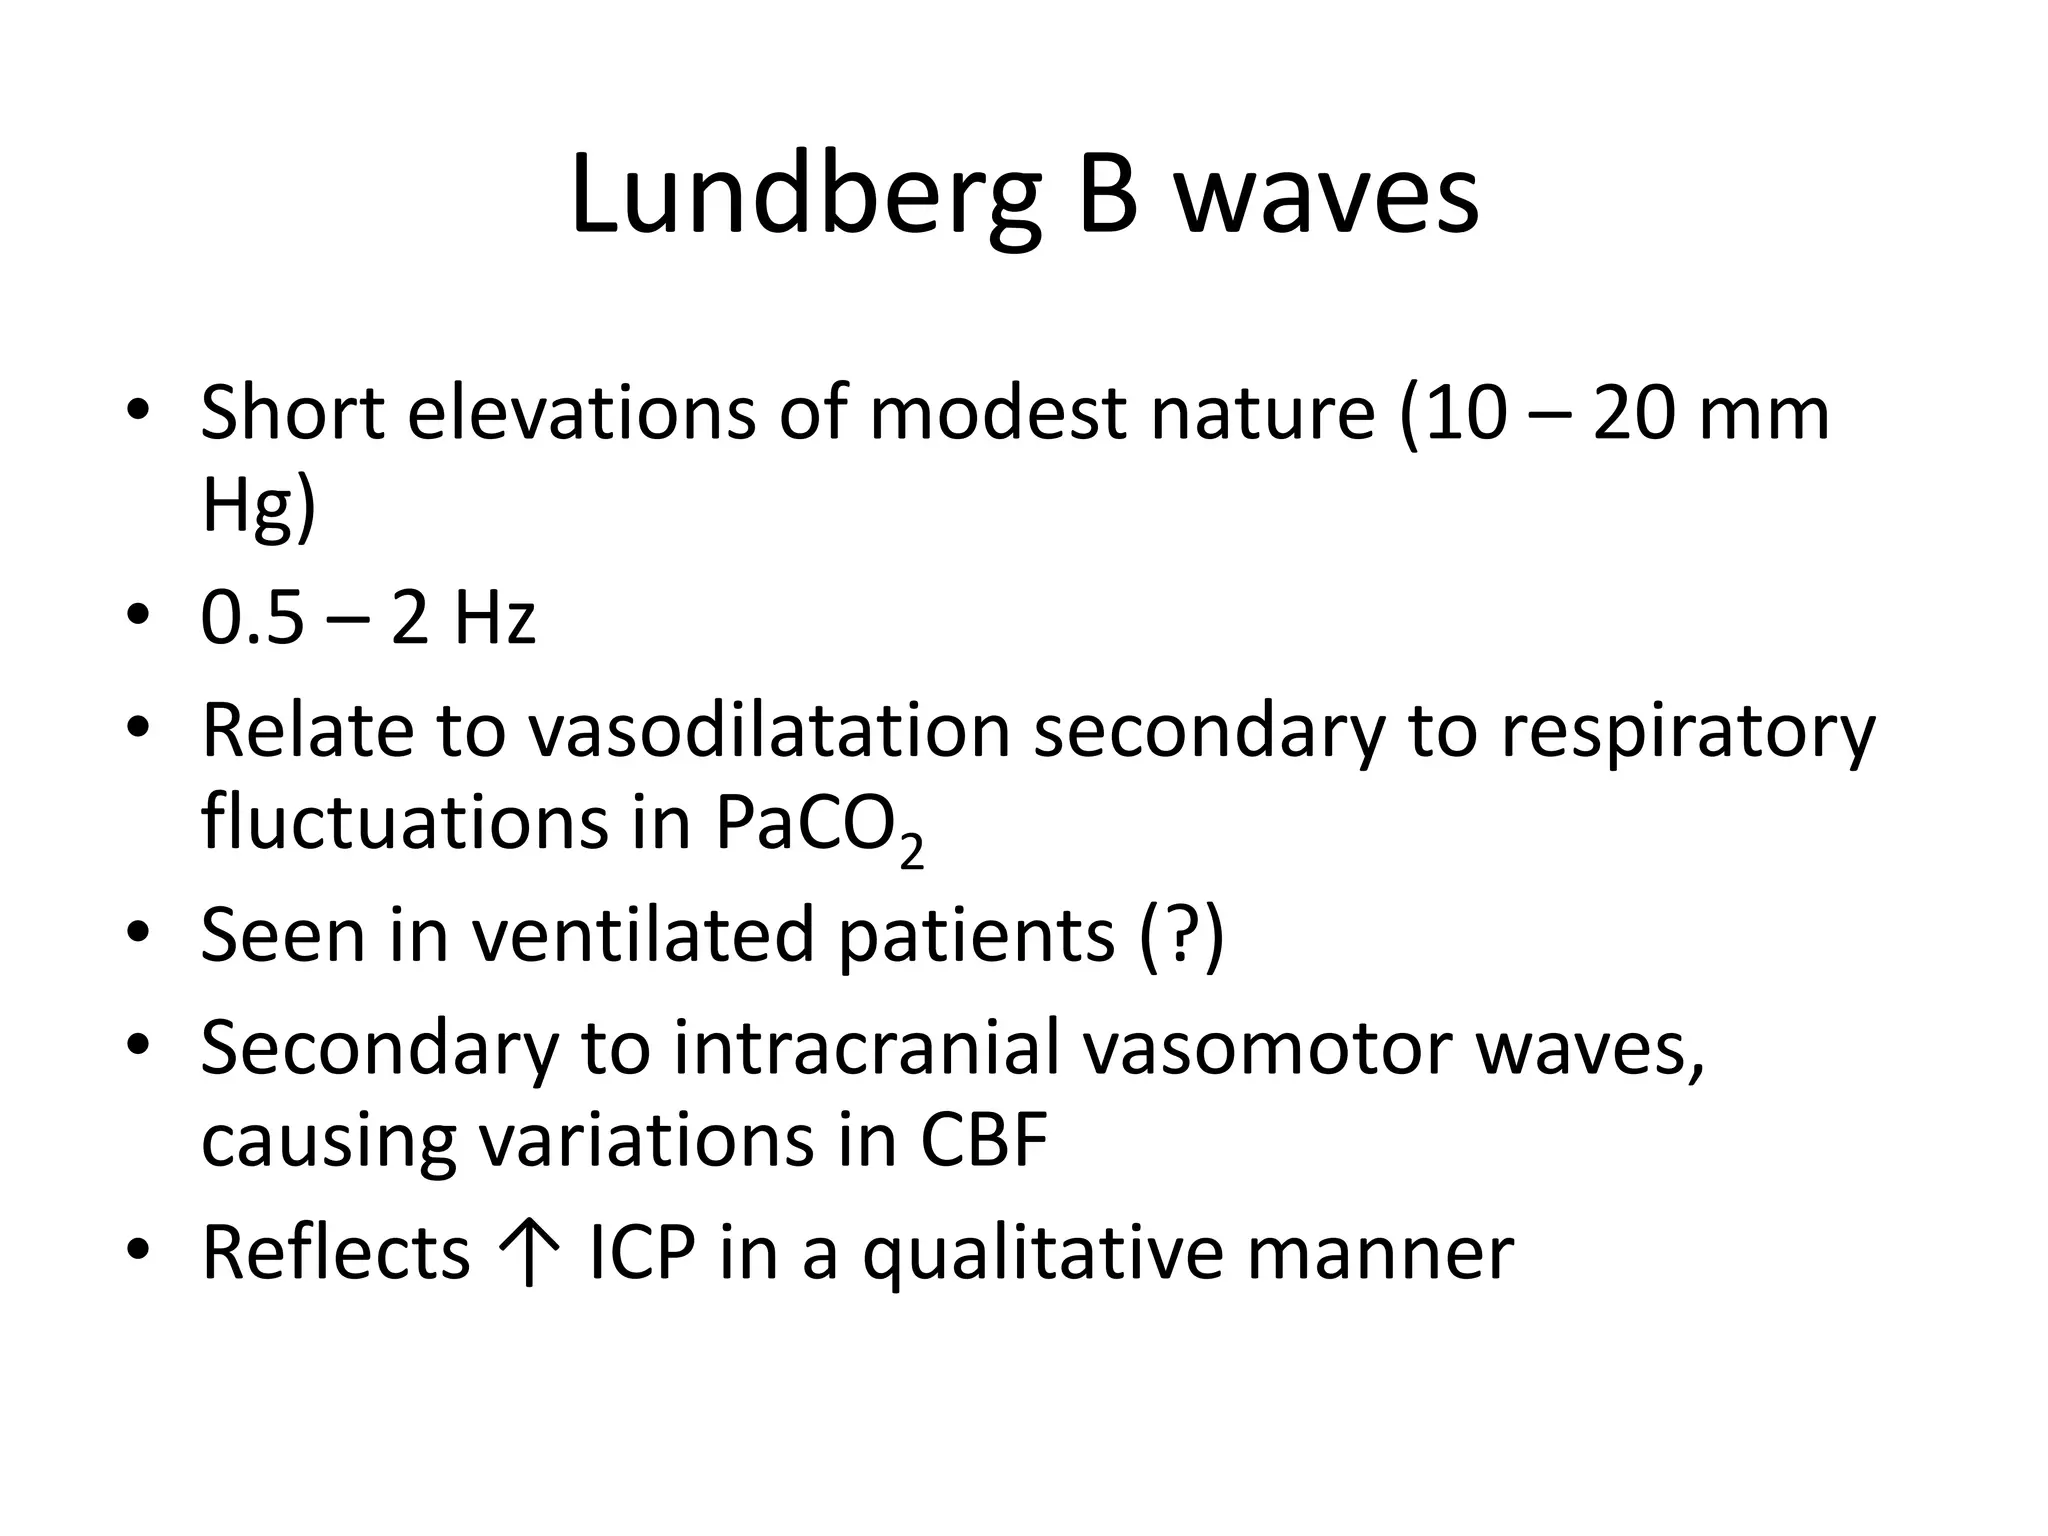
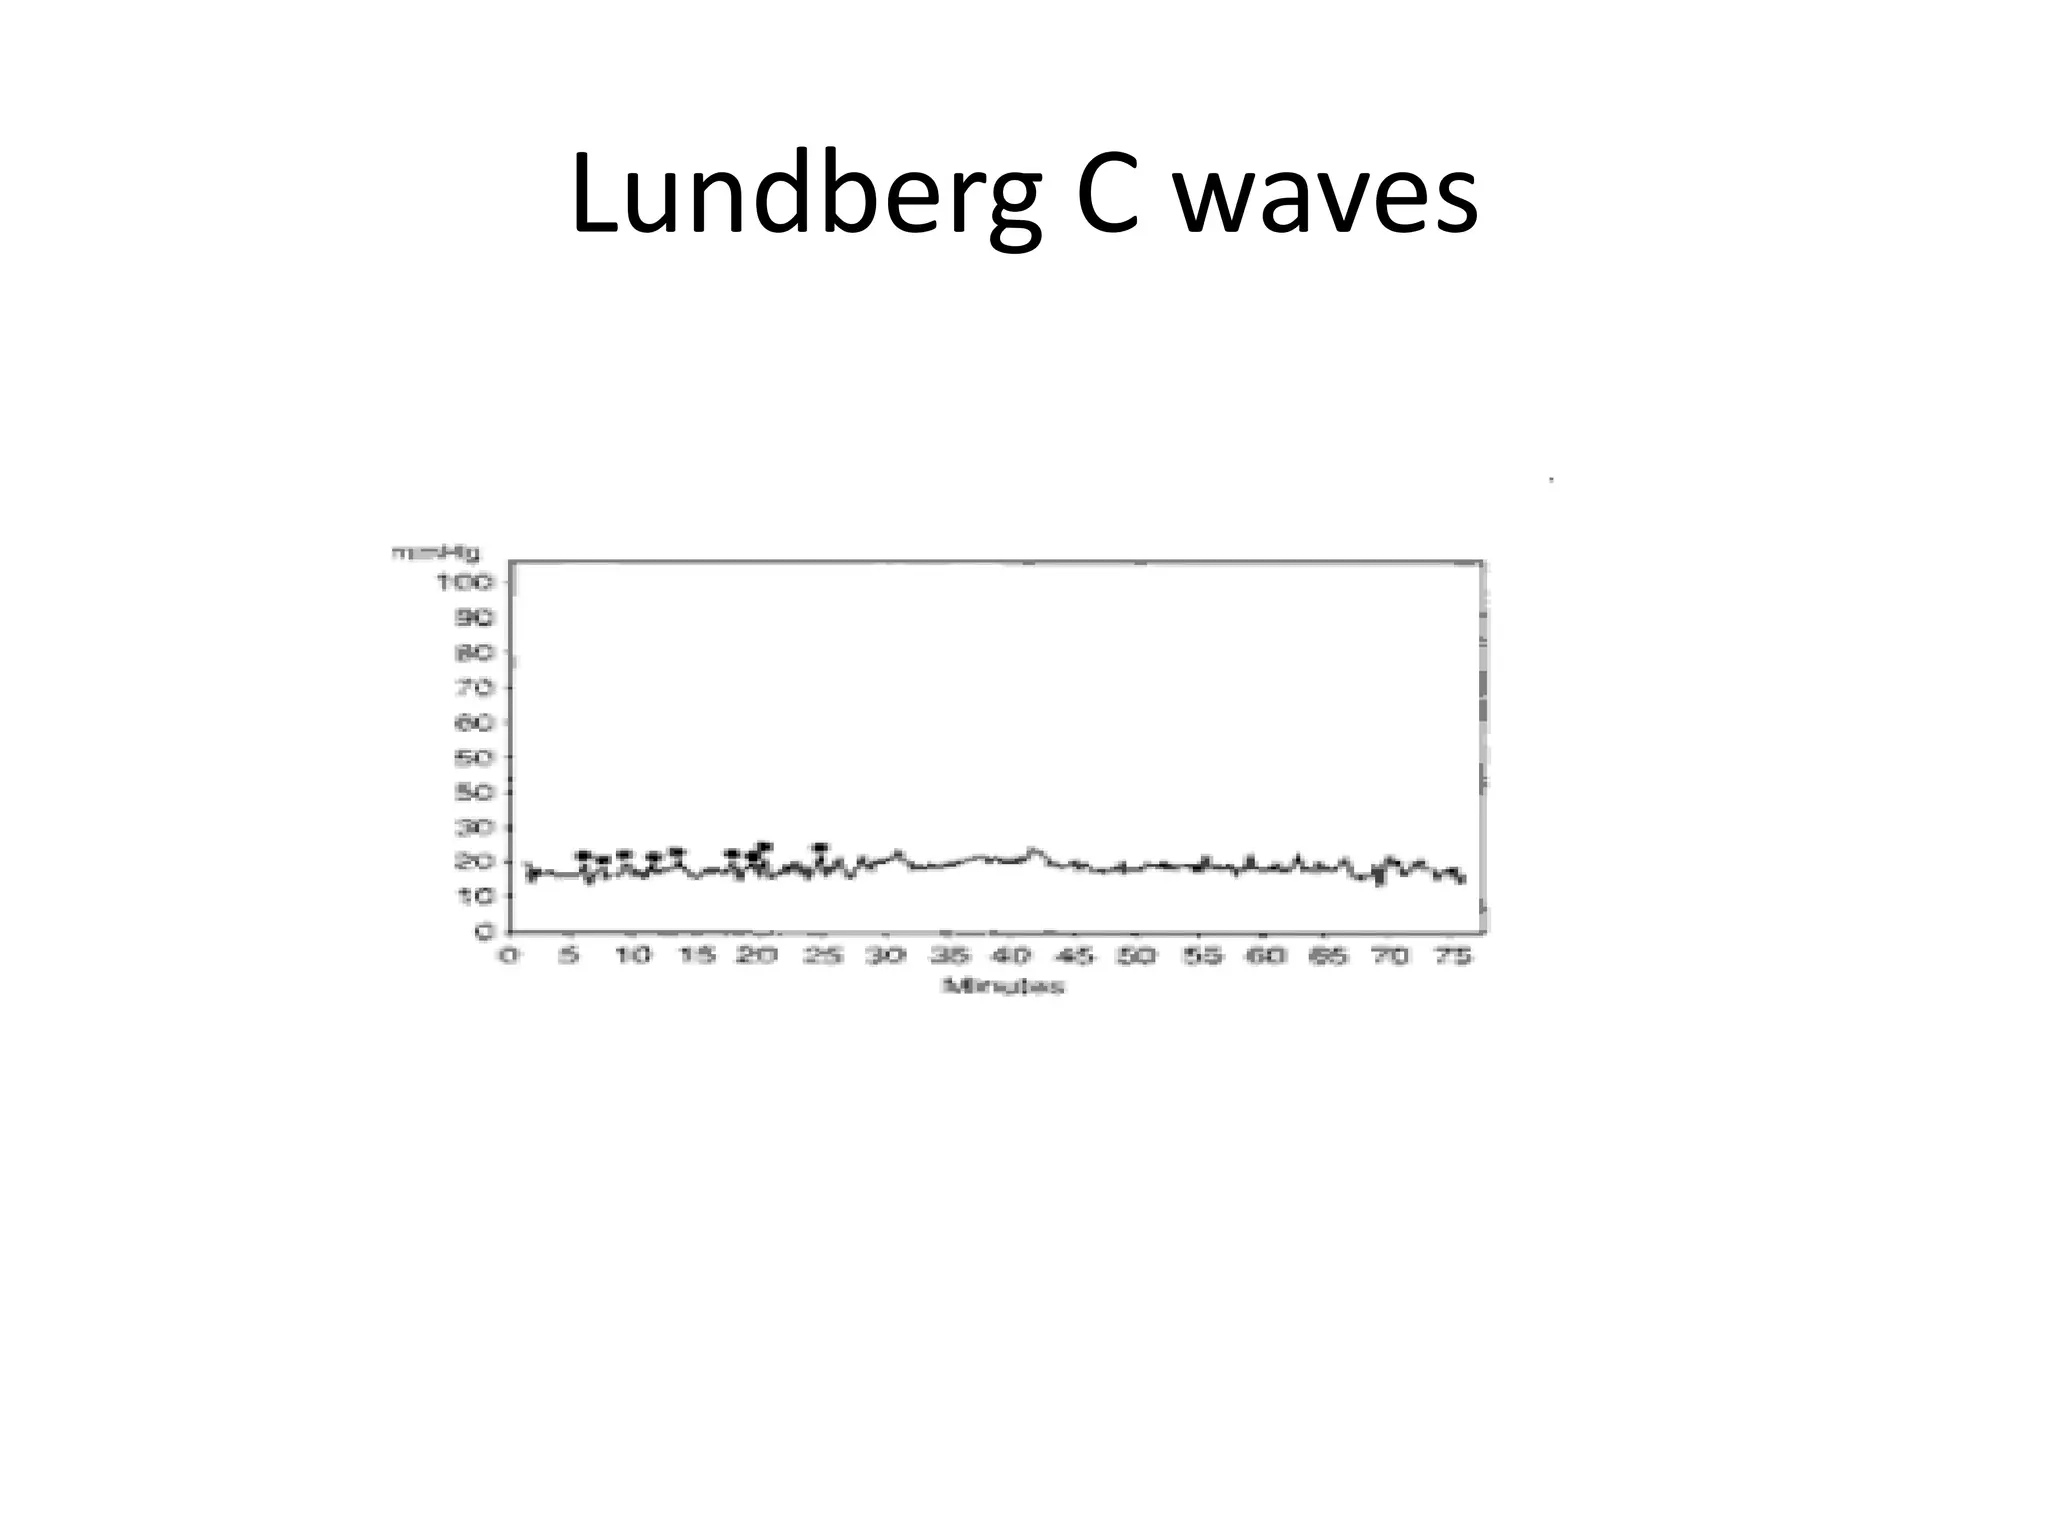
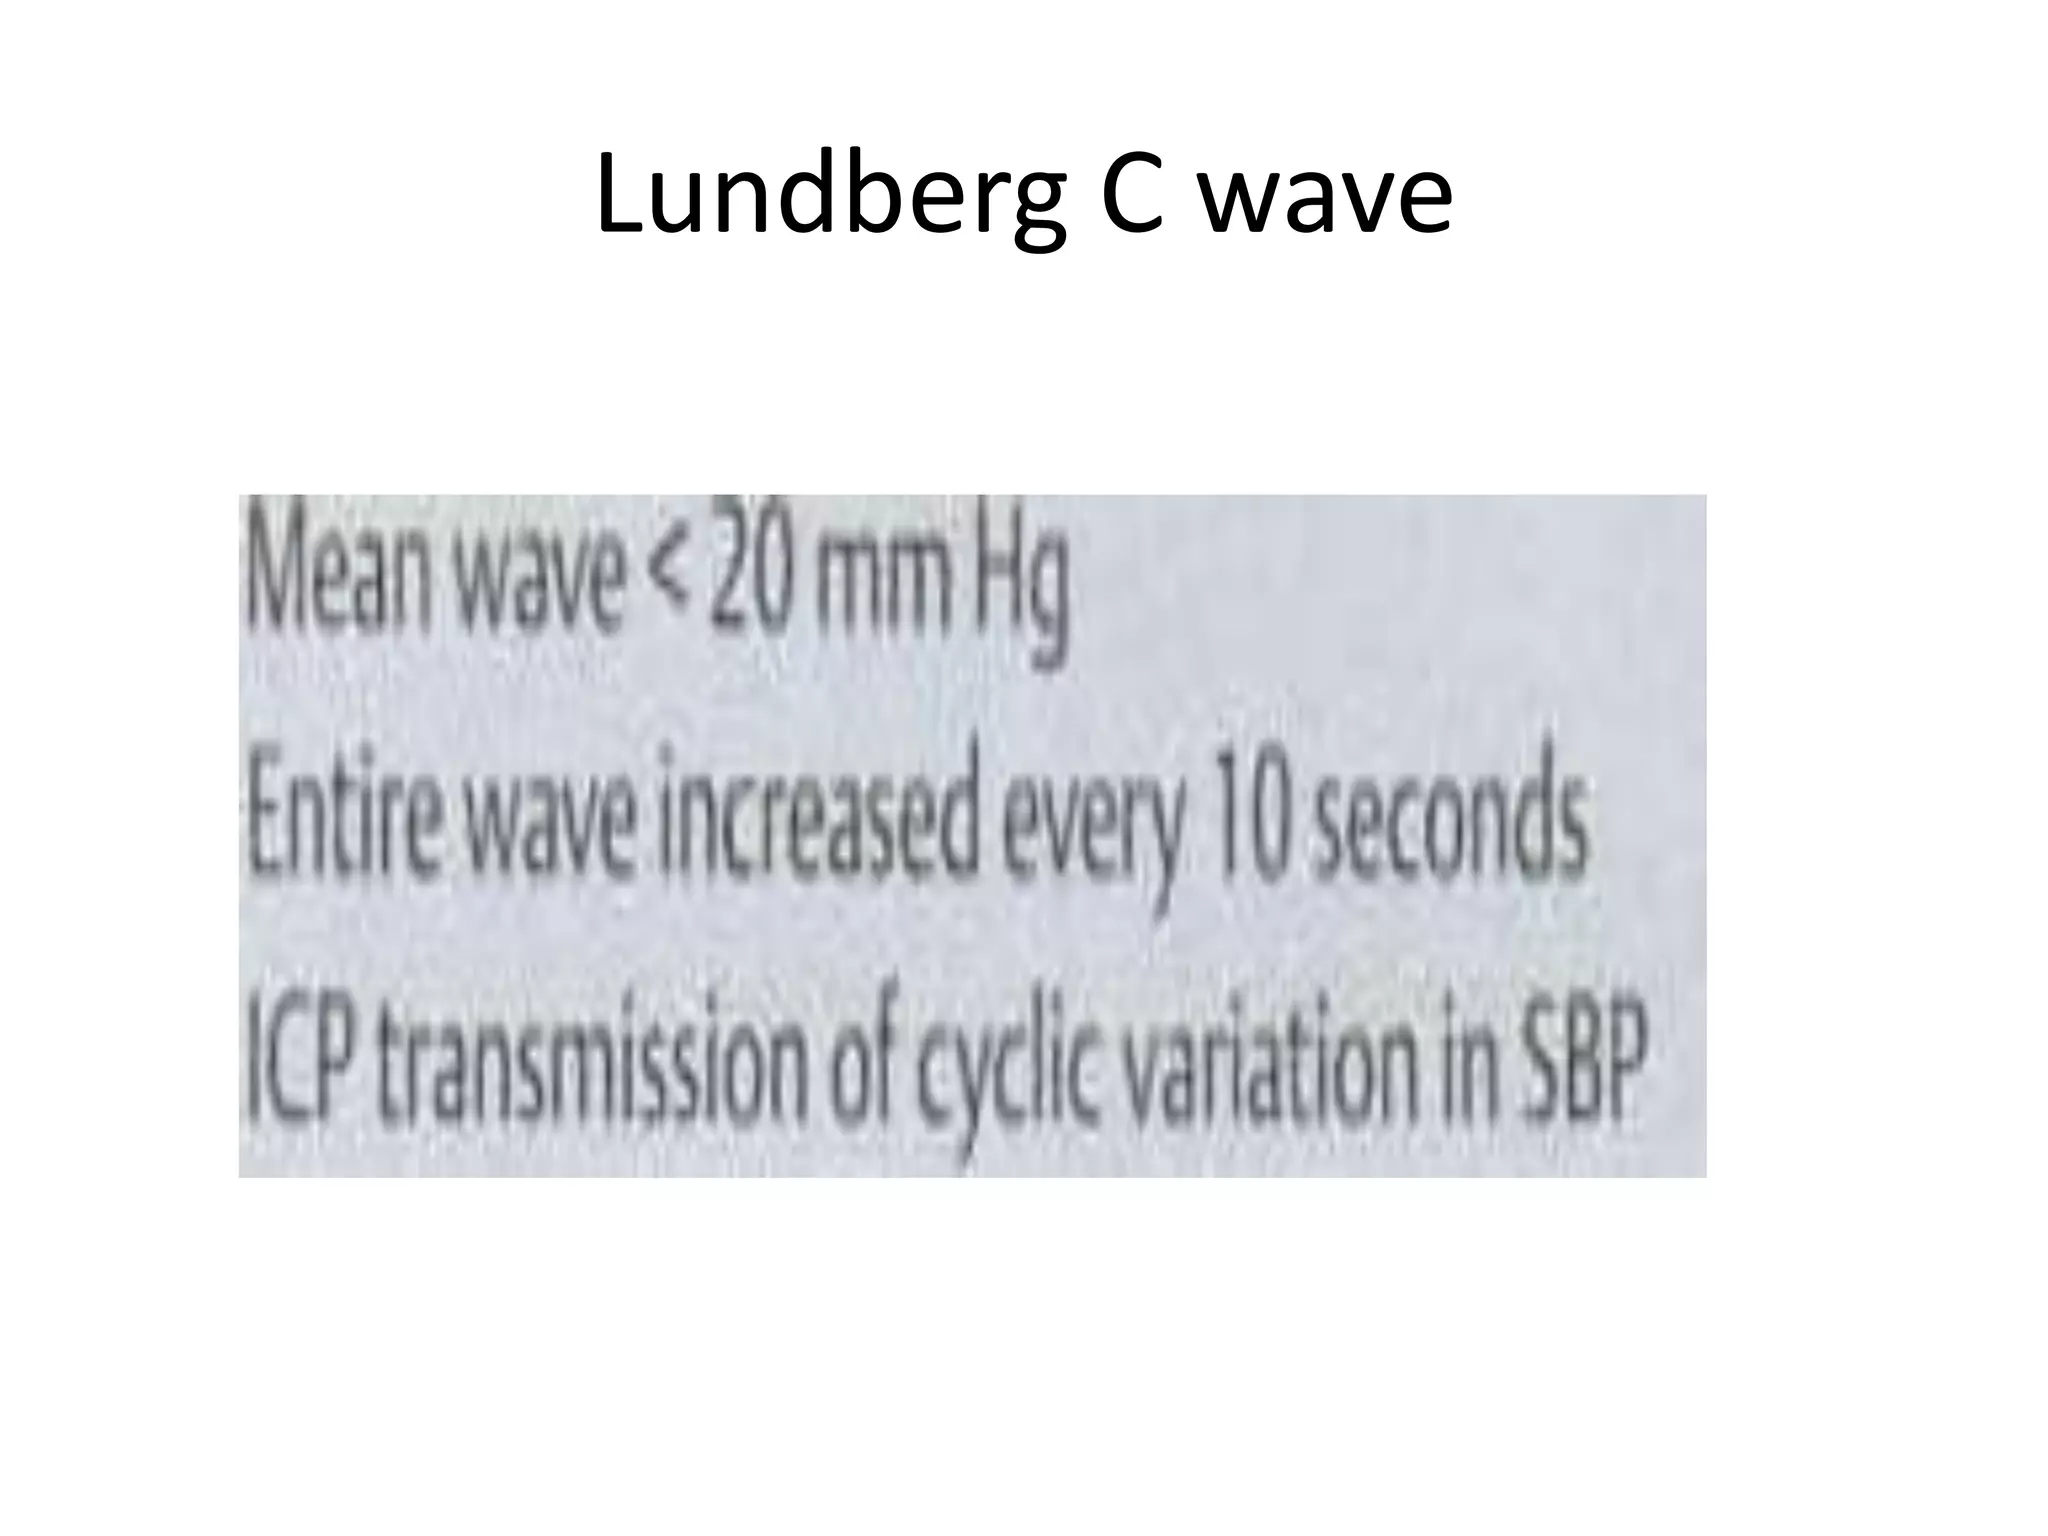
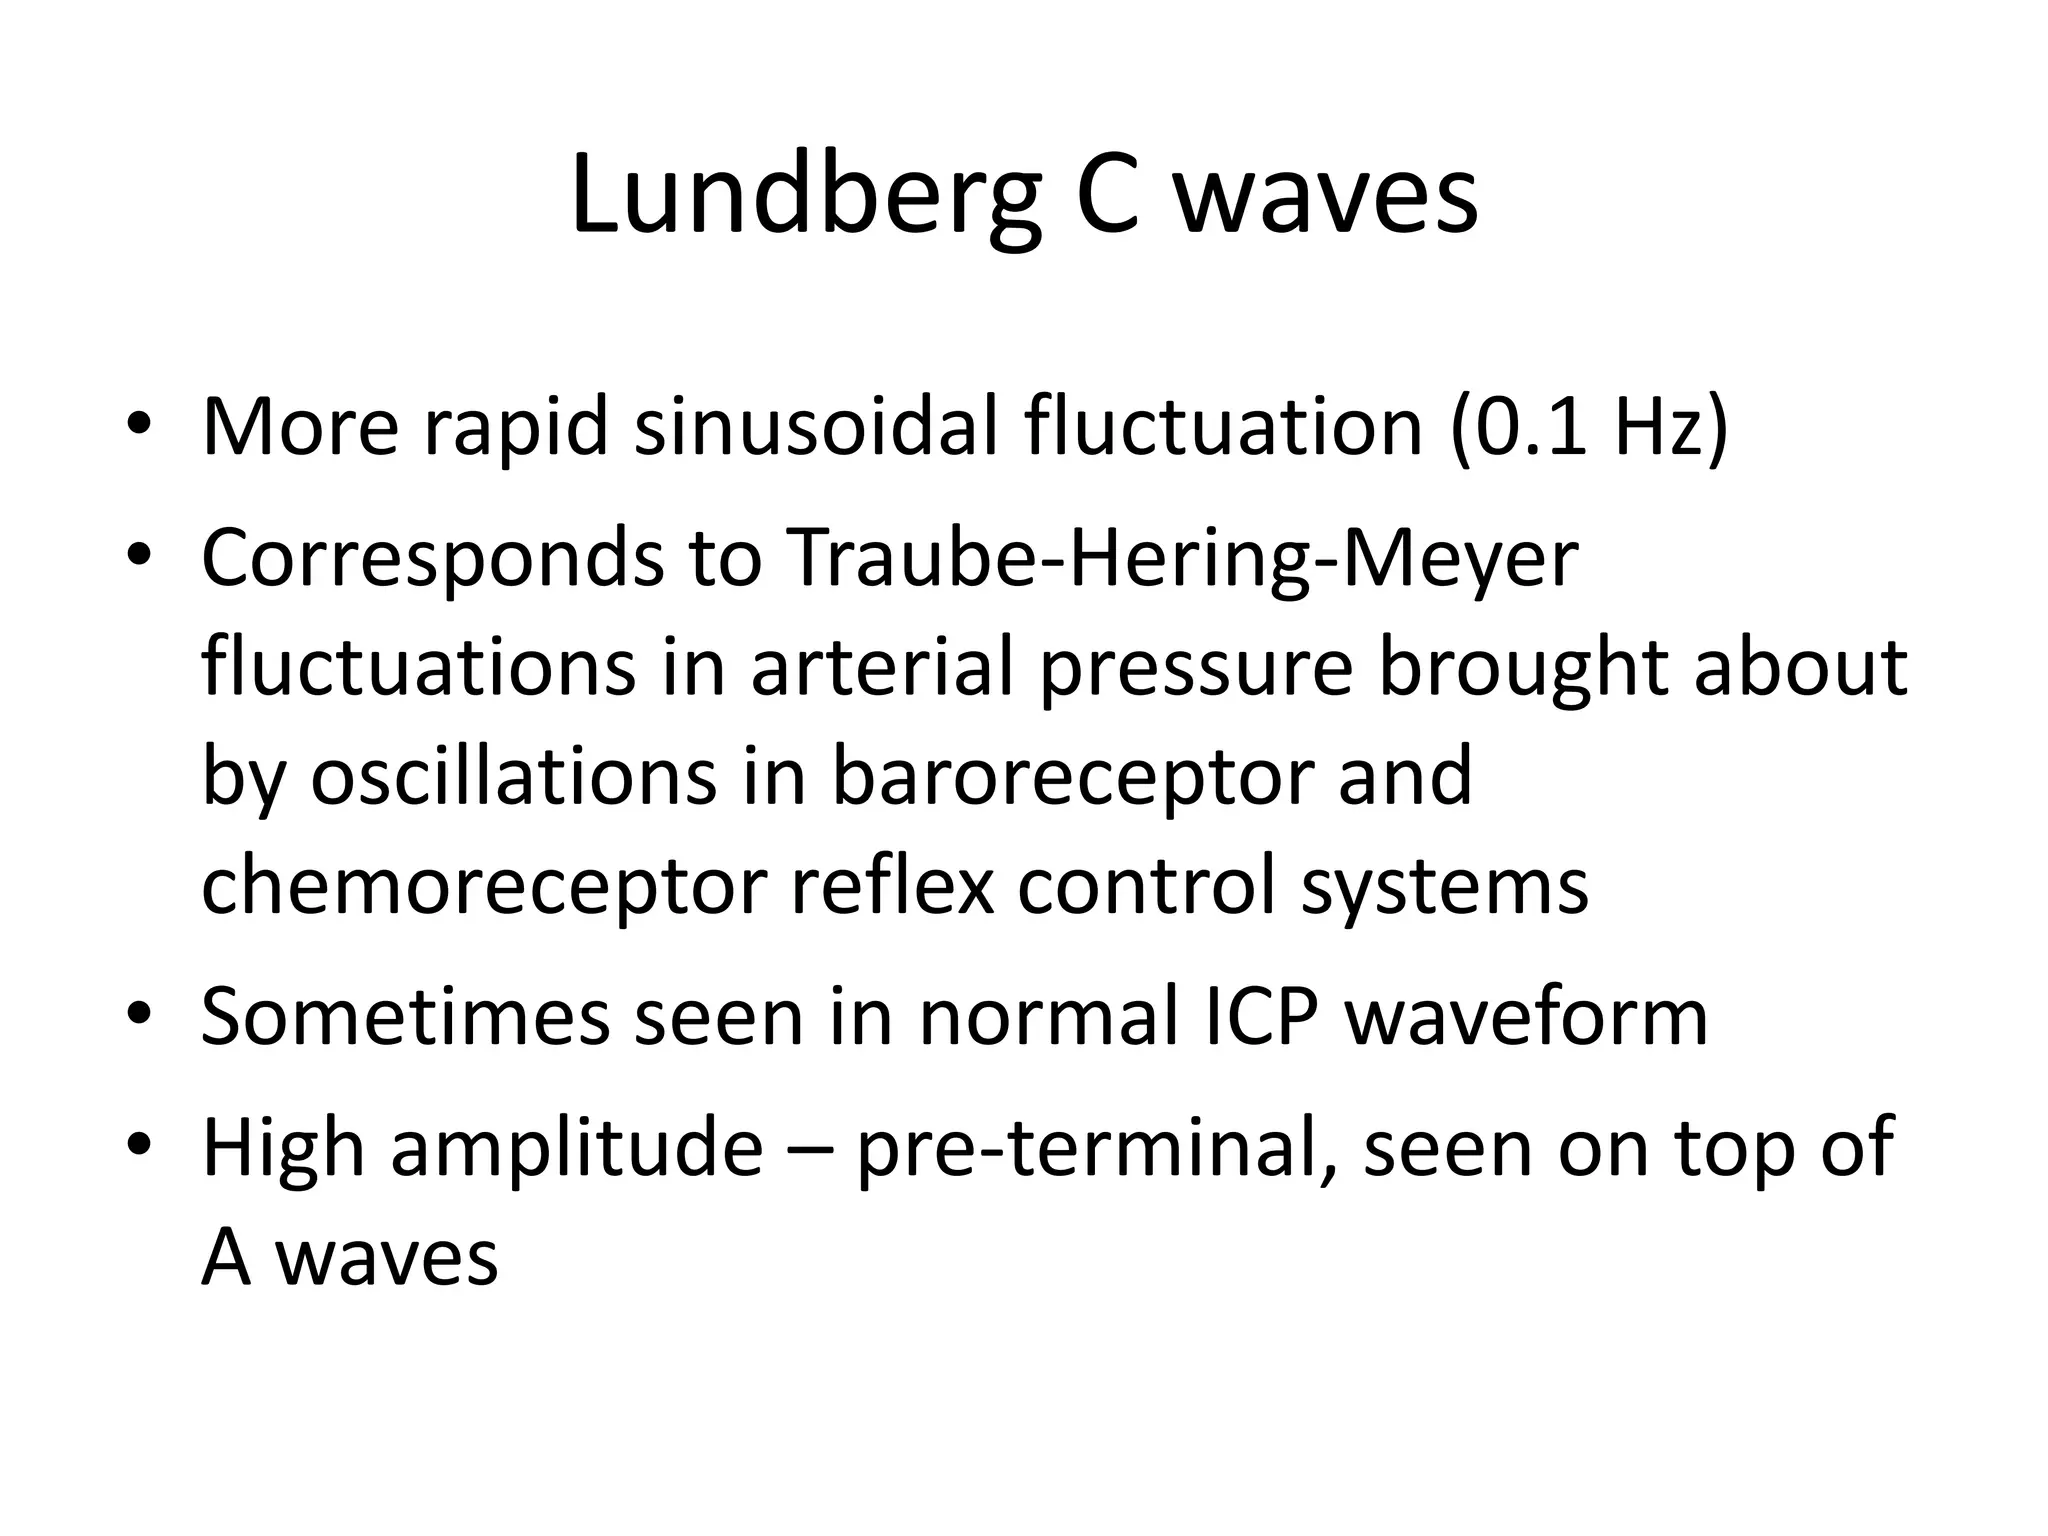
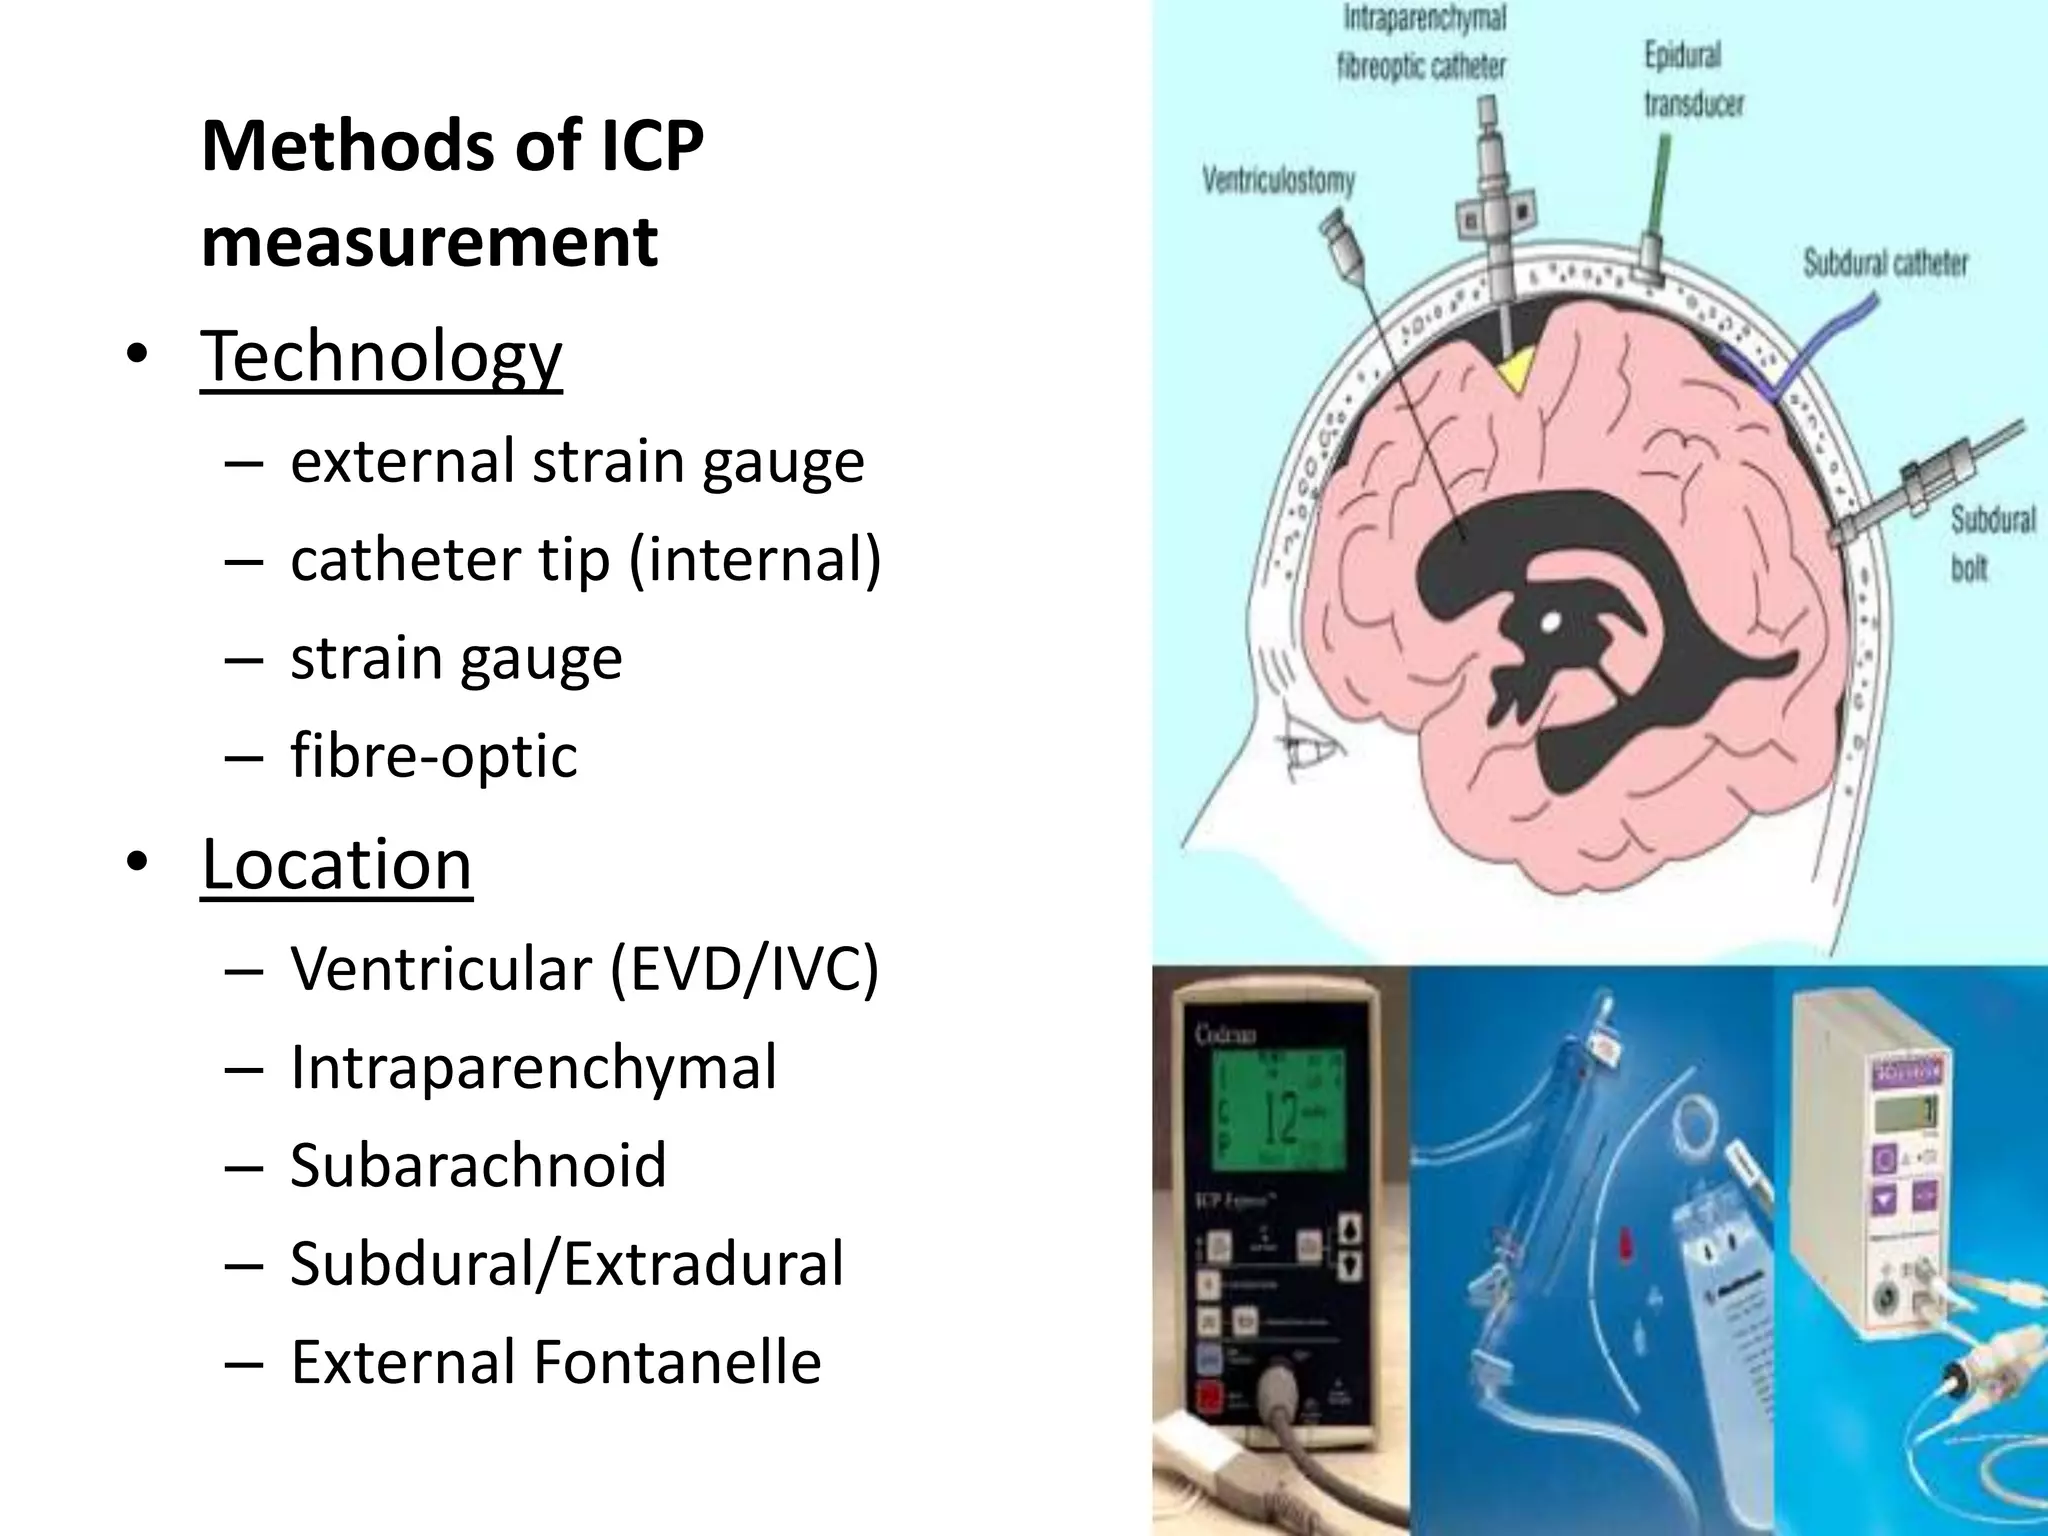
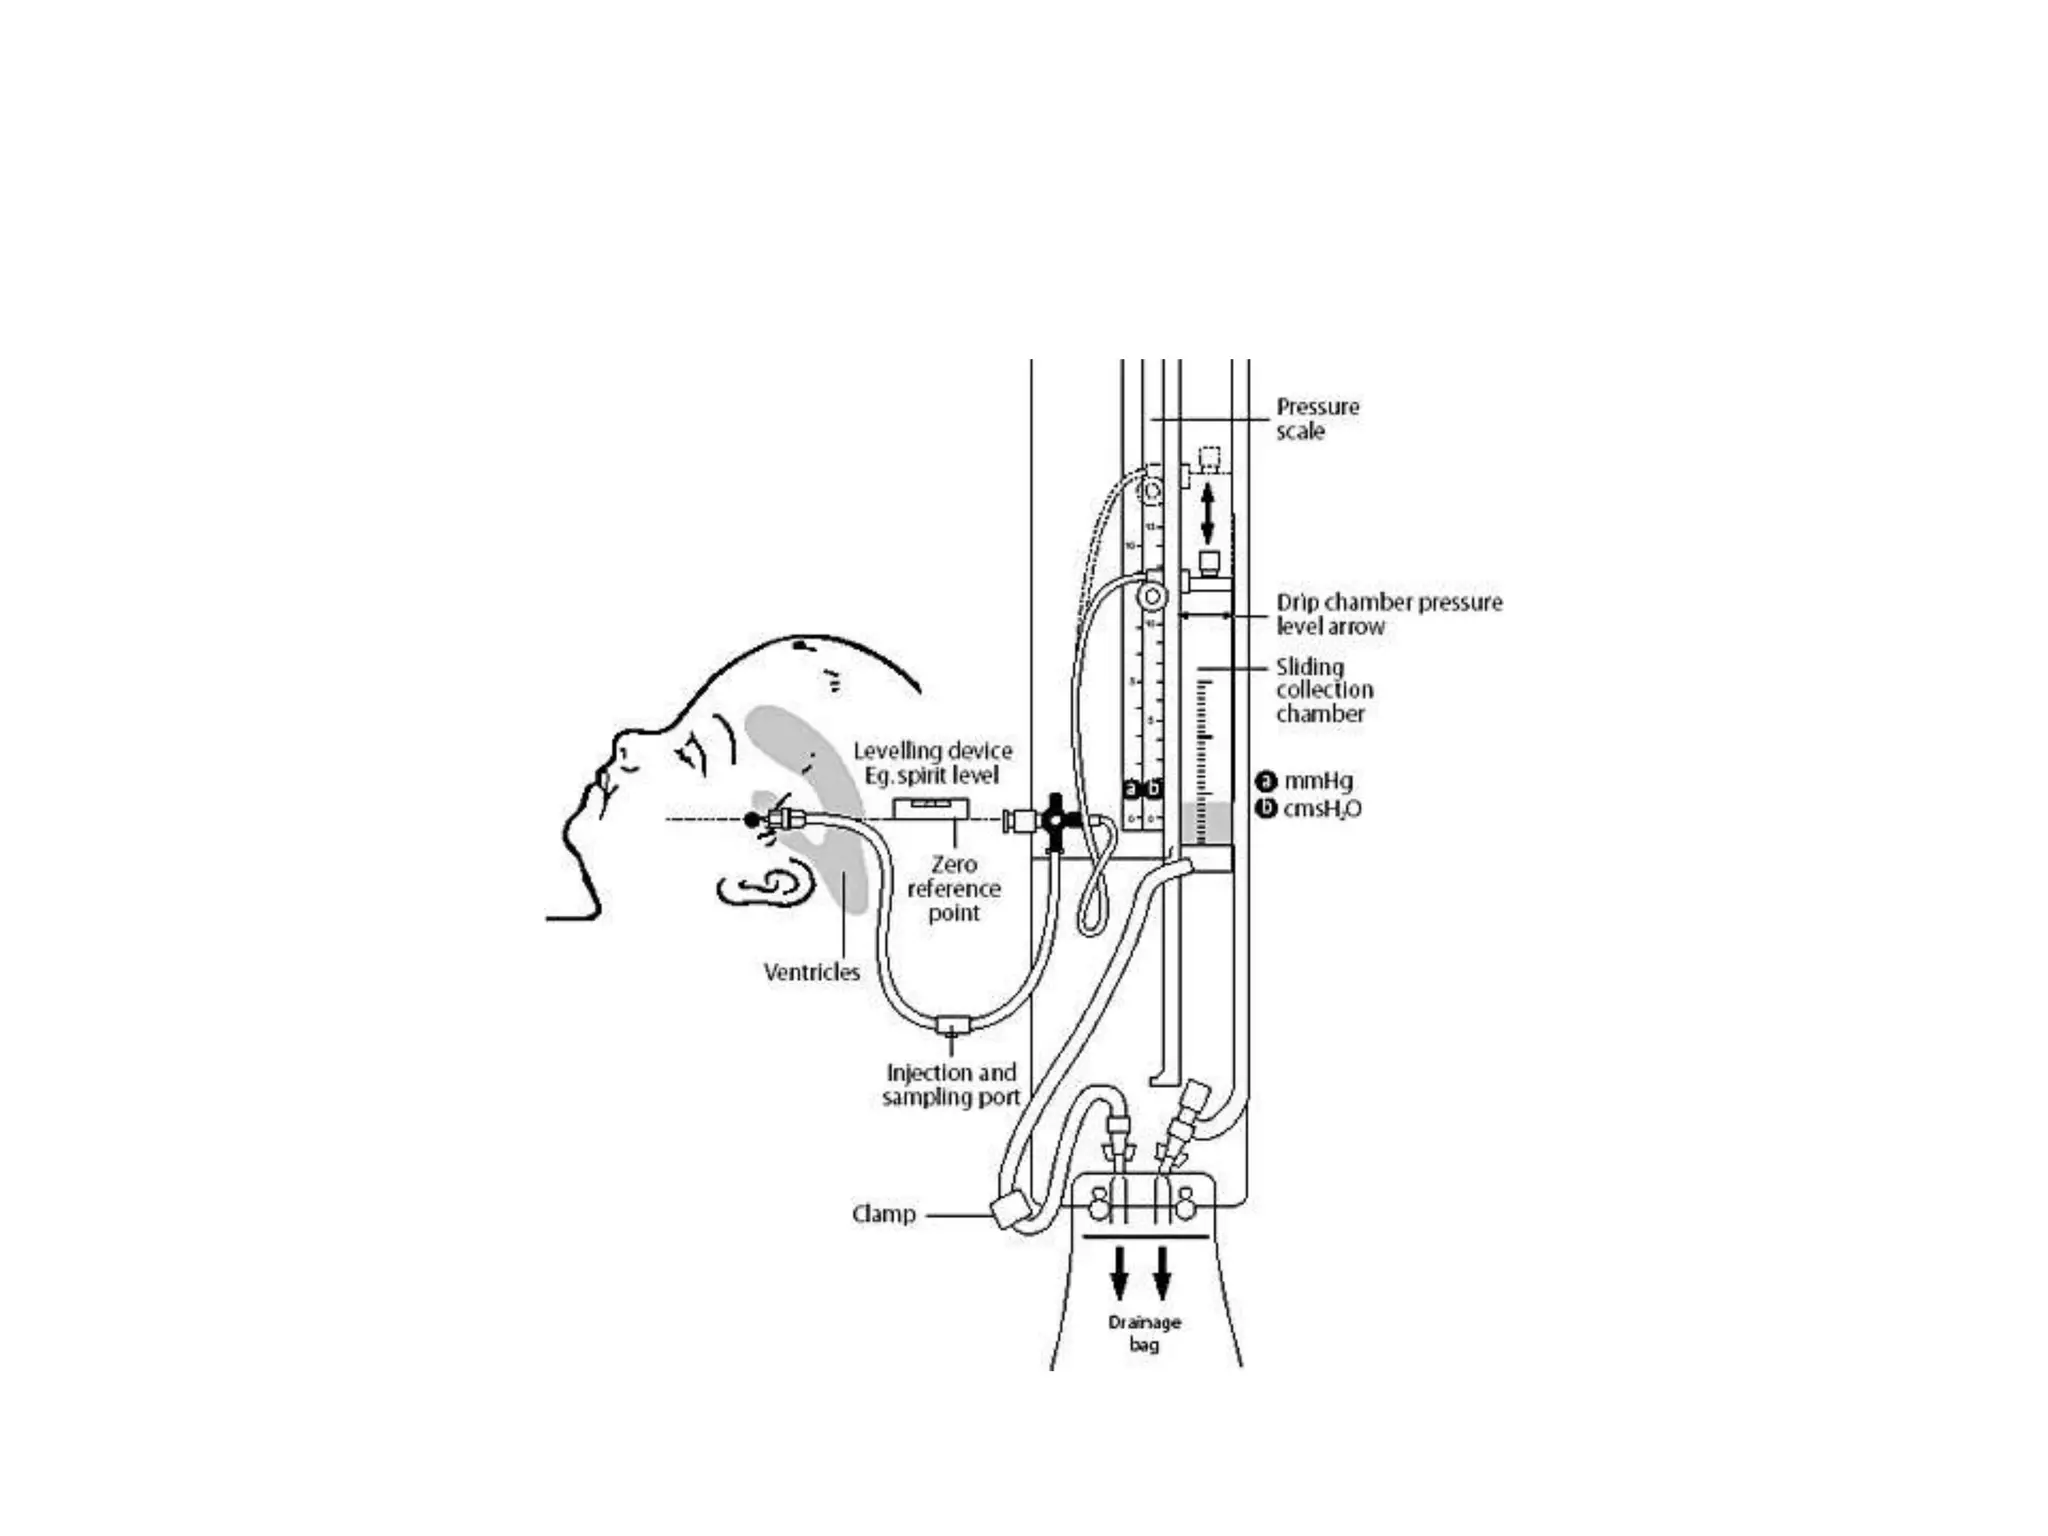
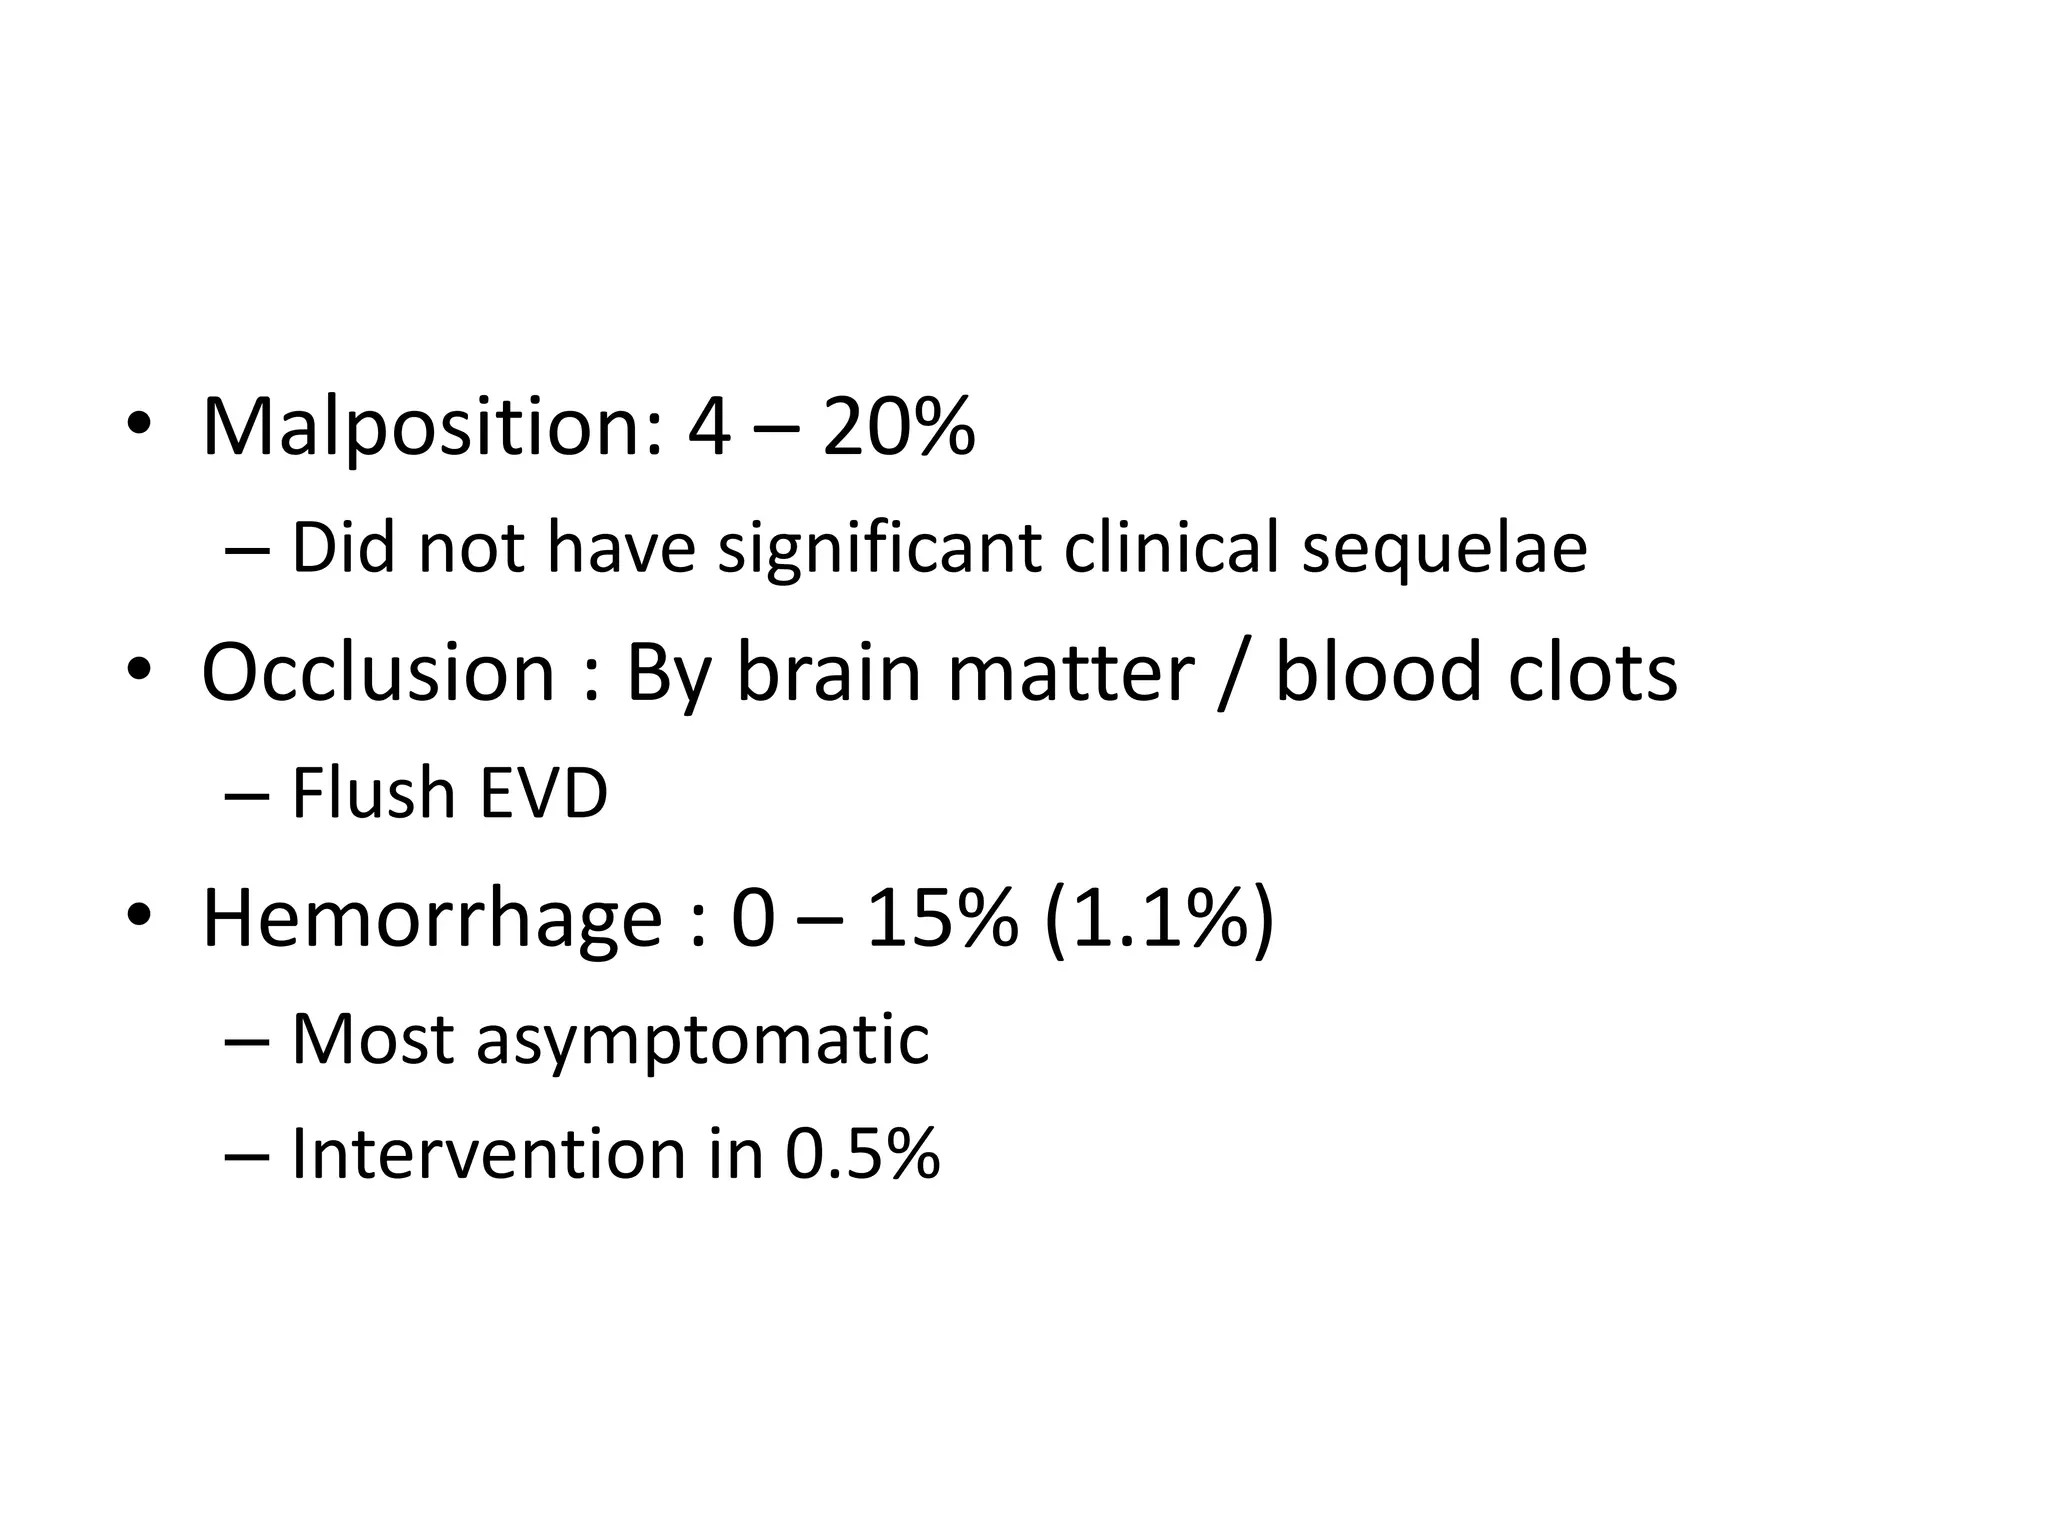
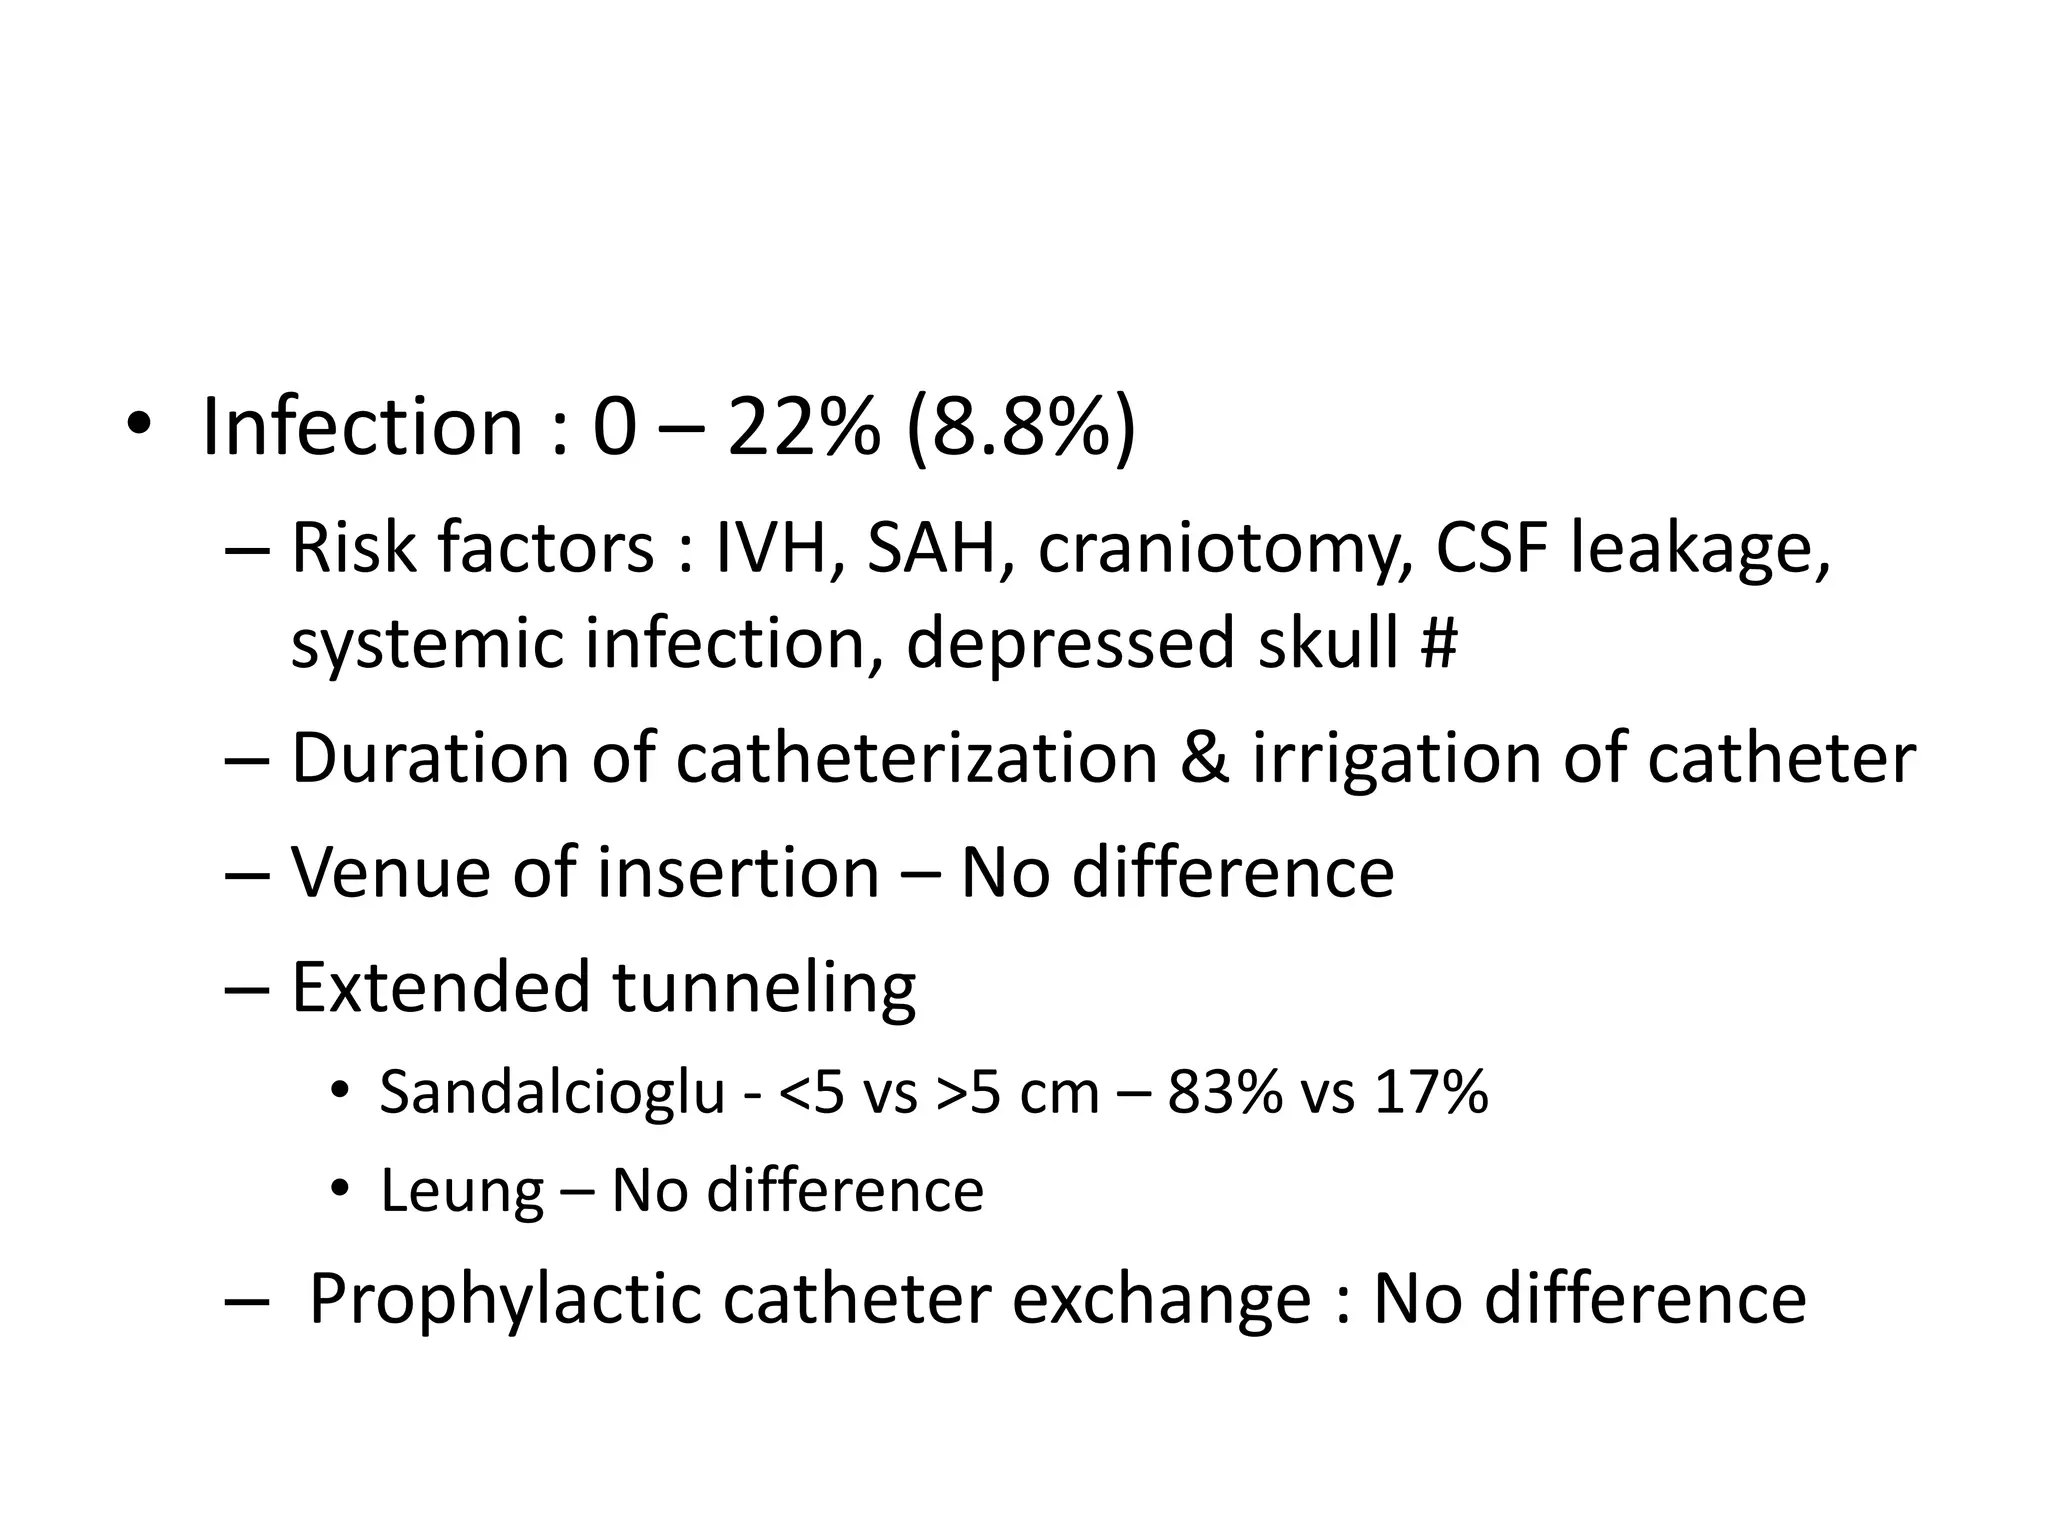
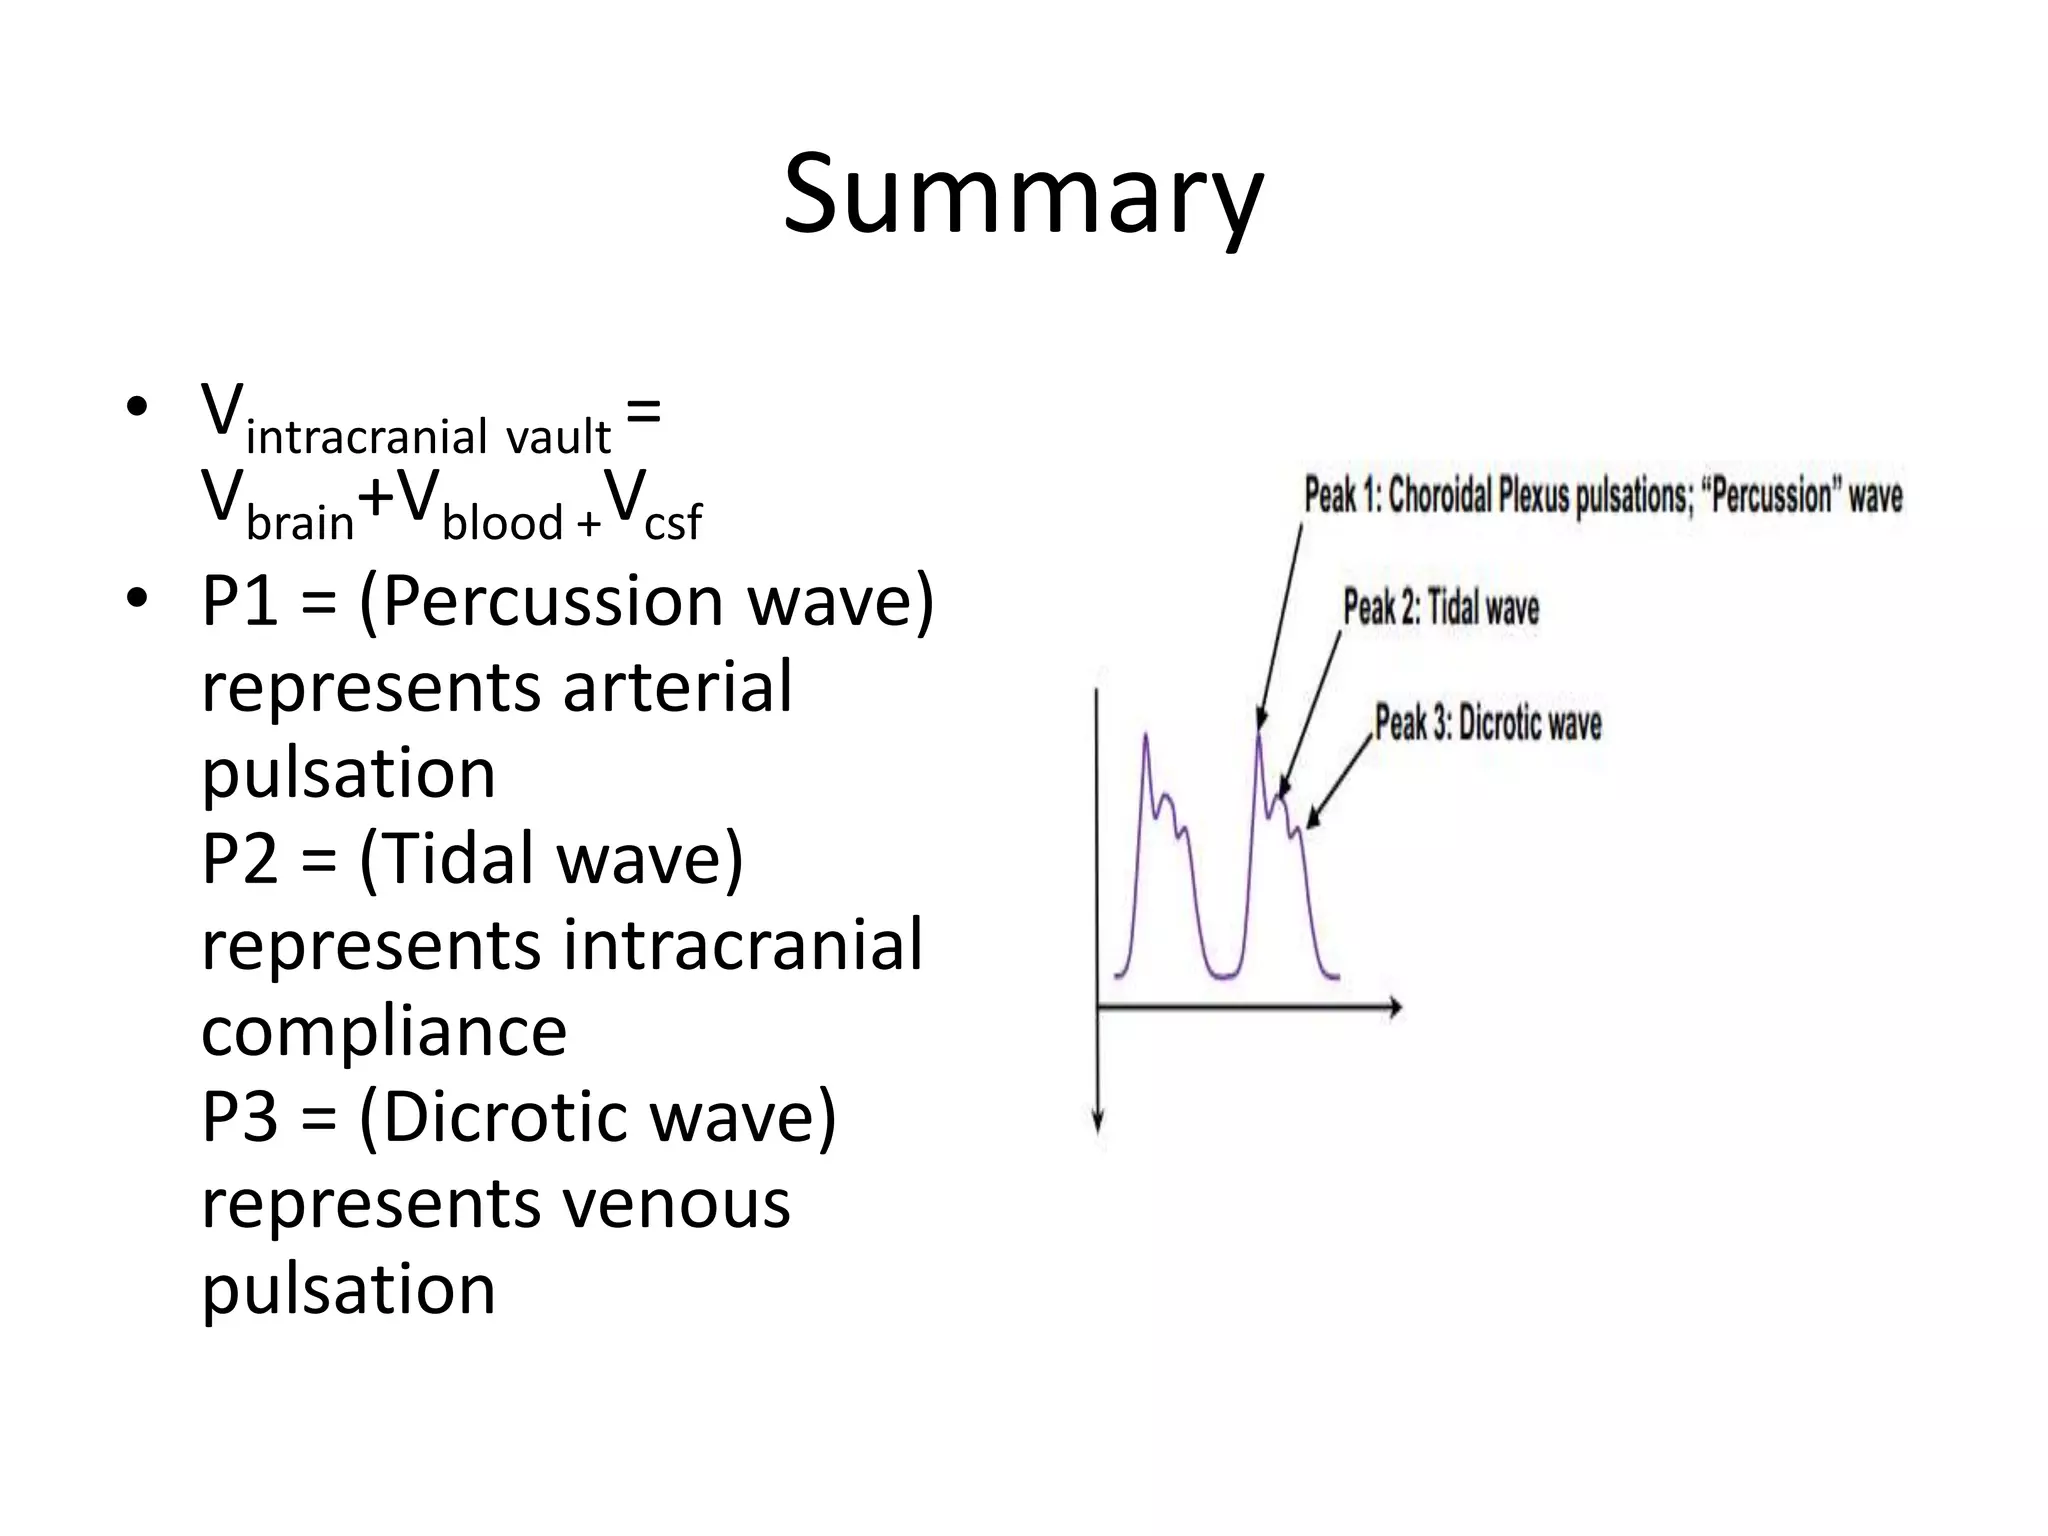
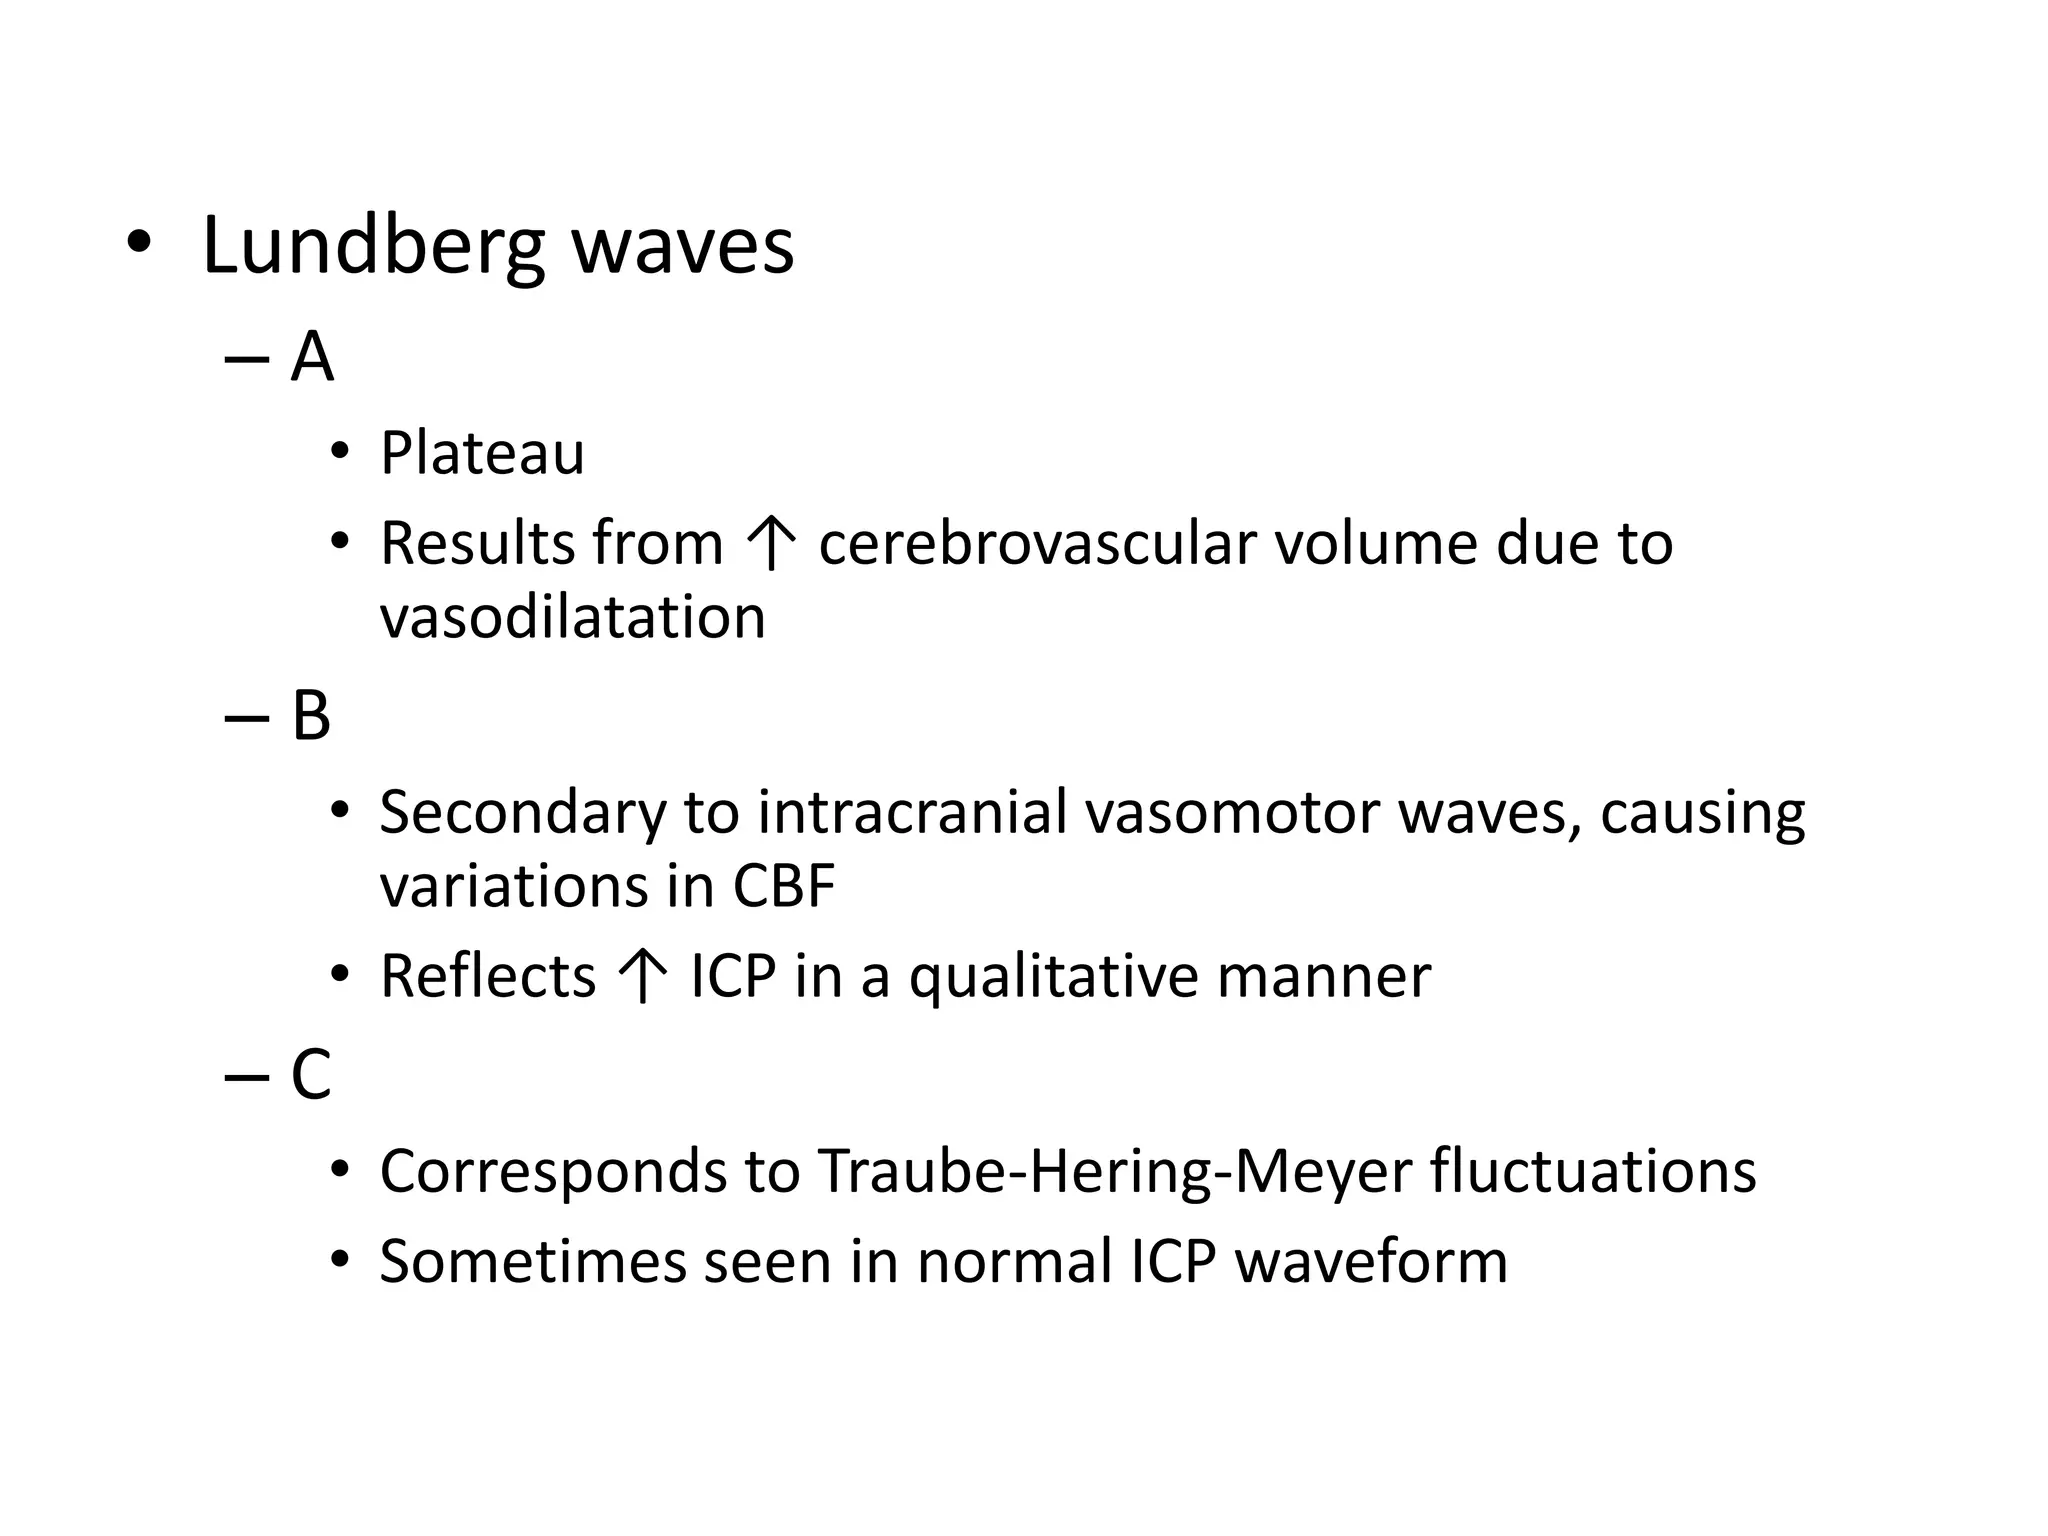
ICP waveforms & monitoring
Dr. Joe M Das
• Physiology
• Waveforms
• Monitoring
Physiology
Vintracranial vault=Vbrain+Vblood +Vcsf
• “compliance reflects the
ability of the intracranial
system to compensate for
increases in volume
without subsequent
increases in ICP. When
compliance is decreased,
even small increases in
intracranial volume
result in large increases
in ICP.”
Normal ICP
• It is difficult to establish a universal “normal
value” for ICP as it depends on age, body posture
and clinical conditions.
• The upper limit of normal ICP – 15 mm Hg
(5 – 10 mm Hg)
• Physiologic increase – Coughing, sneezing – 30-50
mm Hg
• ICP = CSF pressure – The pressure that must be
exerted against a needle introduced into the CSF
space to just prevent escape of fluid
ICP waveforms
ICP monitoring waveforms
Flow of 3 upstrokes in one wave.
P1 = (Percussion wave) represents arterial pulsation
P2 = (Tidal wave) represents intracranial compliance
P3 = (Dicrotic wave) represents venous pulsation
In normal ICP waveform P1 should have highest
upstroke, P2 in between and P3 should show lowest
upstroke.

On eyeballing the monitor, if P2 is higher than P1 - it
indicates intracranial hypertension.
Related to
• Cardiac cycle : within individual waves
• Respiratory cycle : between consecutive waves
• ICP waveform – pulsatile
• Baseline is referred to as ICP
• Magnitude of baseline, amplitude &
periodicity of pulsatile components
• Earliest sign of ↑ ICP – Changes in pulsatile
components
Flat

• EVD clogged / kinked
• Patient expired
↑⁄↓ amplitude
• Increasing CSF volume
(or decreased)
• If a large volume of CSF
is drained off, the
waveform will decrease
in amplitude.
• Missing bone flap
Prominent P1 wave

• The systolic BP is too
high
Diminished P1 wave
• If the systolic BP is too
low, P1 decreases and
eventually disappears,
leaving only P2.
• P2 and P3 are not
changed by this.
Prominent P2 wave
• The mass lesion is
increasing in volume
• The intracranial
compliance has
decreased
• An inspiratory breath
hold (as ICP will also
rise)
Diminished P2 and P3 waves

• Hyperventilation
Rounded ICP waveform

• ICP critically high
Lundberg waves

Nils Lundberg
Lundberg A wave
Lundberg A waves
• Increases of ICP sustained for several minutes and
then return spontaneously to baseline, which is
slightly higher than the preceding one.
• Results from ↑ cerebrovascular volume due to
vasodilatation (Lundberg)
• Results from normal compensatory response to
decreases in CPP. Hence give vasopressors.
(Rosner) – But may enhance lesion size & edema
4 phases:
1. Drift phase : ↓ CPP → vasodilatation
2. Plateau phase : Vasodilatation → ↑ ICP
3. Ischemic response phase : ↓ CPP → Cerebral
ischemia → Brainstem vasomotor centres →
Cushing response
4. Resolution phase : Cushing response →
Restores CPP
Lundberg B wave
Lundberg B waves
• Short elevations of modest nature (10 – 20 mm
Hg)
• 0.5 – 2 Hz
• Relate to vasodilatation secondary to respiratory
fluctuations in PaCO2
• Seen in ventilated patients (?)
• Secondary to intracranial vasomotor waves,
causing variations in CBF
• Reflects ↑ ICP in a qualitative manner
Lundberg C waves
Lundberg C wave
Lundberg C waves
• More rapid sinusoidal fluctuation (0.1 Hz)
• Corresponds to Traube-Hering-Meyer
fluctuations in arterial pressure brought about
by oscillations in baroreceptor and
chemoreceptor reflex control systems
• Sometimes seen in normal ICP waveform
• High amplitude – pre-terminal, seen on top of
A waves
ICP monitoring
Why look at ICP waveform analysis?
“…provides information about intracranial
dynamics that can help identify individuals who
have decreased adaptive capacity and are at risk
for increases in ICP and decreases in CPP, which
may contribute to secondary brain injury and
have a negative impact on neurologic outcome.”
C.J Kirkness et. al; J Neurosci Nurs. 2000 Oct; 32(5):271-7.
• The main indications for ICP monitoring are:
– Glasgow Coma Scale (GCS ) < 8
– Posturing (extension, flexion)
– Bilateral or unilateral pupil dilation (except with
Epidural Hematomas)
– CT Scan results showing edema and/or mid-line
shift
– Physical assessment /neurological assessment
findings which indicate a need for monitoring
• Contraindications:
– Awake patient
– Coagulopathy
Methods of ICP
measurement
• Technology
–
–
–
–

external strain gauge
catheter tip (internal)
strain gauge
fibre-optic

• Location
–
–
–
–
–

Ventricular (EVD/IVC)
Intraparenchymal
Subarachnoid
Subdural/Extradural
External Fontanelle
External Ventricular Drain
• EVD connected to external strain gauge is the
gold standard for measuring ICP
• Tip in foramen of Monro
• Extensive history, low cost, reliability,
therapeutic
• Success rate of cannulation – 82%
• Malposition: 4 – 20%
– Did not have significant clinical sequelae

• Occlusion : By brain matter / blood clots
– Flush EVD

• Hemorrhage : 0 – 15% (1.1%)
– Most asymptomatic
– Intervention in 0.5%
• Infection : 0 – 22% (8.8%)
– Risk factors : IVH, SAH, craniotomy, CSF leakage,
systemic infection, depressed skull #
– Duration of catheterization & irrigation of catheter
– Venue of insertion – No difference
– Extended tunneling
• Sandalcioglu - <5 vs >5 cm – 83% vs 17%
• Leung – No difference

– Prophylactic catheter exchange : No difference
– Prophylactic antibiotics:
• Periprocedural vs none – No difference
• Periprocedural vs entire duration – No difference
• Guidelines for the Management of Severe Traumatic
Brain Injury – No antibiotic prophylaxis

– Antibiotic impregnated catheter:
• Rifampin + Minocycline (Zabramski) – 9.4 to 1.3%
• Cost
When to pull the EVD out?
• CT evidence of resolution of cerebral oedema,
and
• Improvement of ICP (consistently under 2025)
• Or if the EVD is infected.
Fibreoptic ICP monitor
• Catheter tip measures the amount of light
reflected off a pressure sensitive diaphragm
• Intraparenchymal Camino ICP monitor
– Ease of insertion – Right frontal
– Also in the region with pathology
– Can be inserted in severely compressed ventricles or
those with midline shift
– Low risk of hemorrhage and infection
– Zero drift: Recalibration cannot be performed
• 2 mm Hg (first 24 hrs); 1 mm Hg (first 5 days) – Manufacturer
• 0.5 – 3.2 mm Hg drift - Actual
Miniature Strain Gauge
• Codman MicroSensor ICP Transducer
– Microchip pressure sensor at the tip of a flexible
nylon cable that produces different electricity
based on pressure
• Intraventricular (Correlation coefficient 0.97 with EVD,
Drift 0.2 mm Hg)
• Intraparenchymal (Less accurate)
• Subdural space (Not enough studies)
• Spiegelberg Parenchymal Transducer
– Air pouch at the tip that is maintained at constant
volume
– Pressure transducer located in ICP monitor
– Recalibration can be made easily
– Good correlation with ICP measured by
ventriculostomy
• Compliance Monitor
– Experimental stage
– Change in volume per unit change in pressure
– Spielberg compliance monitor injects small
amount of air into the air balloon pouch and
measures the pressure response to this change in
volume
– Inverse relationship between compliance and ICP
• Noninvasive ICP monitoring
– CT, clinical examination, monitoring pressure in
epidural space
– Optic Nerve Sheath Diameter (ONSD)
• Measured by ultrasound
• Critical value is different in different studies

– Venous Opening Pressure (VOP)
• Measured by venous ophthalmodynamometry
• Requires dilatation of pupil
• Performed intermittently – Only screening purpose

– Cochlear fluid pressure, Flow velocity in intracranial
arteries, Delay in VEPs
• Pediatric ICP monitoring
– ICP monitoring only as an option for treating
patients with severe traumatic brain injury
(GCS < 8)
– Similar complication rates as in adults
Summary
• Vintracranial vault =
Vbrain+Vblood +Vcsf
• P1 = (Percussion wave)
represents arterial
pulsation
P2 = (Tidal wave)
represents intracranial
compliance
P3 = (Dicrotic wave)
represents venous
pulsation
• Lundberg waves
–A
• Plateau
• Results from ↑ cerebrovascular volume due to
vasodilatation

–B
• Secondary to intracranial vasomotor waves, causing
variations in CBF
• Reflects ↑ ICP in a qualitative manner

–C
• Corresponds to Traube-Hering-Meyer fluctuations
• Sometimes seen in normal ICP waveform
Summary
• ICP monitoring & ICP-directed treatment remains the
cornerstone of neurocritical care
• EVD connected to external strain gauge remains the
most reliable, cost-effective and accurate method for
monitoring ICP
– Allows CSF drainage
– Infection and hemorrhage are the main problems

• Intraparenchymal monitors are gaining popularity
– Easy to insert, low complication rates
– Zero drift, mechanical failure are the problems

• New technologies including the non-invasive ones are
emerging
References
• Handbook of Neurosurgery, Mark S Greenberg
• Youmans Neurological Surgery, 6th edition
•
Intracranial pressure - waveforms and monitoring

Intracranial pressure - waveforms and monitoring

  • 1.
    ICP waveforms &monitoring Dr. Joe M Das
  • 2.
  • 3.
  • 5.
  • 8.
    • “compliance reflectsthe ability of the intracranial system to compensate for increases in volume without subsequent increases in ICP. When compliance is decreased, even small increases in intracranial volume result in large increases in ICP.”
  • 9.
    Normal ICP • Itis difficult to establish a universal “normal value” for ICP as it depends on age, body posture and clinical conditions. • The upper limit of normal ICP – 15 mm Hg (5 – 10 mm Hg) • Physiologic increase – Coughing, sneezing – 30-50 mm Hg • ICP = CSF pressure – The pressure that must be exerted against a needle introduced into the CSF space to just prevent escape of fluid
  • 10.
  • 11.
    ICP monitoring waveforms Flowof 3 upstrokes in one wave. P1 = (Percussion wave) represents arterial pulsation P2 = (Tidal wave) represents intracranial compliance P3 = (Dicrotic wave) represents venous pulsation In normal ICP waveform P1 should have highest upstroke, P2 in between and P3 should show lowest upstroke. On eyeballing the monitor, if P2 is higher than P1 - it indicates intracranial hypertension.
  • 13.
    Related to • Cardiaccycle : within individual waves • Respiratory cycle : between consecutive waves
  • 15.
    • ICP waveform– pulsatile • Baseline is referred to as ICP • Magnitude of baseline, amplitude & periodicity of pulsatile components • Earliest sign of ↑ ICP – Changes in pulsatile components
  • 16.
    Flat • EVD clogged/ kinked • Patient expired
  • 17.
    ↑⁄↓ amplitude • IncreasingCSF volume (or decreased) • If a large volume of CSF is drained off, the waveform will decrease in amplitude. • Missing bone flap
  • 18.
    Prominent P1 wave •The systolic BP is too high
  • 19.
    Diminished P1 wave •If the systolic BP is too low, P1 decreases and eventually disappears, leaving only P2. • P2 and P3 are not changed by this.
  • 20.
    Prominent P2 wave •The mass lesion is increasing in volume • The intracranial compliance has decreased • An inspiratory breath hold (as ICP will also rise)
  • 21.
    Diminished P2 andP3 waves • Hyperventilation
  • 22.
    Rounded ICP waveform •ICP critically high
  • 23.
  • 25.
  • 26.
    Lundberg A waves •Increases of ICP sustained for several minutes and then return spontaneously to baseline, which is slightly higher than the preceding one. • Results from ↑ cerebrovascular volume due to vasodilatation (Lundberg) • Results from normal compensatory response to decreases in CPP. Hence give vasopressors. (Rosner) – But may enhance lesion size & edema
  • 27.
    4 phases: 1. Driftphase : ↓ CPP → vasodilatation 2. Plateau phase : Vasodilatation → ↑ ICP 3. Ischemic response phase : ↓ CPP → Cerebral ischemia → Brainstem vasomotor centres → Cushing response 4. Resolution phase : Cushing response → Restores CPP
  • 29.
  • 30.
    Lundberg B waves •Short elevations of modest nature (10 – 20 mm Hg) • 0.5 – 2 Hz • Relate to vasodilatation secondary to respiratory fluctuations in PaCO2 • Seen in ventilated patients (?) • Secondary to intracranial vasomotor waves, causing variations in CBF • Reflects ↑ ICP in a qualitative manner
  • 31.
  • 32.
  • 33.
    Lundberg C waves •More rapid sinusoidal fluctuation (0.1 Hz) • Corresponds to Traube-Hering-Meyer fluctuations in arterial pressure brought about by oscillations in baroreceptor and chemoreceptor reflex control systems • Sometimes seen in normal ICP waveform • High amplitude – pre-terminal, seen on top of A waves
  • 34.
  • 35.
    Why look atICP waveform analysis? “…provides information about intracranial dynamics that can help identify individuals who have decreased adaptive capacity and are at risk for increases in ICP and decreases in CPP, which may contribute to secondary brain injury and have a negative impact on neurologic outcome.” C.J Kirkness et. al; J Neurosci Nurs. 2000 Oct; 32(5):271-7.
  • 36.
    • The mainindications for ICP monitoring are: – Glasgow Coma Scale (GCS ) < 8 – Posturing (extension, flexion) – Bilateral or unilateral pupil dilation (except with Epidural Hematomas) – CT Scan results showing edema and/or mid-line shift – Physical assessment /neurological assessment findings which indicate a need for monitoring
  • 37.
    • Contraindications: – Awakepatient – Coagulopathy
  • 38.
    Methods of ICP measurement •Technology – – – – external strain gauge catheter tip (internal) strain gauge fibre-optic • Location – – – – – Ventricular (EVD/IVC) Intraparenchymal Subarachnoid Subdural/Extradural External Fontanelle
  • 39.
    External Ventricular Drain •EVD connected to external strain gauge is the gold standard for measuring ICP • Tip in foramen of Monro • Extensive history, low cost, reliability, therapeutic • Success rate of cannulation – 82%
  • 41.
    • Malposition: 4– 20% – Did not have significant clinical sequelae • Occlusion : By brain matter / blood clots – Flush EVD • Hemorrhage : 0 – 15% (1.1%) – Most asymptomatic – Intervention in 0.5%
  • 42.
    • Infection :0 – 22% (8.8%) – Risk factors : IVH, SAH, craniotomy, CSF leakage, systemic infection, depressed skull # – Duration of catheterization & irrigation of catheter – Venue of insertion – No difference – Extended tunneling • Sandalcioglu - <5 vs >5 cm – 83% vs 17% • Leung – No difference – Prophylactic catheter exchange : No difference
  • 43.
    – Prophylactic antibiotics: •Periprocedural vs none – No difference • Periprocedural vs entire duration – No difference • Guidelines for the Management of Severe Traumatic Brain Injury – No antibiotic prophylaxis – Antibiotic impregnated catheter: • Rifampin + Minocycline (Zabramski) – 9.4 to 1.3% • Cost
  • 44.
    When to pullthe EVD out? • CT evidence of resolution of cerebral oedema, and • Improvement of ICP (consistently under 2025) • Or if the EVD is infected.
  • 45.
    Fibreoptic ICP monitor •Catheter tip measures the amount of light reflected off a pressure sensitive diaphragm • Intraparenchymal Camino ICP monitor – Ease of insertion – Right frontal – Also in the region with pathology – Can be inserted in severely compressed ventricles or those with midline shift – Low risk of hemorrhage and infection – Zero drift: Recalibration cannot be performed • 2 mm Hg (first 24 hrs); 1 mm Hg (first 5 days) – Manufacturer • 0.5 – 3.2 mm Hg drift - Actual
  • 47.
    Miniature Strain Gauge •Codman MicroSensor ICP Transducer – Microchip pressure sensor at the tip of a flexible nylon cable that produces different electricity based on pressure • Intraventricular (Correlation coefficient 0.97 with EVD, Drift 0.2 mm Hg) • Intraparenchymal (Less accurate) • Subdural space (Not enough studies)
  • 48.
    • Spiegelberg ParenchymalTransducer – Air pouch at the tip that is maintained at constant volume – Pressure transducer located in ICP monitor – Recalibration can be made easily – Good correlation with ICP measured by ventriculostomy
  • 50.
    • Compliance Monitor –Experimental stage – Change in volume per unit change in pressure – Spielberg compliance monitor injects small amount of air into the air balloon pouch and measures the pressure response to this change in volume – Inverse relationship between compliance and ICP
  • 51.
    • Noninvasive ICPmonitoring – CT, clinical examination, monitoring pressure in epidural space – Optic Nerve Sheath Diameter (ONSD) • Measured by ultrasound • Critical value is different in different studies – Venous Opening Pressure (VOP) • Measured by venous ophthalmodynamometry • Requires dilatation of pupil • Performed intermittently – Only screening purpose – Cochlear fluid pressure, Flow velocity in intracranial arteries, Delay in VEPs
  • 52.
    • Pediatric ICPmonitoring – ICP monitoring only as an option for treating patients with severe traumatic brain injury (GCS < 8) – Similar complication rates as in adults
  • 53.
    Summary • Vintracranial vault= Vbrain+Vblood +Vcsf • P1 = (Percussion wave) represents arterial pulsation P2 = (Tidal wave) represents intracranial compliance P3 = (Dicrotic wave) represents venous pulsation
  • 54.
    • Lundberg waves –A •Plateau • Results from ↑ cerebrovascular volume due to vasodilatation –B • Secondary to intracranial vasomotor waves, causing variations in CBF • Reflects ↑ ICP in a qualitative manner –C • Corresponds to Traube-Hering-Meyer fluctuations • Sometimes seen in normal ICP waveform
  • 55.
    Summary • ICP monitoring& ICP-directed treatment remains the cornerstone of neurocritical care • EVD connected to external strain gauge remains the most reliable, cost-effective and accurate method for monitoring ICP – Allows CSF drainage – Infection and hemorrhage are the main problems • Intraparenchymal monitors are gaining popularity – Easy to insert, low complication rates – Zero drift, mechanical failure are the problems • New technologies including the non-invasive ones are emerging
  • 56.
    References • Handbook ofNeurosurgery, Mark S Greenberg • Youmans Neurological Surgery, 6th edition •