Fatigue Crack Analysis Using Acoustic Emission
•
0 likes•68 views

https://irjet.net/archives/V4/i1/IRJET-V4I1211.pdf

Recommended
Recommended
More Related Content
What's hot
What's hot (10)
Similar to Fatigue Crack Analysis Using Acoustic Emission
Similar to Fatigue Crack Analysis Using Acoustic Emission (20)
More from IRJET Journal
More from IRJET Journal (20)
Recently uploaded
Recently uploaded (20)
Fatigue Crack Analysis Using Acoustic Emission
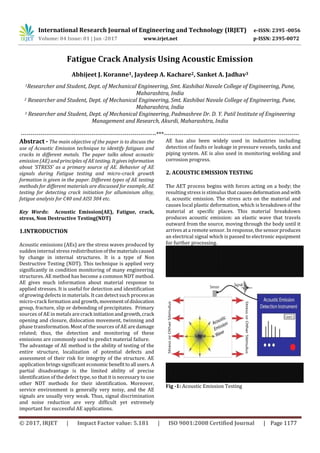
- 1. International Research Journal of Engineering and Technology (IRJET) e-ISSN: 2395 -0056 Volume: 04 Issue: 01 | Jan -2017 www.irjet.net p-ISSN: 2395-0072 © 2017, IRJET | Impact Factor value: 5.181 | ISO 9001:2008 Certified Journal | Page 1177 Fatigue Crack Analysis Using Acoustic Emission Abhijeet J. Koranne1, Jaydeep A. Kachare2, Sanket A. Jadhav3 1Researcher and Student, Dept. of Mechanical Engineering, Smt. Kashibai Navale College of Engineering, Pune, Maharashtra, India 2 Researcher and Student, Dept. of Mechanical Engineering, Smt. Kashibai Navale College of Engineering, Pune, Maharashtra, India 3 Researcher and Student, Dept. of Mechanical Engineering, Padmashree Dr. D. Y. Patil Institute of Engineering Management and Research, Akurdi, Maharashtra, India ---------------------------------------------------------------------***--------------------------------------------------------------------- Abstract - The main objective of the paper is to discuss the use of Acoustic Emission technique to identify fatigues and cracks in different metals. The paper talks about acoustic emission (AE) and principles of AE testing. Itgivesinformation about ‘STRESS’ as a primary source of AE. Behavior of AE signals during Fatigue testing and micro-crack growth formation is given in the paper. Different types of AE testing methods for different materials are discussed for example, AE testing for detecting crack initiation for alluminium alloy, fatigue analysis for C40 and AISI 304 etc. Key Words: Acoustic Emission(AE), Fatigue, crack, stress, Non Destructive Testing(NDT) 1.INTRODUCTION Acoustic emissions (AEs) are the stress waves produced by sudden internal stress redistributionofthematerialscaused by change in internal structures. It is a type of Non Destructive Testing (NDT). This technique is applied very significantly in condition monitoring of many engineering structures. AE method has become a common NDT method. AE gives much information about material response to applied stresses. It is useful for detection and identification of growing defects in materials. It can detect such process as micro-crack formation and growth,movementofdislocation group, fracture, slip or debonding of precipitates. Primary sources of AE in metals arecrack initiationandgrowth,crack opening and closure, dislocation movement, twinning and phase transformation. Most of the sources of AE are damage related; thus, the detection and monitoring of these emissions are commonly used to predict material failure. The advantage of AE method is the ability of testing of the entire structure, localization of potential defects and assessment of their risk for integrity of the structure. AE application brings significant economic benefittoall users.A partial disadvantage is the limited ability of precise identification of the defect type, so that it is necessary to use other NDT methods for their identification. Moreover, service environment is generally very noisy, and the AE signals are usually very weak. Thus, signal discrimination and noise reduction are very difficult yet extremely important for successful AE applications. AE has also been widely used in industries including detection of faults or leakage in pressure vessels, tanks and piping system. AE is also used in monitoring welding and corrosion progress. 2. ACOUSTIC EMISSION TESTING The AET process begins with forces acting on a body; the resulting stress is stimulus thatcausesdeformationand with it, acoustic emission. The stress acts on the material and causes local plastic deformation, which is breakdown of the material at specific places. This material breakdown produces acoustic emission: an elastic wave that travels outward from the source, moving through the body until it arrives at a remote sensor. In response, the sensor produces an electrical signal which is passed to electronic equipment for further processing. Fig -1: Acoustic Emission Testing
- 2. International Research Journal of Engineering and Technology (IRJET) e-ISSN: 2395 -0056 Volume: 04 Issue: 01 | Jan -2017 www.irjet.net p-ISSN: 2395-0072 © 2017, IRJET | Impact Factor value: 5.181 | ISO 9001:2008 Certified Journal | Page 1178 3. ACOUSTIC EMISSION SOURCES As previously mentioned, AE process begins with stress. Depending on its directional properties, stress may be described as tensile, compressive bending, shear or torsion. In response to stress, the structureofthematerial changesin shape. It may deform elastically or plastically. On the atomic scale, plastic deformation involves the sliding of atomic planes over one another through dislocations. The movement of dislocation is the microscopic mechanism that underlies a gross change in shape that are recognize as yielding, buckling, denting etc.Acoustic Emissionsthat result from the movement of dislocation have been extensively used and studied with special laboratory techniques. When a metal is cracked, there is a different kind of acoustic emission source and this one is most important in NDT. The occurrence of a crack instantly produces newsurface.Thisis a major threat to structure integrity and is also the best recognized source of high amplitude AEs. Detection of emissions from growing cracks has been the most common goal in the many applications of AE technology. When a surface breaking crack grows, the structure opens up in response to applied forces. Therefore, cracks tend to produce higher amplitude signals that are more readily detectable. Along with large amplitude, cracks also produce small amplitude AE waves at the crack tip. Emissioncanalso be produced by rubbing of crack surface as they open and close and grind in response to changing loads. Corrosion products forming on the crack surfaces can enhance this emission, which make the crack even more emissive. The source of the AE energy is the energy stored in the elastic stress field produced by the loading of the structure. Acoustic emission is produced at the source as a short pulse of elastic and kinetic energythattravelsthroughthematerial as an elastic wave. The amount of the acoustic emission energy released and the amplitude of the resulting wave depends on the size and the speed of the source event. The theory is that emission amplitude is proportional to area of new surface created. A sudden discrete crack event will produce a greater signal than will a slow, creeping advance of crack tip over the same distance. The theory is useful to distinguish the three different classes of source activity: Primary activity from new, permanent changes in the originally fabricated material. This is typically due to local stresses that are higher than the original stress levels. Secondary activity from materials that were not part of the original fabrication, such as corrosion products. Secondary activities from repetitive processes such ascrack surface ribbing that don’t produce new, permanent changes in the material. Secondary activity can either helpful or nuisance, depending on the way it is treated. Secondary emission is different from noise”, which is always nuisance to the AE. Fig -2: Acoustic Emission Sources 4. ACOUSTIC EMISSION DURING FATIGUE TESTING Fatigue tests are usually long term experiments. A great amount of signals including noise from the load-chain are detected by using sensitiveAEsensorsduringfatiguetesting. Hence, signal screening method should be used to remove unwanted signals. AE signals during fatigue test can be caused by various mechanisms such as dislocation movement, cyclic loading, crack initiation, crack closure and ultimate failure. For assuring safety of steel structure, we should detect and monitor cracks in the period of subcritical crack growth. Fatigue crack growing process is classified to three regions according to the change of fatigue crack growth rate. Region I is a state of crack initiation. The value of stress intensity factor is as low as fatigue threshold and crack growingspeed is very slow. In region II, crack growing speed increases according to the crack length. Stress intensity factor and crack growth rate showthe relationshipofdirectproportion. It is well known as Paris' equation. The crack growing condition in region II is so called stable crack growth. In region III, crack growth rate quickly increases and the member is about to failure. It iscalledunstablecrack growth. A boundary between region II and region III is called transition point and stress intensity factor at failureiscalled fracture toughness. AE monitoring of structural fatigue is of special interest.The emission behavior of growing fatigue cracks has been
- 3. International Research Journal of Engineering and Technology (IRJET) e-ISSN: 2395 -0056 Volume: 04 Issue: 01 | Jan -2017 www.irjet.net p-ISSN: 2395-0072 © 2017, IRJET | Impact Factor value: 5.181 | ISO 9001:2008 Certified Journal | Page 1179 extensively studied. Fig -3: AE Waves growing from Fatigue Cracks. This diagram shows that both the crack length and the accumulated total of the emission detected. The emission began with crack initiation, and then tracked rather closely with the growth of the crack, increasing as the crack propagated more rapidly toward failure. By using cyclic loading using fixed load amplitude, it was found that the primary emission from active crack growth occurred only at peak load levels. In fact, Fig.1 shows only the emission that occurred at peak load levels; secondary emission and noise that occurred at lower load levels were outside the gate threshold level. At first, when the crack was still small, not every cycle produced emissions. However, as the crack approached the critical length for unstable propagation, every cycle produced emissions. The primary emission from growing fatigue crack can result from two sources. First, there may be emissive particles, typically nonmetallic inclusions, in the stress concentrated region near the crack tip. As the crack advances towards these particles, the local stress level rise, and their breaking will produce a primary emission. The other source is the movement of crack tip itself. Crack tip movement istypically taking place in a mixed mode: some of the new surface is created by dislocation activity and some of it is created by small scale cleavage, a sudden separation of thematerial ina region of local weakness. Crack tip movement by dislocation activity is typically not detectable, but cleavage is an abrupt and relatively gross mechanism that produces plenty of AE energy in the normally detectable range. Secondary activity from crack face friction is also often observed in AE monitoring of fatigue cracks. In constant cycle fatigue, this activity often produces just the same signal, cycle after cycle, at intermediate load levels. This secondary emission may continue for hundreds or thousands of cycles, then die out only to start again later in the test. The best explanation is that rubbing of rough spots on the crack surface as indicated produces this. It has also been suggested that the recently created surfaces at the crack tip may stick together, and then break apart again as crack tip opens and closes. Theoretical relationships betweenAEandcrack propagation rates have been developed. Extensive research work has been done on AE from constant cycle fatigue. Distinguishing between primary and secondary emissions is easy in case of constant cycle fatigue. Crack free movement, either due to friction or to fresh growth, is an undesirable and probably deteriorating condition in the material that should be correct. 5. ADVANTAGES AND DIS-ADVANTAGES In contrast with most other NDT methods, in AE testing, the discontinuity itself is the release of energy making its own signals in response to stress. AE testing detects moments while other methods detects geometrical discontinuities. 5.1 ADVANTAGES 1. AE can be used in all stages of testings including: Proof Testing Requalification Testing On-line monitoring of components and systems Leak detection and location In-process weld monitoring Mechanical property testing and characterization 2. Material anisotropy is good. 3. Less geometry sensitive. 4. Less intrusive. 5. Global monitoring. 6. Real time evaluation. 7. Remote scanning. 8. High Performance to price ratio. 5.2 DIS-ADVANTAGES 1. Repeatability: Acoustic emission is stress unique and each loading is different. 2. Attenuation: The structure under test will attenuate the acoustic stress wave. 3. Tests are best performed if the loading history of the structure is known. 4. Noise: Acoustic emission can be subject to extraneous noise.
- 4. International Research Journal of Engineering and Technology (IRJET) e-ISSN: 2395 -0056 Volume: 04 Issue: 01 | Jan -2017 www.irjet.net p-ISSN: 2395-0072 © 2017, IRJET | Impact Factor value: 5.181 | ISO 9001:2008 Certified Journal | Page 1180 6. CONCLUSION The conclusion of this work is the need arises to extend these considerations and results to other types of composite materials, by changing stacking sequence, reinforcement matrix and polymer matrix. This study can be considered as a good methodological as for what is to be expected by AE monitoring of the loading, allowing the discernment between the different damage models. It can be studied for more specific change in frequency ranges and possibly signal magnitude of the AE for the different damage modes in lap joints with complex reinforcement architectures. In future, along with the different types of attachments, mechanical fasteners like bolts and rivets can also be added and the results can be compared with simple aluminium attachment test results to know the ultimate strength and failure modes. 7. REFERENCES [1]. P. Mazal, F. Vlasic, V. Koula “Use of acoustic emission method for identification of fatigue Micro-cracks creation.” Brno University of Technology, Faculty of Mechanical Engineering, Technicka 2, CZ 616 69 Brno, Czech RepublicbZD Rpety, Dakel, Ohrobecká 408, CZ 142 00 Praha 4, Czech Republic, 6th Fatigue Design conference, Fatigue Design 2015, Procedia Engineering 133 (2015) 379 – 388. [2]. X. Wanga, E. K. Hermann Saljea, X. Dinga, J. Suna, “Detection of yield point behavior by acoustic emission in thin films”, International Conference on Martensitic Transformations, ICOMAT-2014, Materials Today: Proceedings 2S (2015) S535 – S539 [3]. Azadeh Keshtgar, Mohammad Modarres “Detecting Crack Initiation Based on Acoustic Emission”, Chemical Engineering Transactions, Vol. 33, 2013 [4]. Zhi Chen, Dongsheng Li, Yunyu Li, Quanming Feng, School of Civil Engineering, Dalian University of Technology, Dalian 116024, China, “Damage analysis of FRP/steel composite plates using acoustic Emission”, Pacific Science Review 16 (2014) 193e200 [5]. G. La. Rosa, C. Clienti, F. Lo Savio, Department of Industrial Engineering, University of Catania, Viale Andrea Doria, 6-95125 Catania, Italy, “Fatigue Analysis by Acoustic Emission and Thermographic Techniques”, XVII International Colloquium on Mechanical Fatigue of Metals (ICMFM17), Procedia Engineering 74(2014) 261- 268. [6]. Qin Hongwu, Zhang Chao, Zhang Xian, Fan Qinyin, College of Electronics and Information Engineering, Changchun University, Changchun, China, “Research of Acoustic Emission Testing Method with Application to monitored for Wind Turbines”, International Journal of Multimedia and Ubiquitous Engineering, Vol. 10, No. 1(2015), PP-109-118. Academic Researcher. Interested in Automobile Engineering, RoboticsandMaterial Science and Acoustics. Academic Researcher. Interested in Automobile Engineering, Fluid Mechanics. Academic Researcher. Interested in Manufacturing Processes, Material Science and Production Tehnology. 2nd Author Photo 3rd Author Photo 1’st Author Photo