Download as PDF, PPTX


![Mathematical Calculation of Rw from SSP (modified after Bateman & Konen, 1977)
Rmf at 75o
F = Rmf temp
*
x (temp + 6.77)/81.77
Correction of Rmf to 75o
K = 60 + (0.133 x Tf)
Rmfe / Rwe = 10 – SSP / K**
Rmfe = (146 x Rmf – 5) / (337 x Rmf + 77)
Rmfe formula if Rmf at 75o
F < 0.1
Rmfe = 0.85 x Rmf
Rmfe formula if Rmf at 75o
> 0.1
Rwe = Rmfe / (Rmfe / Rwe)
Rw at 75o
F = (77 x Rwe + 5) / (146 – 377 x Rwe)
Rw at 75o
formula if Rwe < 0.12
Rw at 75o
F = - [0.58 – 10 (0.69 x Rwe –0.24)
]
Rw at 75o
F formula if Rwe > 0.12
Rw at formation temperature = Rw at 75o
x 81.77 / (Tf + 6.77)
*Rmftemp = Rmf at a temperature other than 75o
F
**The e subscript (i.e. Rmfe) stands for equivalent resistivity.
69](https://image.slidesharecdn.com/interpretinggeophysicalwelllogs-180107154552/75/Interpreting-geophysical-well-logs-69-2048.jpg)


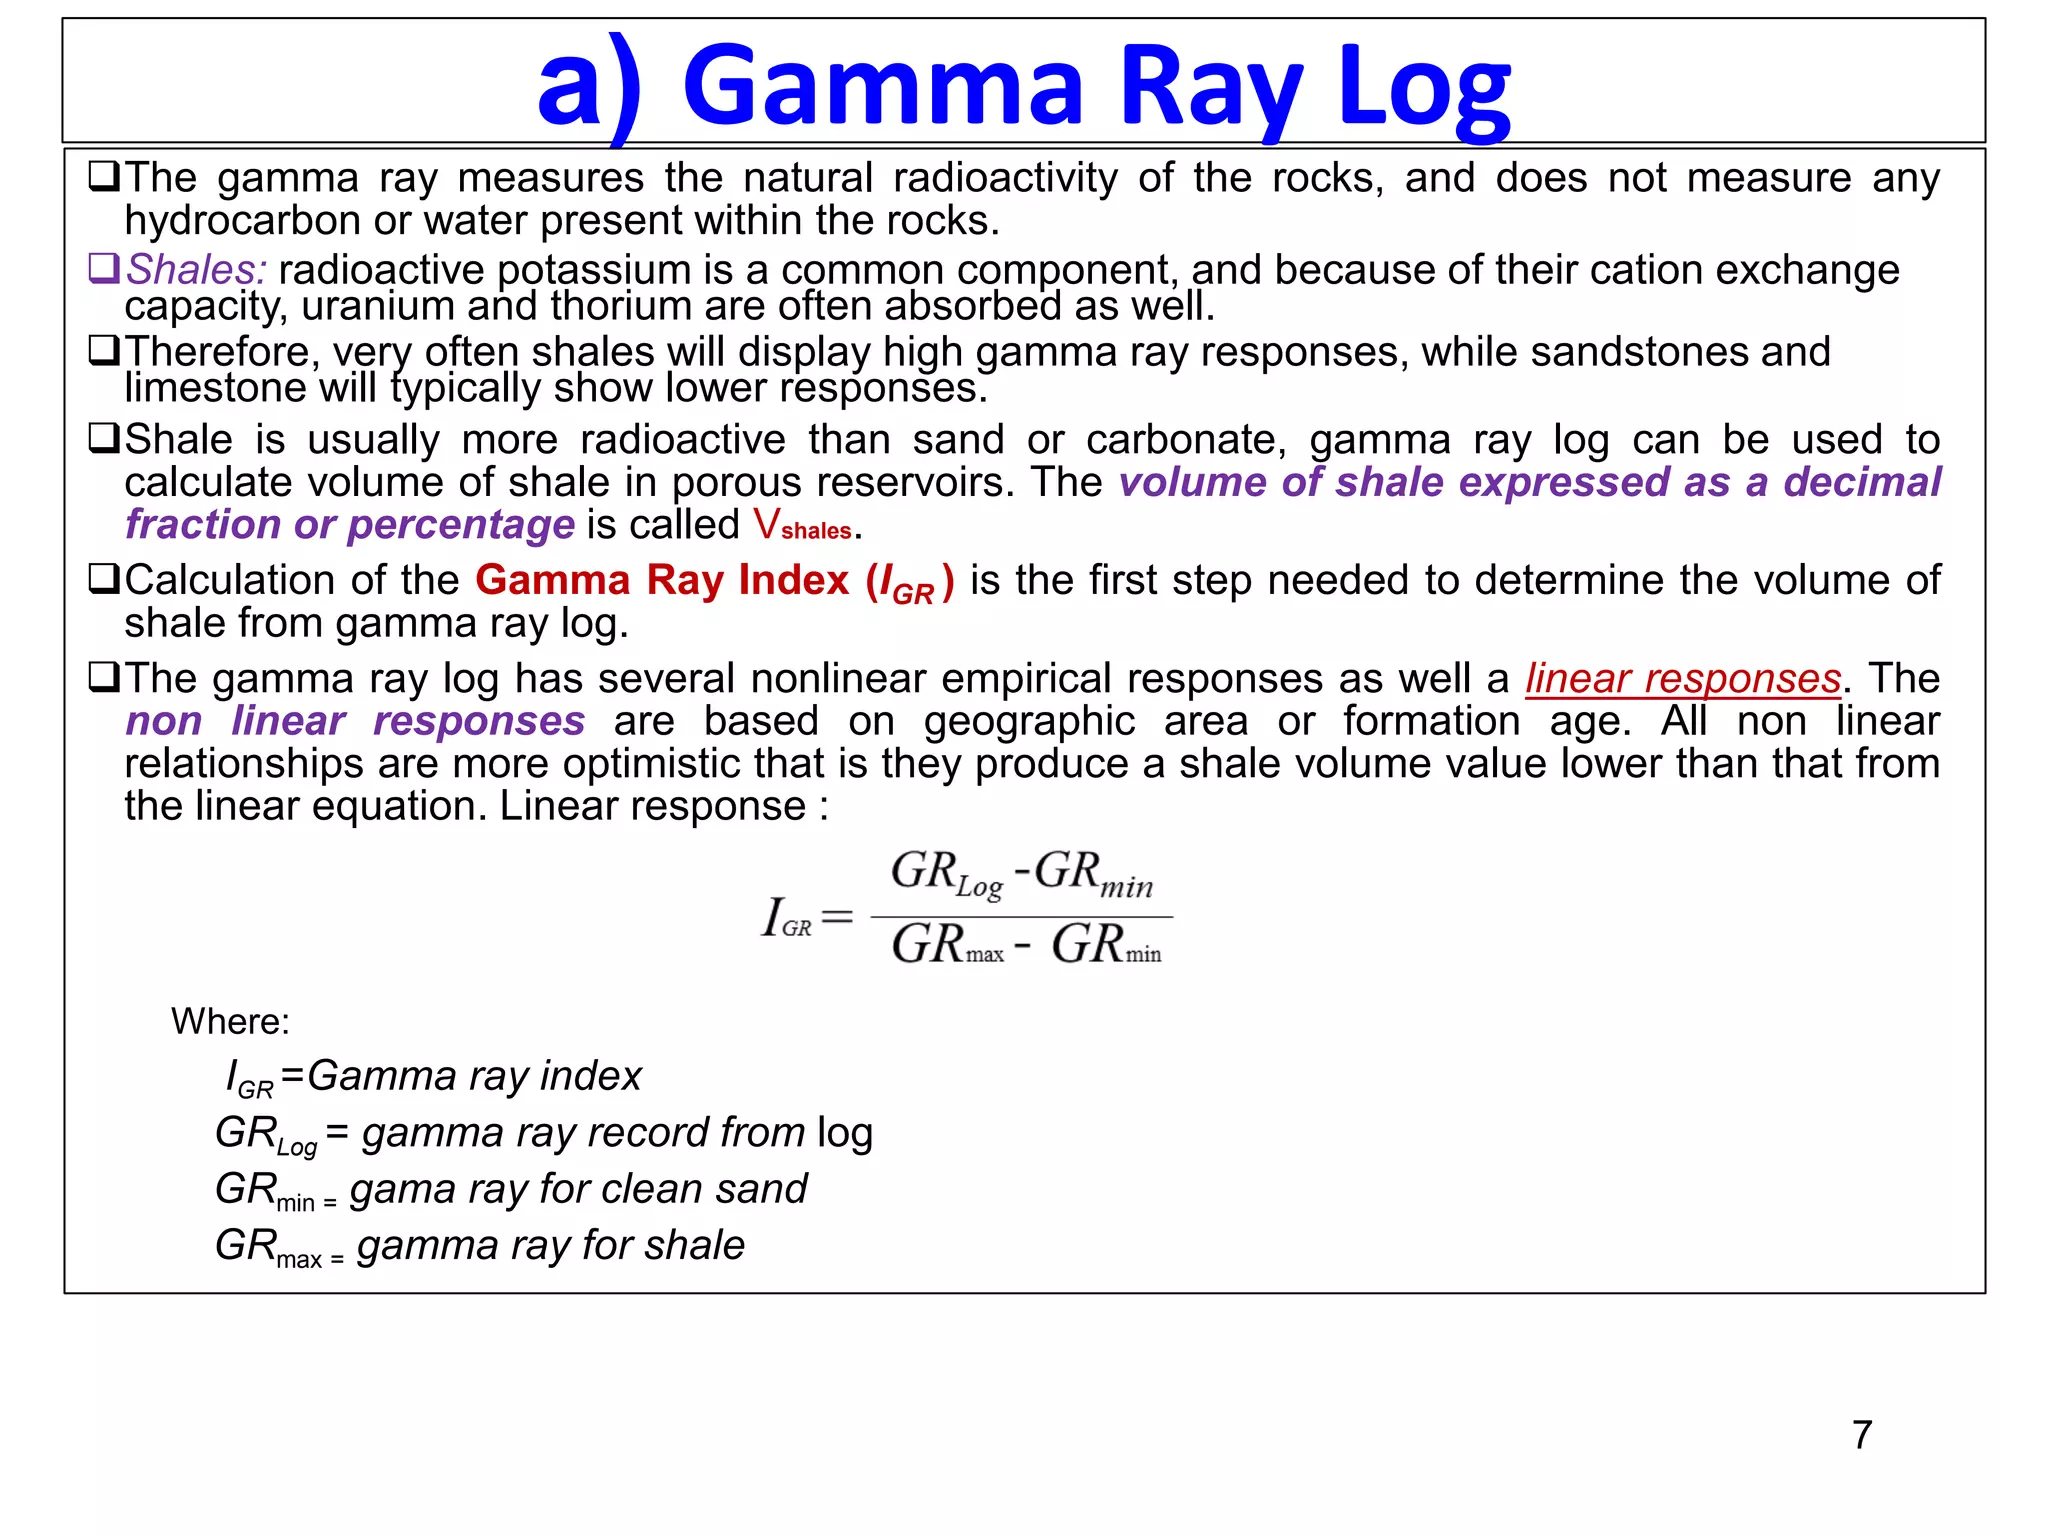
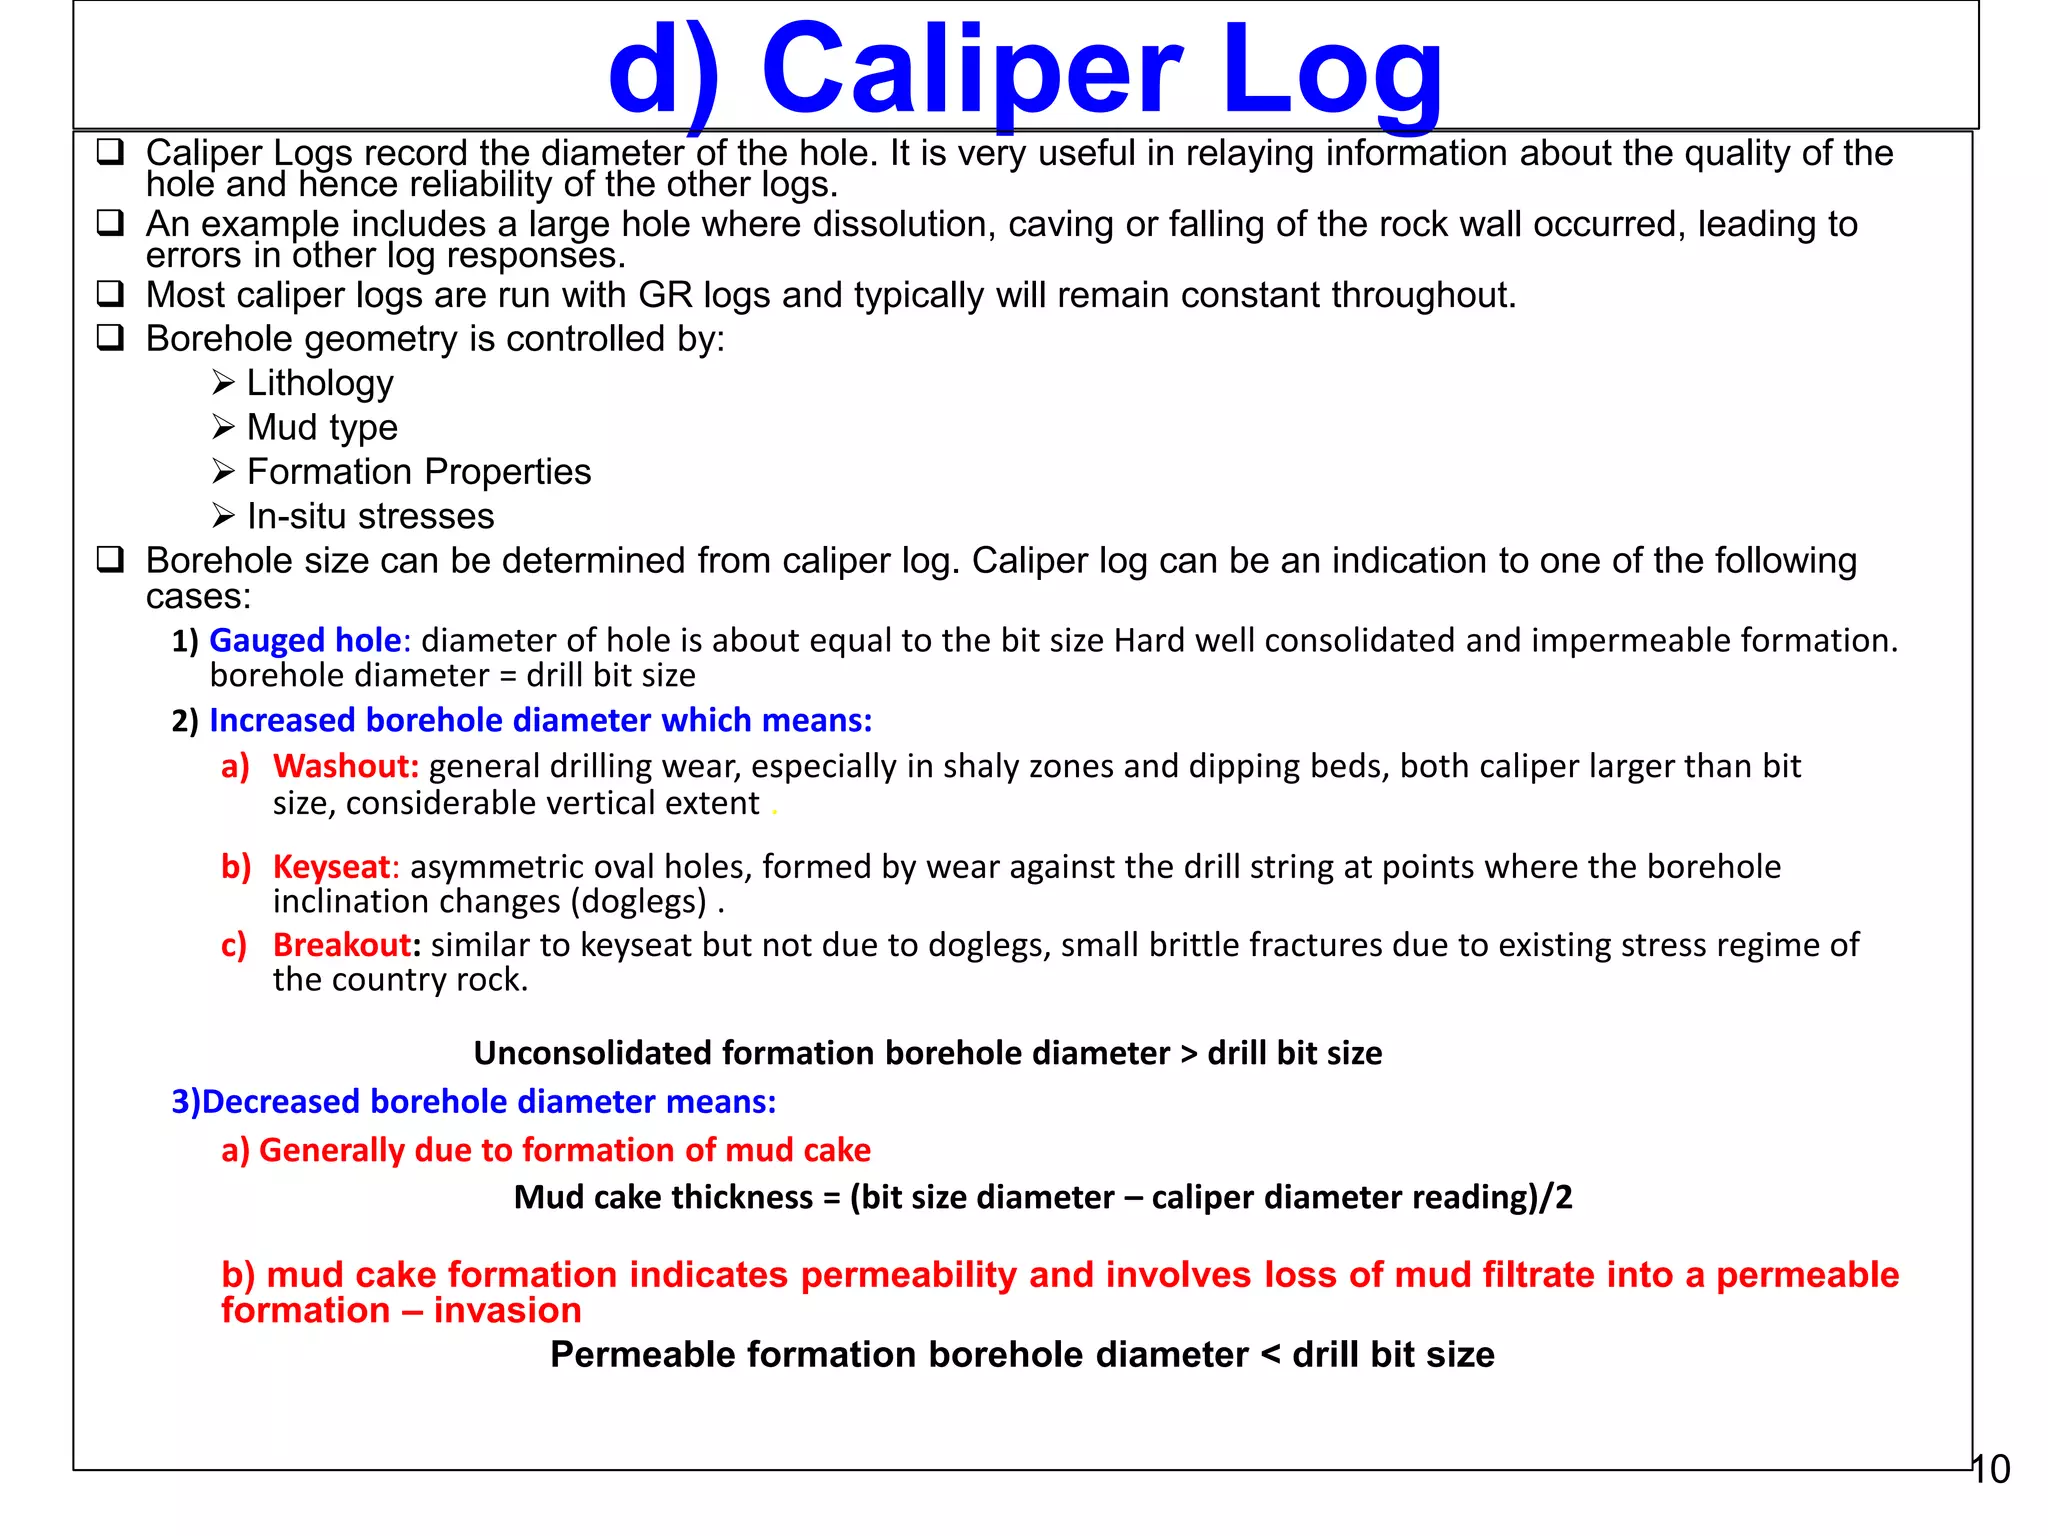
The document provides an overview of geophysical well logging, summarizing different log types such as gamma ray, sonic, density, neutron, and resistivity logs, as well as their historical context and practical applications in formation evaluation. It discusses key measurements, factors affecting log readings, and the significance of various logging tools in estimating parameters like porosity, water saturation, and lithology. Additionally, the document delves into the theoretical basis of these measurements and includes specific equations for calculating critical values like shale volume and porosity.