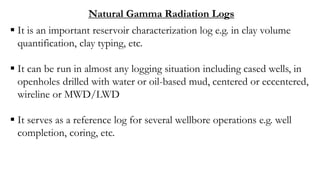
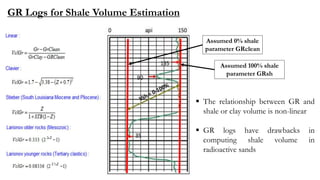
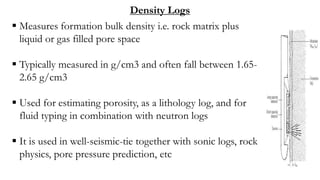
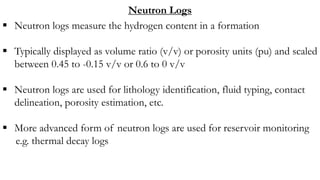
This document discusses nuclear logging methods, including gamma ray, density, and neutron logs. It provides background on how these tools work and what formation properties they measure. Gamma ray logs measure natural radioactivity to identify lithology and correlate between wells. Density logs measure bulk density and are used to estimate porosity and identify fluid types. Neutron logs measure hydrogen content to also determine porosity and fluids. The document explains the operating principles, responses, and applications of each nuclear log.
3. Nuclear methods in geophysical survey generally refers to the use of the release
or adsorption of energy resulting from nuclear processes (like fusion, fission, or
radioactive decay of unstable nuclei) in the estimation of physical properties of
materials e.g. rocks, ground water, etc.
Fission and Fusion Radioactive Decay
NUCLEAR METHODS
4. NUCLEAR METHODS
Energy Spectrum
Measurement tools are
designed to be sensitive
to distinct energy levels
Nuclear methods are
used in other fields like
medicine, power
generation, military,
archaeology, etc.
Source: http://www.solpass.org
5. RADIOMETRIC LOGGING
WELL LOGGING
METHODS
ELECTRICAL METHODS e.g.
Induction, spontaneous
potential measurements, etc.
ACOUSTIC
METHODS e.g.
transit time, VSP,
CBL, image logs,
etc.
OTHERS e.g. dip meter, caliper
logs, etc.
RADIOMETRIC
/NUCLEAR
METHODS e.g.
gamma ray,
density, neutron,
NMR, etc.
Radiometric Logging as a
Well Logging Technique
6. Natural Gamma Radiation Logs
Measures the total natural radioactivity of rock intervals within a
wellbore
Gamma rays are associated with the radioactive decay of unstable
isotopes of K, Th, and U associated with clay minerals, micas, and
heavy minerals
Typically measured in gAPI units and often fall between 0-150 gAPI
It is used for delineation of reservoir boundaries and well-to-well
correlation
7. It is an important reservoir characterization log e.g. in clay volume
quantification, clay typing, etc.
It can be run in almost any logging situation including cased wells, in
openholes drilled with water or oil-based mud, centered or eccentered,
wireline or MWD/LWD
It serves as a reference log for several wellbore operations e.g. well
completion, coring, etc.
Natural Gamma Radiation Logs
8. Background/Operating Principle
SCINTILLATOR SCHEMATIC
Photomultiplier tube
Scintillator detector is composed of a dense and transparent scintillating
crystal e.g. sodium iodide) and a photomultiplier
As a gamma ray is absorbed by sodium iodide crystal, a flash of light is
produced
The intensity of the light is proportional to the density of the absorbed
ray, and the produced light is converted to electric voltage pulse
9. Gamma ray typically follows tortuous paths to the
detector where they collide with other electrons and
loose energy
They are either absorbed completely, travel away from
detector or go unspotted by the detector
A drawback is that detector has no directionally
capability and cannot distinguish between rays from
adjacent or adjourning beds
Advanced tools have detectors that are shielded with
dense material with only a small window opened in
front of the formation
Gamma Ray Logging Operating Principle
10. The thickness and density of the material controls the depth of
“penetration” (or depth of investigation) of gamma rays e.g. in the case
of high density muds like barite
KCl muds increase gamma ray reading. In some cases doubling the
reading depending on K40 concentration
Precipitates of Radium from water in production wells also contribute
to artificial gamma ray
GR readings are affected by hole size, tool position, mud weight,
mud type, etc.
Factors affecting gamma ray readings
11. Numerous other isotopes of other elements contribute to
background radioactivity, which are either very low in concentration or
decay too slowly to be significant
Are affected by logging speed just like SP. Both logs listen and do not
have high energy sources of their own
Same formation with exactly the same mineralogy can have different
readings in separate wells due to varying hole conditions or tool
calibration differences
GR logs are often times normalized to correct for these differences
Factors affecting Gamma Ray readings
12. GR Normalization (Percentile Method)
Before Normalization
After Normalization
Shale marker bed
Source: Unpublished work
13. GR Logs for Reservoir Delineation and Correlation
Reservoir delineation and correlation is important
for:
Building 3D models of subsurface reservoirs
Understanding lateral facies changes and
building conceptual depositional models
Estimating net reservoir volume
Sharp base
Channel Sand
body
Coarsening
upward
Upper
Shoreface
sand body
Bed
boundaries
Non-
reservoir
Reservoir
14. GR Logs for Shale Volume Estimation
Assumed 100% shale
parameter GRsh
Assumed 0% shale
parameter GRclean
The relationship between GR and
shale or clay volume is non-linear
GR logs have drawbacks in
computing shale volume in
radioactive sands
15. GR Logs for Wellbore Operations
Used when choosing potential
coring intervals
For selecting perforation intervals
Used as depth reference during
production logging, completion
jobs, etc.
Perforation
Interval
Cored section
Source: Unpublished work
16. Spectral Gamma Ray Logs
Measures the energy level of each contributing
decaying isotope e.g. K40, Ur238, and Th232
Source: Developments in
Petroleum Science Vol. 62
17. Spectral Gamma Ray Logs
Higher vertical resolution (up to 1ft) than GR and about 1ft
depth of investigation
Affected by hole size and mud type (e.g. barite gamma ray
absorption and KCl mud). Less affected when tool is eccentered
Used in identifying source of radioactivity in hot sands e.g. K
Feldspars, Uranium-rich water, micas, glauconite, heavy minerals
Used for fracture identification, mineral identification/clay
typing, TOC analysis and source rock potential
18. SGR Logs for “hot sands” interpretation
Abundance of K, Th, and Ur is not
always associated with clay mineral
content e.g.
An increase in K content due to
abundance of K-feldspar in sand as
a result of sediment immaturity
Presence of Uranium rich
waters/hydrocarbon
Glauconite and Heavy minerals
Precipitation of uranium in fractures
Shale volume should be calculated using
N/D or SP for this interval
Radioactive Sand
confirmed by core,
caliper and N/D
log
Clean sandNo cave-in
Cored interval
indicates
sandstone
Source: Unpublished work
19. SGR for Shale Volume Estimation
Uranium reading can be associated with clay
mineral adsorption, but high readings are mostly
with presence of uranium-rich waters, uranium
precipitation in fractures, and high organic
content
As a result clay volume calculated from GR or
SGR is sometimes misleading in sands
SGR = K + Th + Ur
CGR = K + Th
SGR – Spectral Gamma Ray
CGR – Computed Gamma Ray
High Uranium content
21. Core Gamma Ray Scanning
Core Depth
Matching
Source: Unpublished work
Source: Developments in Petroleum Science Vol. 64
22. Density Logs
Measures formation bulk density i.e. rock matrix plus
liquid or gas filled pore space
Typically measured in g/cm3 and often fall between 1.65-
2.65 g/cm3
Used for estimating porosity, as a lithology log, and for
fluid typing in combination with neutron logs
It is used in well-seismic-tie together with sonic logs, rock
physics, pore pressure prediction, etc
23. Density Logs
Tool is composed mainly of a chemical gamma ray
source and 2 detectors (older tools used 1 detector)
The source consists of a sealed metal vessel containing a
small quantity of Cs-137, which is an unstable by-product
of nuclear reactors
Short detector (7 inches offset from source). Long
detector (16 inches offset)
Shallow DOI. 80% of short detector from 5cm into the
formation. 80% of long detector from 10cm
24. Density Logs
The distance between the near and far detectors sets the
vertical resolution, approximately 10 in
Log quality is not affected by logging speed (1300ft/hr) as
GR logs. Higher count rates are obtained because of the
presence of a radioactive source which GR does not have
25. Background/Operating Principle
Uses the fact that the scattering and
absorption of gamma rays increases with
density
Formation is bombarded with high
energy gamma rays. The amount of
attenuation is recorded by the detectors
Fundamentally the same as medical X-
rays in that both X-rays and gamma rays
are high energy electromagnetic waves
and interact with matter the same way Source: Developments in Petroleum Science Vol. 62
26. Background/Operating Principle
The number of electrons per unit
volume of a material is proportional to
its density and the number of scattering
and absorption
Therefore, the number of gamma rays
that return to the detector is a
quantitative indicator of the density of
the formation
Source: Developments in Petroleum Science Vol. 62
27. Gamma rays interact with formation in 3 ways:
Pair production : Occurs at higher energies >1MeV
Compton scattering: 2MeV to 75keV
Photoelectric effect: Occurs at low energies <100keV
Background/Operating Principle
Photon slows
down. Increased
wavelength
Knocked off
electron
28. Effect of invasion and hole rugosity
Short Detector: Better vertical resolution.
Influenced by near-wellbore environment
Long Detector: Better depth of
investigation. Less environmental effect
Density logs are often displayed together
with the borehole correction log (DRHO)
DRHO log is the difference between
recordings of the 2 detectors (If
DRHO>0.075g/cc, Then CAUTION)
Source: Developments in Petroleum Science Vol. 62
Source: http://homepages.see.leeds.ac.uk
29. Litho-Density Logs
Most density logs are concurrently
logged together with PEF logs
PEF logs are lithology logs that are
products of the interaction of low
energy gamma rays with atoms of the
formation
Litho-Density logs are also often
displayed together with the borehole
correction log (DRHO)
Source: http://homepages.see.leeds.ac.uk
31. Factors that affect Bulk Density readings
Hole rugosity
Mud type
Source-receiver offset
Applied filters
Fluid type
Type of formation (sand, shale, coal, condensed sections, etc.)
Depth
32. Lithology identification and shale volume estimation
SST
SH
TIGHT ZONE
COALY ZONE
Source: Unpublished work
Matrix
Parameter
Shale
Parameter
33. Fluid typing and contact definition
GAS-OIL
CONTACT
OIL-WATER
CONTACT
LIGHT
HYDROCARBON
EFFECT
Source: Unpublished work
34. Total porosity computation
Source: https://www.geological-
digressions.com
Source: http://wgnhs.uwex.edu
Matrix
component
Fluid
component
Matrix Density: Depends on dominant rock forming mineral
Fluid Density:
Water zones: 1 g/cm3 is often used
Hydrocarbon zones: From produced water analysis
result or 0.8 and 0.6 g/cm3 for oil and gas respectively Source: http://homepages.see.leeds.ac.uk
35. Fluid density correction for hydrocarbon zones
Source: https://iopscience.iop.org/article
Sxo is usually assumed to be 0.5 i.e. 50% of in-situ
formation fluid has been flushed from the invaded
zone
36. Synthetic Seismogram for Well-Seismic-Tie
CONVOLUTION
Ref.: www.slideshare.net
Ref.: http://subsurfwiki.org
37. GR Shale
cutoff =
100 gAPI
Gamma ray versus RHOB Crossplot AI vs Vp Crossplot
Reservoir modeling and rock physics modeling
Bulk density logs are used to determine shale cutoffs in reservoir static modeling
Used in generating acoustic impedance models in rock physics modeling
Source: Unpublished work Source: NRIAG Journal of Astronomy and
Geophysics
AI vs Vp/Vs Crossplot
Source: https://www.semanticscholar.org
38. Pore pressure prediction
Bulk density logs are used for estimating overburden pressure
during pore pressure prediction for drilling assessment
Density logs are indicators of overpressured zones by
observing a sudden change in the shale normal compaction
trend
The sudden drop in shale density indicates the presence of
trapped water within the shales due to rapid sedimentation or
mineral dewatering
Bulk Density
Onset of
overpressure
Shale NCTL
Source: http://homepages.see.leeds.ac.uk
39. Neutron Logs
Neutron logs measure the hydrogen content in a formation
Typically displayed as volume ratio (v/v) or porosity units (pu) and scaled
between 0.45 to -0.15 v/v or 0.6 to 0 v/v
Neutron logs are used for lithology identification, fluid typing, contact
delineation, porosity estimation, etc.
More advanced form of neutron logs are used for reservoir monitoring
e.g. thermal decay logs
40. Neutron Logs
They are run in open and cased holes, and can be logged with different
mud types
Typically run in combination with density logs to reduce rig time
Neutron reads 20-30cm into the formation and has a worse vertical
resolution than density logs because its offset is larger
Open hole neutron logs are usually corrected for mud cake, salinity,
temperature and pressure effects
The neutron tool is run eccentered
41. Background/Operating Principle
Neutrons are emitted from a chemical
source (americium –beryllium mixture)
At collision with nuclei in the formation,
the neutrons loses energy
After reaching thermal energy level, the
neutron is absorbed by a nucleus and a
gamma ray is emitted
In most cases, the thermal neutrons are
captured by hydrogen or chlorine Source: Schlumberger 2010
42. Background/Operating Principle
Detectors count either the epithermal
neutrons (SNP) or thermal neutrons (CNL
with 2 detectors), or both thermal neutrons
and gamma rays of capture (GNT)
Count rate observed by the detector is
related to the amount of hydrogen
The more the hydrogen, the faster the
neutrons get slowed down and absorbed.
Detector shows low count rate. Vice versa
Source: Schlumberger 2010
43. Background/Operating Principle
In neutron-hydrogen collisions the average energy transfer to the hydrogen
nucleus is about ½ that of the energy originally contained in the neutron
Most of the hydrogen is within the pore spaces in form of water and
hydrocarbon, and so are used as an approximate measure of formation
porosity
However, the relationship between porosity and hydrogen content is
actually flawed
1. Not only hydrogen slows the neutrons
2. Hydrogen is present elsewhere in the formation other than the pore
spaces
44. Neutron Scattering
At each collision, the neutron losses
energy and nucleus of the atom in the
formation gains energy. Such collision
occurs with ALL elements
This process of energy transfer is
more efficient when the masses of the
neutron and the nucleus of the atom
are close e.g. hydrogen. It is less
efficient when the mass of the nucleus
(e.g. silicon and oxygen) is greater than
that of the neutron (P. Glover)
Source: http://homepages.see.leeds.ac.uk
45. Neutron-Absorbing Elements
Neutrons are also strongly absorbed by some other elements other than
hydrogen (e.g. boron, cadmium, etc.) even at trace concentrations
The concentration of thermal, epithermal neutrons and emitted gamma
rays close to the detectors reduces, thereby wrongly indicating high
porosities
Iron is also as effective in absorbing neutrons when in abundant
percentage volume
Clay bound water in clay minerals also exaggerate shale porosities by
acting as effective neutron absorbers
46. Although, both neutron and density logs are classified as nuclear logs, the
two exploit different physics
For neutron logs, high energy neutrons are used to excite the formation,
while high energy gamma rays are used for density logs (Martin
Kennedy, 2015)
The neutrons interact with atomic nuclei, which is in contrast to gamma
rays that interact with electrons
Differences between Neutron and Density logs
47. Conclusions
In conclusion, nuclear methods and radiometric logging have been
observed to have widespread use; ranging from formation evaluation,
reservoir modeling, seismic interpretation, rock physics analysis, pore
pressure prediction, etc.
The methods described are similar in that they are all based on the
relationship between electromagnetic energy and matter
Gamma ray logging is a passive measurement, whereas density and
neutron logging involves the bombardment of the formation with some
form of energy
48. CASE STUDY 1: Fracture detection using conventional well logging in
carbonate (Geisum oil field, southern Gulf of Suez, Egypt)
In the absence of FMI Image logs, spectral GR, litho-density and
compensated neutron logs were used in identifying fractures along the
wellbores (among other logs)
Advanced logging methods for fracture analysis and detection, like the
borehole acoustic televiewer, Formation Microscanner (FMS),
Formation MicroImager (FMI) and Electric MicroImaging (EMI) are
more accurate, but are more expensive
49. Litho-density and CNL logs
Both neutron and density logs were observed
to indicate very high porosities resulting from
mud-filled fractures
PEF responding to barite mud in the fractures
Location of high PEF corresponds to
location of huge porosity indication in
neutron and density log
Increased
porosity
indication
Increased
PEF due to
barite in the
drilling mud
used
50. Litho-density and CNL logs showing fractures
A crossplot of sonic plot and
neutron-density porosity was used as
a qualitative indicator of the presence
of secondary porosity (likely fracture
porosity)
Sonic log does not measure
secondary porosities like vugs,
fractures, while N/D measures all
51. Spectral GR log showing fractures
Uranium is soluble in water and
hydrocarbon
Fractures serve as conduits during
hydrocarbon migration and water
flow
Uranium gets precipitated from
solution in these fractures
Increased
total GR
Ur is largest
contributor
to total SGR
52. CASE STUDY 2: Petrophysical Characterization of radioactive sands –
Integrating well logs and core information: a case study of the Niger/Delta
Radioactive
section
GR log not in congruence with RT,
neutron and density logs
Core sections across this interval was
us to discredit the GR log
Hydrocarbon
section Sandstone
interval N/D
53. Neutron Density crossplot indicating sandstone
N/D crossplot shows data within
radioactive plotting just beneath
the sand line, indicating an oil
bearing sand
Radioactive section
plotting as sand
54. Core analysis confirming a sandstone section
True shale
(dark colour) Radioactive sand
(rich in mica)
55. Implication of wrong interpretation of radioactive zone
More realistic Sw after
accounting for
radioactivity effect
Improper reservoir top
definition, decreasing
net pay
Inaccurate volume of
shale estimation
56. References
1. Developments in Petroleum Science Vol. 62: Practical Petrophysics – Martin Kennedy
2. http://www.slideshare.net: Automated Seismic-To-Well ties? by Roberto Herrera and Marko Van der Baan
3. http://subsurfwiki.org
4. http://wgnhs.uwex.edu
5. https://www.geological-digressions.com
6. http://homepages.see.leeds.ac.uk – Petrophysics MSc course notes
7. NRIAG Journal of Astronomy and Geophysics: Development of model for predicting elasticparameters in ‘bright’
field, Niger Delta using rockphysics analysis - S.J. Abe, M.T. Olowokere & P.A. Enikanselu, 2018
8. https://www.semanticscholar.org: Rock Physics Templates for 4 D Seismic Reservoir Monitoring by Albert
Kabanda, 2014
9. Developments in Petroleum Science Vol. 64: Core Analysis: A Best Practice Guide by Colin McPhee Jules Reed
Izaskun Zubizarreta
10. The essentials of log interpretation practice by Schlumberger
11. Fracture detection using conventional well logging in carbonate. Matulla Formation, Geisum oil field, southern
Gulf of Suez, Egypt by Mohamed R. Shalaby and Md Aminul Islam