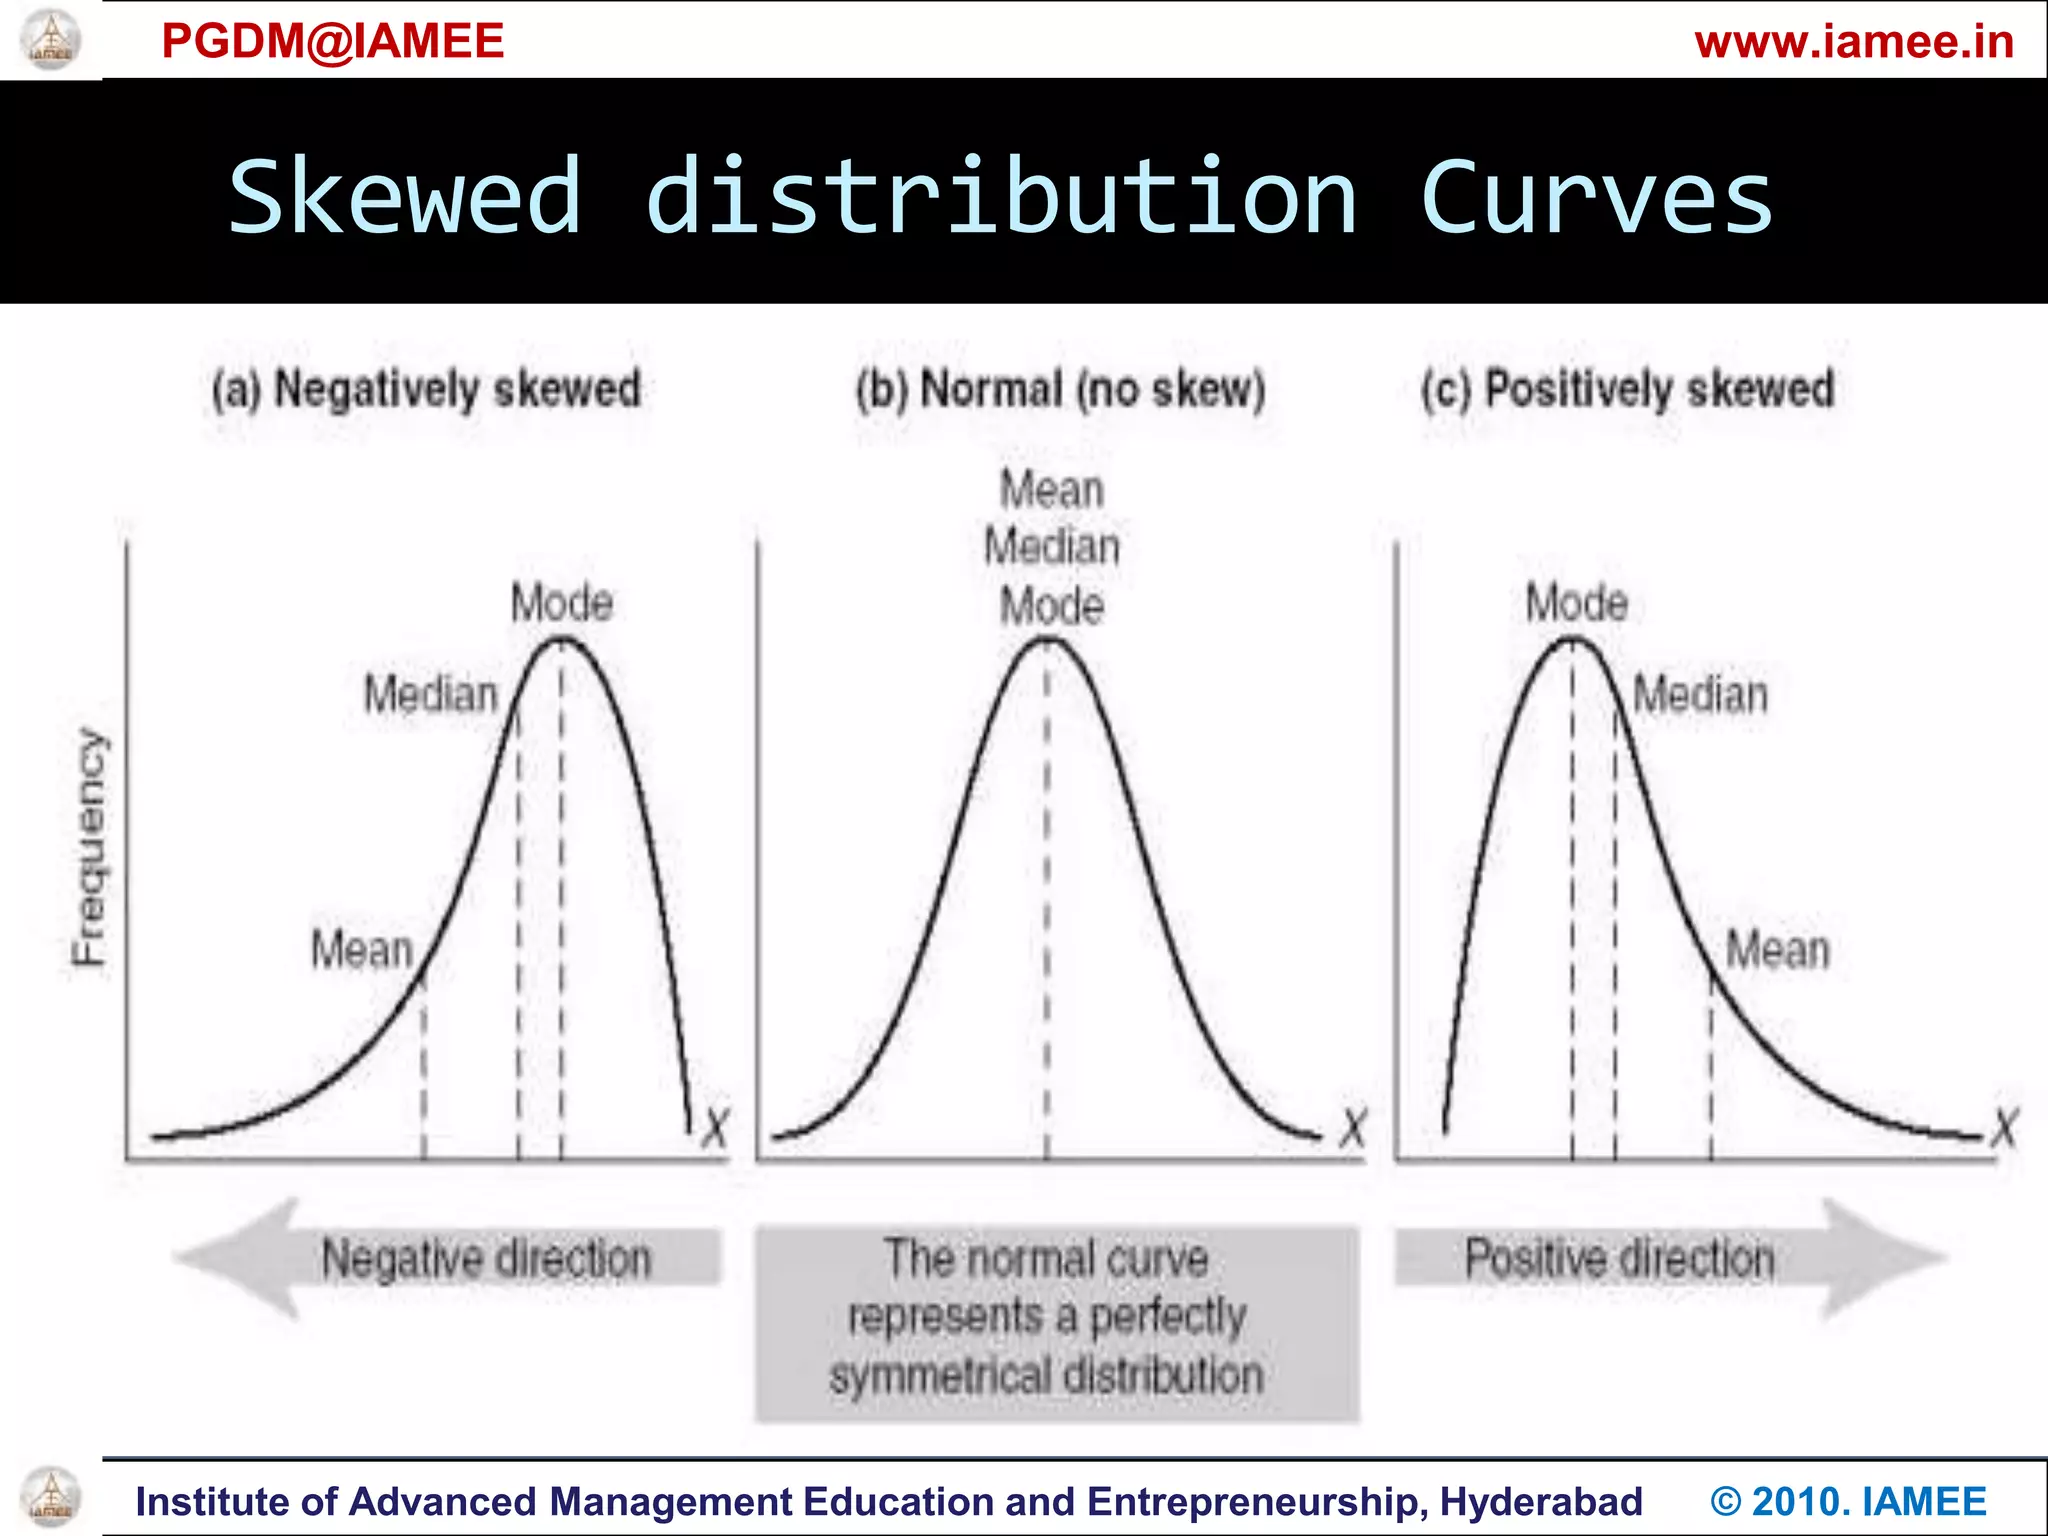
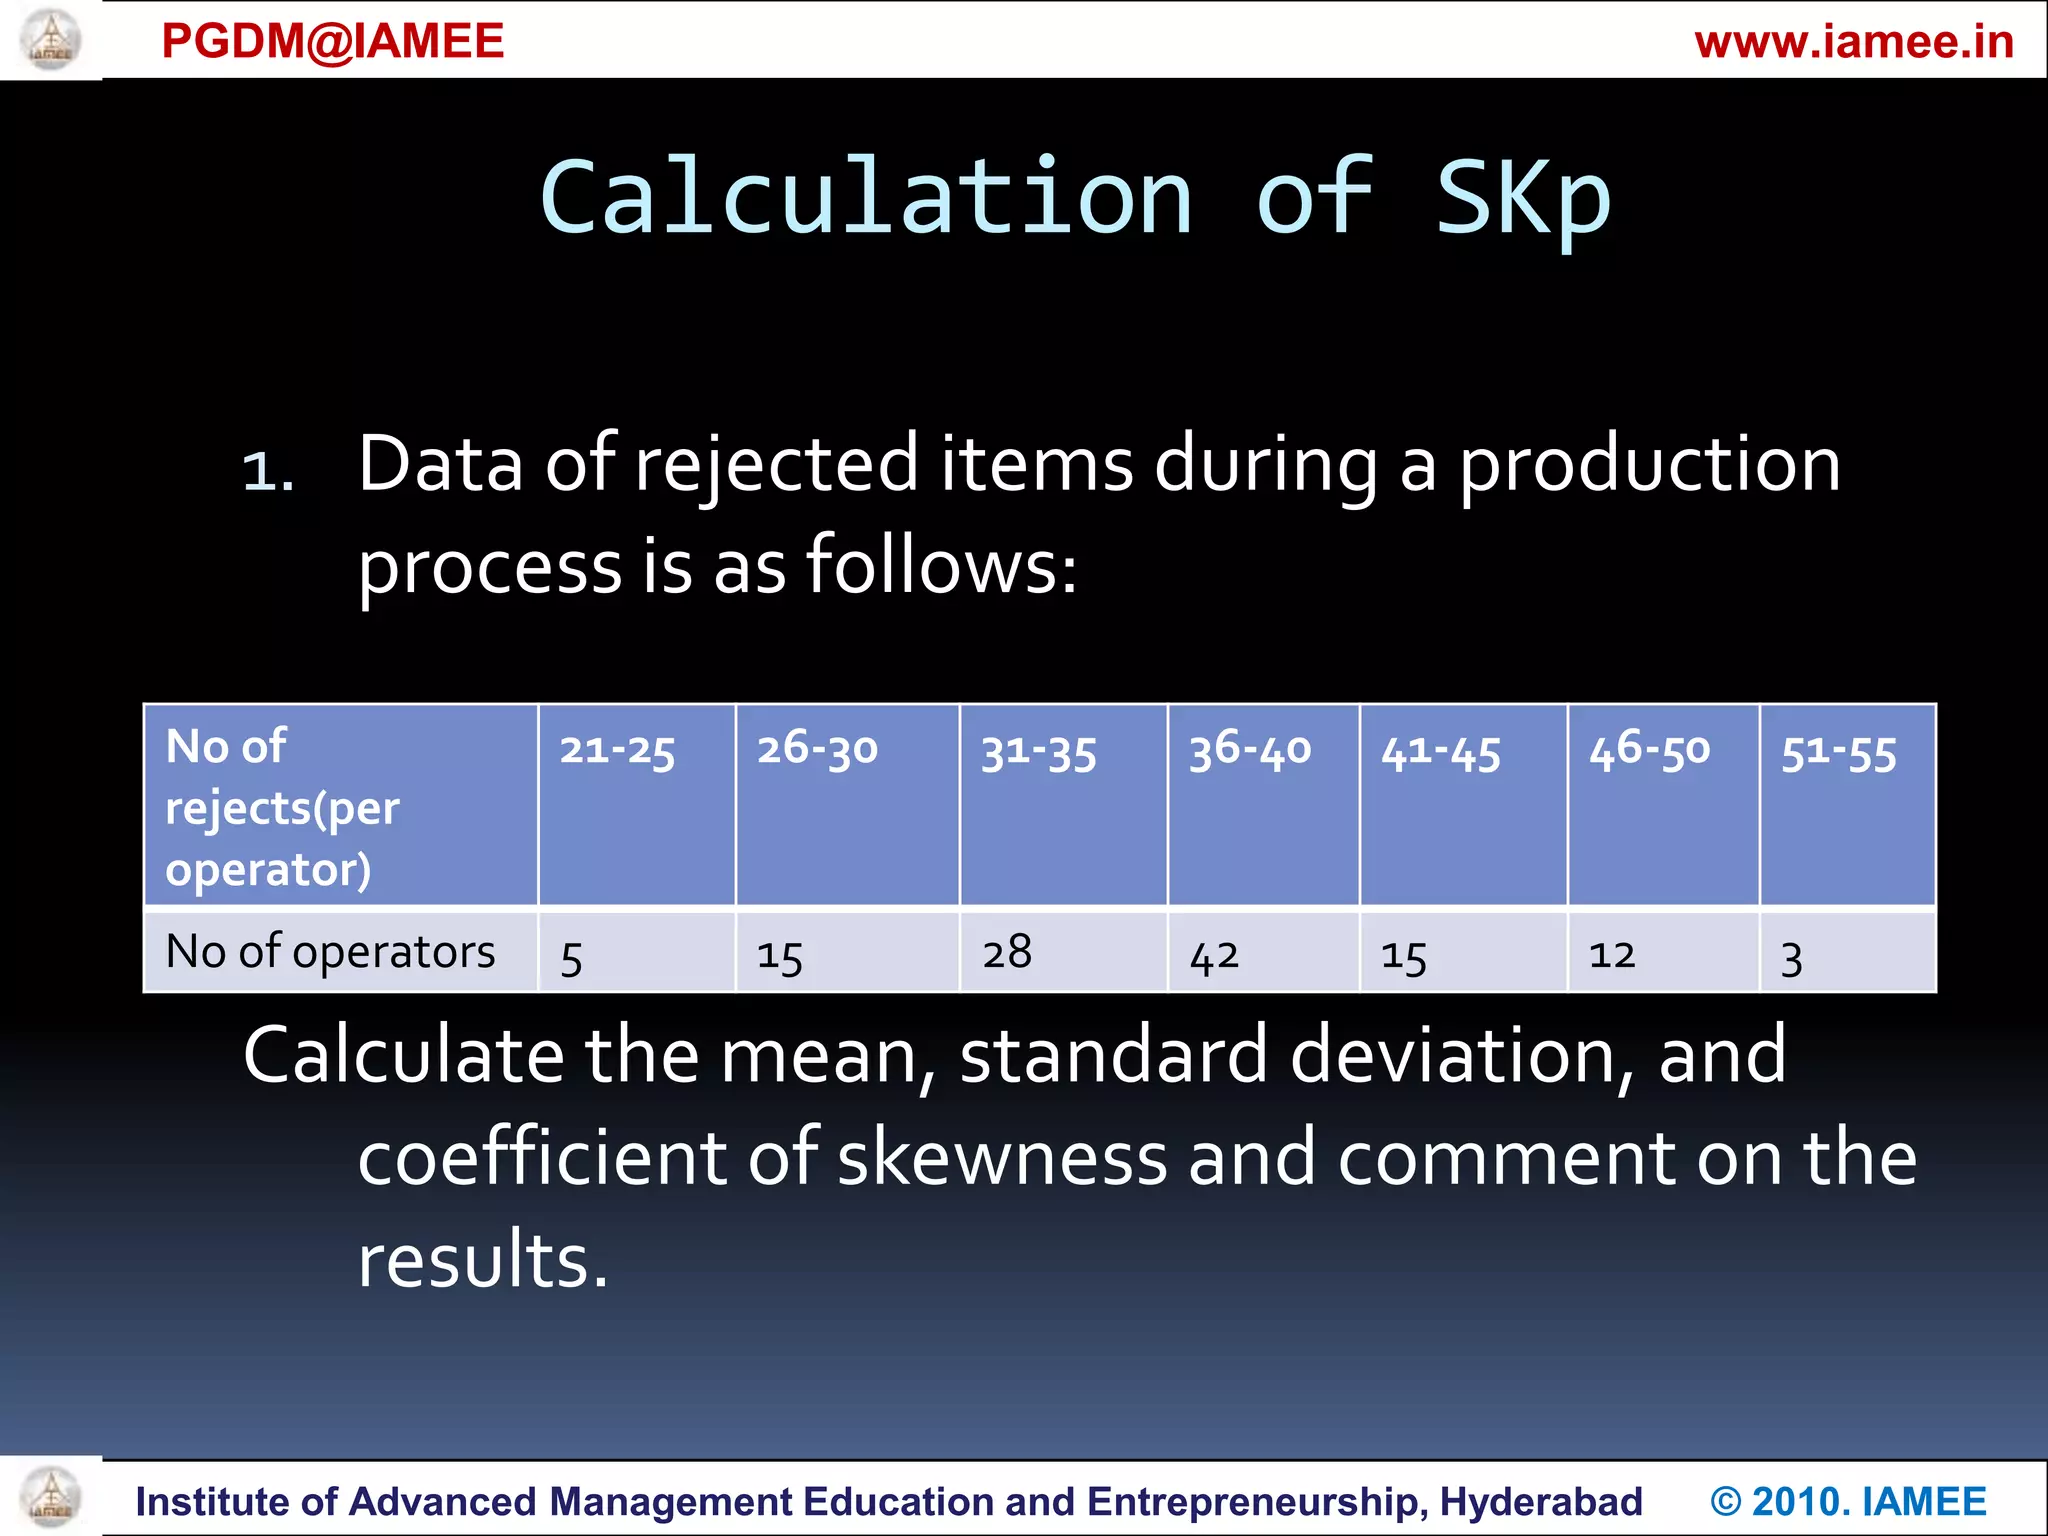
Presented byGet placedPGDM@IAMEE                                                                                        www.iamee.inMEASURES OF  SKEWNESS AND INTERPRETATIONOn01/03/2011Institute of Advanced Management Education and Entrepreneurship, Hyderabad      © 2010. IAMEE
OVERVIEWWhat is meant by Skewness.What are the different types of Skewness Distributions.Skewness Distributions in graphical representation.Calculation of Skewness Coefficient in different (two types) methods.PGDM@IAMEE                                                                                        www.iamee.inInstitute of Advanced Management Education and Entrepreneurship, Hyderabad      © 2010. IAMEE
Measures of SkewnessThe statistical technique to indicate the direction and extent of skewness in the distribution of numerical values in the data set.
A frequency distribution of the set of values that is not Symmetrical(normal) is called asymmetrical or skewed.PGDM@IAMEE                                                                                        www.iamee.inInstitute of Advanced Management Education and Entrepreneurship, Hyderabad      © 2010. IAMEE
Skewed distributionsThere are three types:Symmetrical distribution 		A.M = Median = ModePositively skewed distribution	     A.M > Median > ModeNegatively skewed distribution.		A.M < Median < ModePGDM@IAMEE                                                                                        www.iamee.inInstitute of Advanced Management Education and Entrepreneurship, Hyderabad      © 2010. IAMEE
Skewed distribution CurvesPGDM@IAMEE                                                                                        www.iamee.inInstitute of Advanced Management Education and Entrepreneurship, Hyderabad      © 2010. IAMEE
Measures of Skewness		For an asymmetrical distribution, the distance b/w Mean and Mode may be used to measure the degree of skewness because the Mean is equal to Mode in a symmetrical distribution. Thus, Absolute, Sk = Mean – Mode			      = Q3 + Q1 – 2 Median.For Skewed distribution, if Mean>Mode, the Skewness becomes +ive. Otherwise –ive.PGDM@IAMEE                                                                                        www.iamee.inInstitute of Advanced Management Education and Entrepreneurship, Hyderabad      © 2010. IAMEE
PGDM@IAMEE                                                                                        www.iamee.inVariation tells us about the amount of the variation where as Skewness tells about the direction of variation.In business and economic series, measures of variation have greater practical application than measures of skewness.Institute of Advanced Management Education and Entrepreneurship, Hyderabad      © 2010. IAMEE
Relative measures of SkewnessPGDM@IAMEE                                                                                        www.iamee.inKarl Pearson’s Co-efficient of Skewness,
The value of SKp various b/w ±3.
For moderately skewed distribution,But moderately skewed distribution, the value of SKp lies between ±1.Institute of Advanced Management Education and Entrepreneurship, Hyderabad      © 2010. IAMEE
Relative measures of SkewnessBowley’s Coefficient of Skewness,
Kelly’s coefficient of Skewness,PGDM@IAMEE                                                                                        www.iamee.inInstitute of Advanced Management Education and Entrepreneurship, Hyderabad      © 2010. IAMEE
Calculation of SKpData of rejected items during a production process is as follows:Calculate the mean, standard deviation, and coefficient of skewness and comment on the results.PGDM@IAMEE                                                                                        www.iamee.inInstitute of Advanced Management Education and Entrepreneurship, Hyderabad      © 2010. IAMEE
Solution:PGDM@IAMEE                                                                                        www.iamee.inInstitute of Advanced Management Education and Entrepreneurship, Hyderabad      © 2010. IAMEE
Assume mean, A=38, thenBy inspection, mode lies in the class 36-40. PGDM@IAMEE                                                                                        www.iamee.in =Institute of Advanced Management Education and Entrepreneurship, Hyderabad      © 2010. IAMEE
Answers:X = 36.96 rejects / operator.𝜎 = 6.736 rejects / operator.Mode = 37.70Coefficient of Skewness = -0.109Interpretation :Distribution is Negatively Skewed and hence the concentration of the rejects/operator is more on the left side.PGDM@IAMEE                                                                                        www.iamee.inInstitute of Advanced Management Education and Entrepreneurship, Hyderabad      © 2010. IAMEE
Calculation of Bowley's coefficient2) The data on the profits(in Rs lakhs) earned by 60 companies is as follows:Obtain the limits of profits of the central 50 percent companies. And also calculate Bowley’s coefficient of skewness.PGDM@IAMEE                                                                                        www.iamee.inInstitute of Advanced Management Education and Entrepreneurship, Hyderabad      © 2010. IAMEE
Solution:PGDM@IAMEE                                                                                        www.iamee.inInstitute of Advanced Management Education and Entrepreneurship, Hyderabad      © 2010. IAMEE
Q1 = size of (N/4)th observation. And Q3 = size of (3N/4)th observation. Therefore Q1 = 15th observation, Q3 = 45th observation.PGDM@IAMEE                                                                                        www.iamee.inInstitute of Advanced Management Education and Entrepreneurship, Hyderabad      © 2010. IAMEE
Hence, the profit of central 50 percent companies lies b/w  Rs.35 lakhs and 18.33 lakhs.Therefore, Coefficient of quartile deviation, Q.D = (Q3 – Q1) / (Q3 + Q1) =____________Median=size of (N/2)th observation =(60/2)th observation. Thus, median lies in the class interval 20-30, andPGDM@IAMEE                                                                                        www.iamee.inInstitute of Advanced Management Education and Entrepreneurship, Hyderabad      © 2010. IAMEE
Median,Coefficient of Skewness, SKb = 0.02.The positive value of SKb indicates that the distribution in positively skewed.PGDM@IAMEE                                                                                        www.iamee.inInstitute of Advanced Management Education and Entrepreneurship, Hyderabad      © 2010. IAMEE
Answers:Q1 = 18.33 lakhsQ3 = 35 lakhs.Q.D = 0.313Median (Me) = 26.5Coefficient of Skewness = 0.02.Interpretation:The distribution is positively skewed and therefore, concentration of larger value on the right side of the distribution.PGDM@IAMEE                                                                                        www.iamee.inInstitute of Advanced Management Education and Entrepreneurship, Hyderabad      © 2010. IAMEE

Skewness

  • 1.
    Presented byGet placedPGDM@IAMEE www.iamee.inMEASURES OF SKEWNESS AND INTERPRETATIONOn01/03/2011Institute of Advanced Management Education and Entrepreneurship, Hyderabad © 2010. IAMEE
  • 2.
    OVERVIEWWhat is meantby Skewness.What are the different types of Skewness Distributions.Skewness Distributions in graphical representation.Calculation of Skewness Coefficient in different (two types) methods.PGDM@IAMEE www.iamee.inInstitute of Advanced Management Education and Entrepreneurship, Hyderabad © 2010. IAMEE
  • 3.
    Measures of SkewnessThestatistical technique to indicate the direction and extent of skewness in the distribution of numerical values in the data set.
  • 4.
    A frequency distributionof the set of values that is not Symmetrical(normal) is called asymmetrical or skewed.PGDM@IAMEE www.iamee.inInstitute of Advanced Management Education and Entrepreneurship, Hyderabad © 2010. IAMEE
  • 5.
    Skewed distributionsThere arethree types:Symmetrical distribution A.M = Median = ModePositively skewed distribution A.M > Median > ModeNegatively skewed distribution. A.M < Median < ModePGDM@IAMEE www.iamee.inInstitute of Advanced Management Education and Entrepreneurship, Hyderabad © 2010. IAMEE
  • 6.
    Skewed distribution CurvesPGDM@IAMEE www.iamee.inInstitute of Advanced Management Education and Entrepreneurship, Hyderabad © 2010. IAMEE
  • 7.
    Measures of Skewness Foran asymmetrical distribution, the distance b/w Mean and Mode may be used to measure the degree of skewness because the Mean is equal to Mode in a symmetrical distribution. Thus, Absolute, Sk = Mean – Mode = Q3 + Q1 – 2 Median.For Skewed distribution, if Mean>Mode, the Skewness becomes +ive. Otherwise –ive.PGDM@IAMEE www.iamee.inInstitute of Advanced Management Education and Entrepreneurship, Hyderabad © 2010. IAMEE
  • 8.
    PGDM@IAMEE www.iamee.inVariation tells us about the amount of the variation where as Skewness tells about the direction of variation.In business and economic series, measures of variation have greater practical application than measures of skewness.Institute of Advanced Management Education and Entrepreneurship, Hyderabad © 2010. IAMEE
  • 9.
    Relative measures ofSkewnessPGDM@IAMEE www.iamee.inKarl Pearson’s Co-efficient of Skewness,
  • 10.
    The value ofSKp various b/w ±3.
  • 11.
    For moderately skeweddistribution,But moderately skewed distribution, the value of SKp lies between ±1.Institute of Advanced Management Education and Entrepreneurship, Hyderabad © 2010. IAMEE
  • 12.
    Relative measures ofSkewnessBowley’s Coefficient of Skewness,
  • 13.
    Kelly’s coefficient ofSkewness,PGDM@IAMEE www.iamee.inInstitute of Advanced Management Education and Entrepreneurship, Hyderabad © 2010. IAMEE
  • 14.
    Calculation of SKpDataof rejected items during a production process is as follows:Calculate the mean, standard deviation, and coefficient of skewness and comment on the results.PGDM@IAMEE www.iamee.inInstitute of Advanced Management Education and Entrepreneurship, Hyderabad © 2010. IAMEE
  • 15.
    Solution:PGDM@IAMEE www.iamee.inInstitute of Advanced Management Education and Entrepreneurship, Hyderabad © 2010. IAMEE
  • 16.
    Assume mean, A=38,thenBy inspection, mode lies in the class 36-40. PGDM@IAMEE www.iamee.in =Institute of Advanced Management Education and Entrepreneurship, Hyderabad © 2010. IAMEE
  • 17.
    Answers:X = 36.96rejects / operator.𝜎 = 6.736 rejects / operator.Mode = 37.70Coefficient of Skewness = -0.109Interpretation :Distribution is Negatively Skewed and hence the concentration of the rejects/operator is more on the left side.PGDM@IAMEE www.iamee.inInstitute of Advanced Management Education and Entrepreneurship, Hyderabad © 2010. IAMEE
  • 18.
    Calculation of Bowley'scoefficient2) The data on the profits(in Rs lakhs) earned by 60 companies is as follows:Obtain the limits of profits of the central 50 percent companies. And also calculate Bowley’s coefficient of skewness.PGDM@IAMEE www.iamee.inInstitute of Advanced Management Education and Entrepreneurship, Hyderabad © 2010. IAMEE
  • 19.
    Solution:PGDM@IAMEE www.iamee.inInstitute of Advanced Management Education and Entrepreneurship, Hyderabad © 2010. IAMEE
  • 20.
    Q1 = sizeof (N/4)th observation. And Q3 = size of (3N/4)th observation. Therefore Q1 = 15th observation, Q3 = 45th observation.PGDM@IAMEE www.iamee.inInstitute of Advanced Management Education and Entrepreneurship, Hyderabad © 2010. IAMEE
  • 21.
    Hence, the profitof central 50 percent companies lies b/w Rs.35 lakhs and 18.33 lakhs.Therefore, Coefficient of quartile deviation, Q.D = (Q3 – Q1) / (Q3 + Q1) =____________Median=size of (N/2)th observation =(60/2)th observation. Thus, median lies in the class interval 20-30, andPGDM@IAMEE www.iamee.inInstitute of Advanced Management Education and Entrepreneurship, Hyderabad © 2010. IAMEE
  • 22.
    Median,Coefficient of Skewness,SKb = 0.02.The positive value of SKb indicates that the distribution in positively skewed.PGDM@IAMEE www.iamee.inInstitute of Advanced Management Education and Entrepreneurship, Hyderabad © 2010. IAMEE
  • 23.
    Answers:Q1 = 18.33lakhsQ3 = 35 lakhs.Q.D = 0.313Median (Me) = 26.5Coefficient of Skewness = 0.02.Interpretation:The distribution is positively skewed and therefore, concentration of larger value on the right side of the distribution.PGDM@IAMEE www.iamee.inInstitute of Advanced Management Education and Entrepreneurship, Hyderabad © 2010. IAMEE
  • 24.
    THE ENDMEASURNESS OF SKEWNESS AND INTERPRETATIONPGDM@IAMEE www.iamee.inTHANK YOUInstitute of Advanced Management Education and Entrepreneurship, Hyderabad © 2010. IAMEE
  • 25.
    go & read to today O otherwisePGDM@IAMEE www.iamee.inInstitute of Advanced Management Education and Entrepreneurship, Hyderabad © 2010. IAMEE
  • 26.
    PGDM@IAMEE www.iamee.inInstitute of Advanced Management Education and Entrepreneurship, Hyderabad © 2010. IAMEE
  • 27.
    Try it…The followingtable gives the distribution of weekly wages of 500 workers in a factory:Obtain the limits of income of the central 50% of the observed workers.Calculate Bowley's coefficient of skewness.ANS:Negatively Skewed.(SKb = -0.102).PGDM@IAMEE www.iamee.inKeeping your work organized will help a lot!!Institute of Advanced Management Education and Entrepreneurship, Hyderabad © 2010. IAMEE