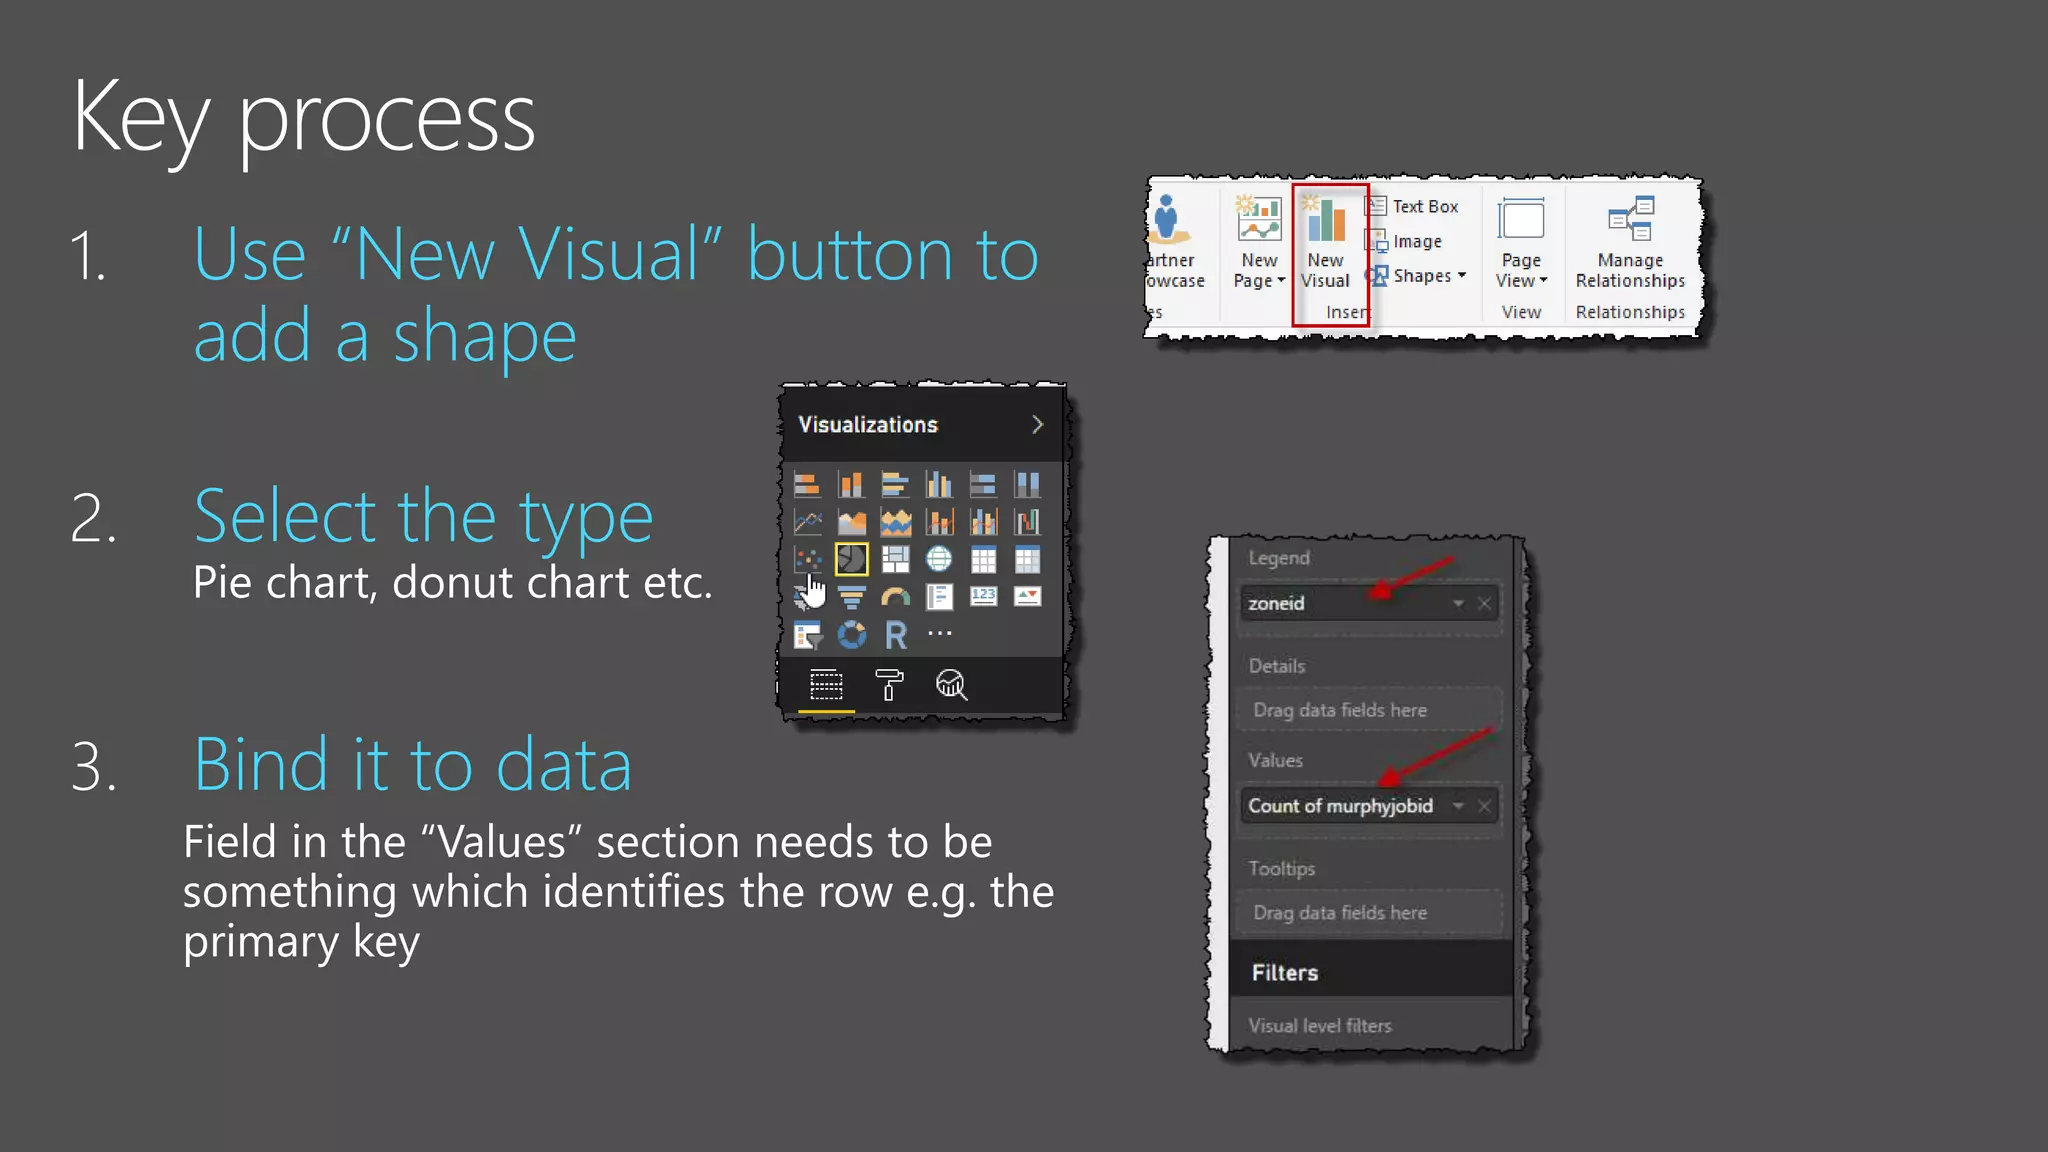
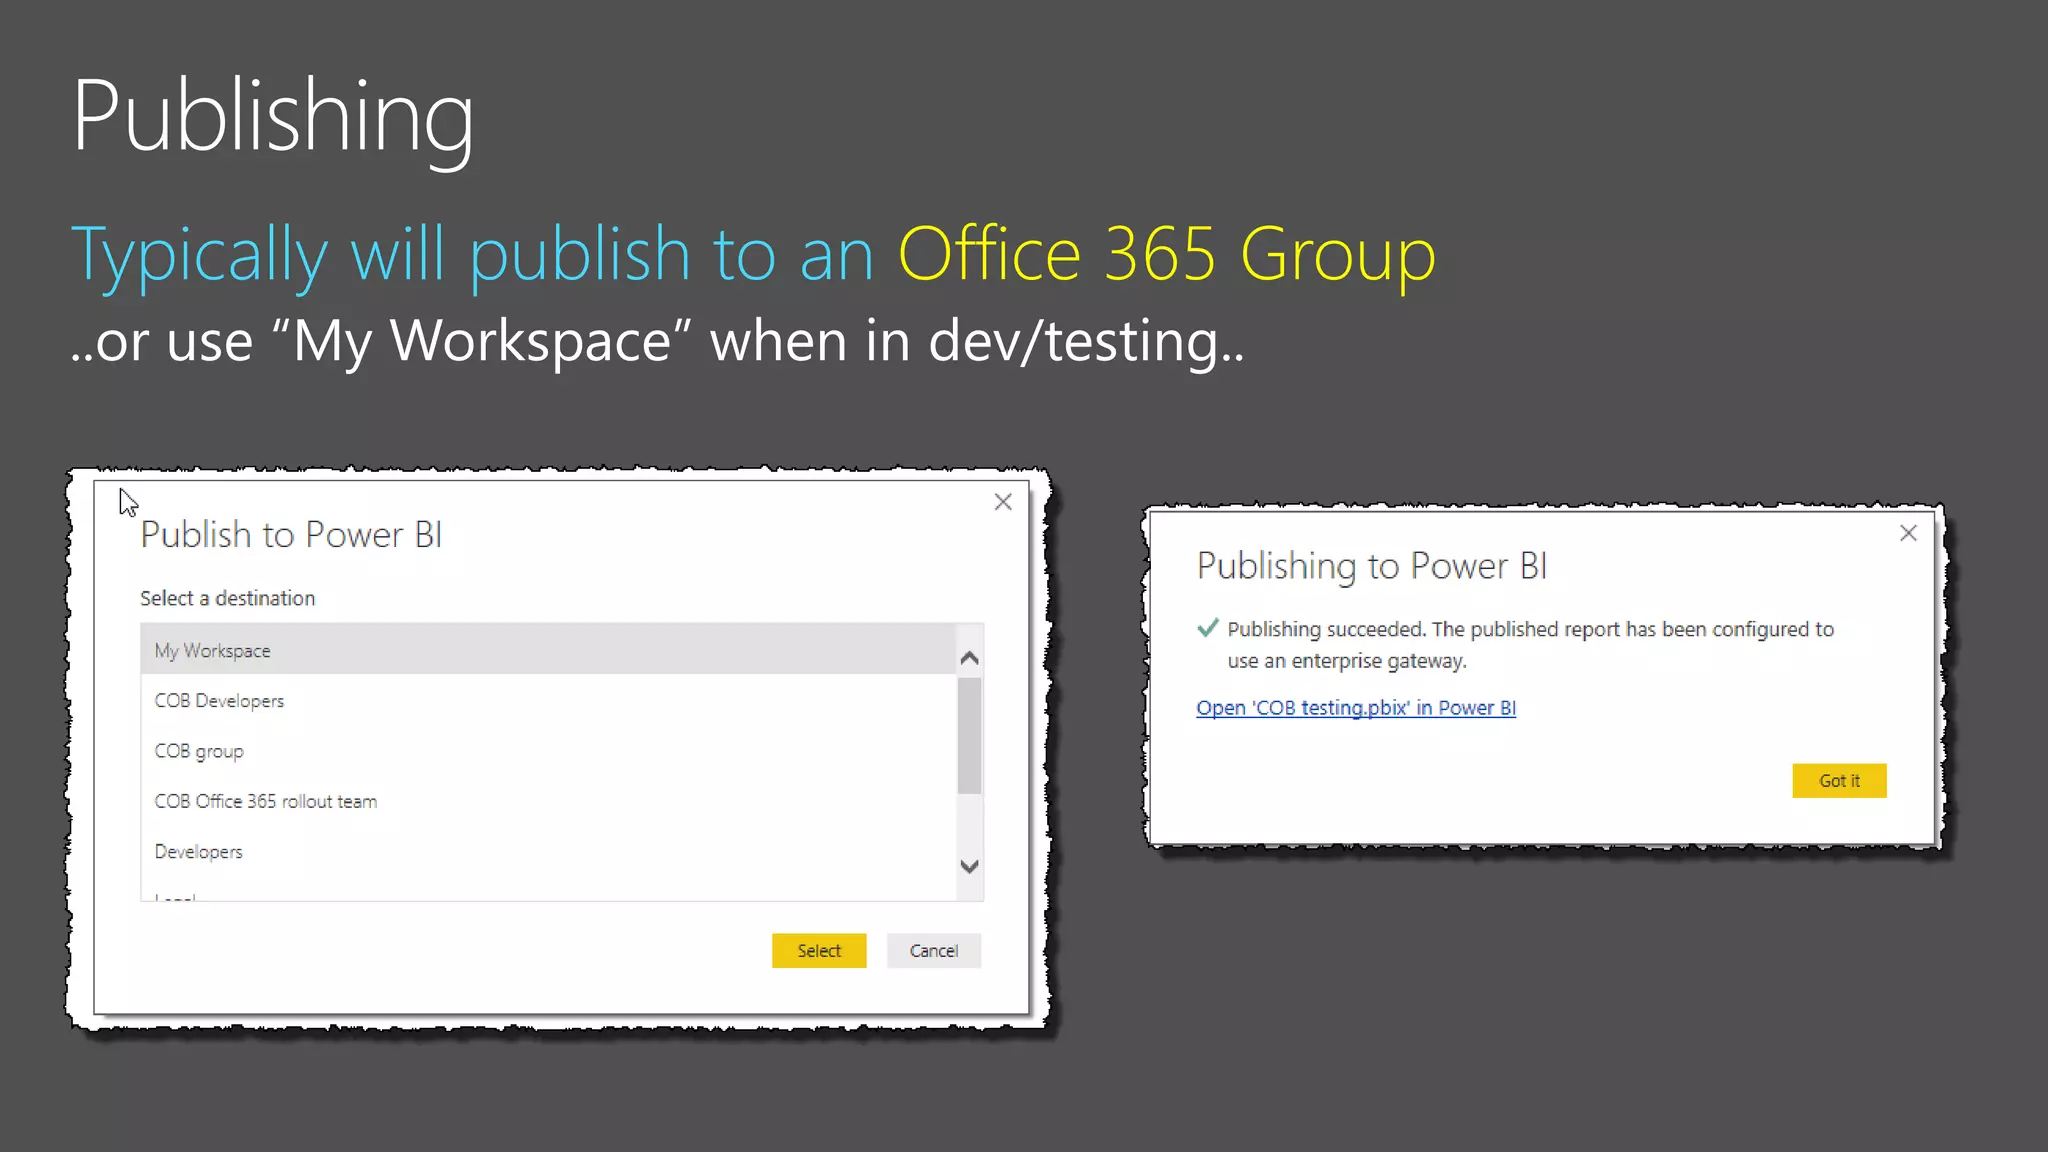
A quick guide to getting started
with Power BI….
…from someone else who isn’t an
expert either 
You want easy visualisations (charts, maps
etc.)
You want easy sorting/filtering
You have drilldown or parent/child scenarios
You want to support mobile
Your client has E5 or Power BI Pro licenses
Your data is in SQL, SP lists, or a file (e.g.
Excel, XML etc.)
Easier than with D3
for example..
Make sure you get the right bits
Power BI *Desktop*
https://powerbi.microsoft.com/en-us/desktop
Consider licensing, even for your “dev environment”
E5
Power BI Pro
Easy options
Bit more involved
1. Generally “brought into model”
2. Direct Query
Tables and columns now
detected
Can use “Edit Queries” button to
bring in extra columns/change
detected relationships etc.
1. Use “New Visual” button to
add a shape
2. Select the type
3. Bind it to data
“Jobs by zone”
-
-
Drag fields to the “Filters” section of the
control to make it act as a filter
Use the Edit Interactions button to control which
other visualizations should react
“Filter” or “do nothing” buttons
will appear on other filterable
visualizations:
Use filter visualizations with Table visualization
Select item in chart –> filters items in table
The Slicer is a special kind of visualization – it acts
as a filter depending on data type:
Cannot select item in (the standard) table
Slicers can be inflexible
CUSTOM VISUALS TO THE RESCUE!
Investigate to see if they meet your requirements
Original Microsoft control Custom controls
Table Grid (by MAQ Software)
Slicer Chiclet slicer
Attribute slicer
Timeline slicer
Obtain from https://store.office.com/
Typically will publish to an Office 365 Group
..or use “My Workspace” when in dev/testing..
SPFX web part
Publish to web
Pull tiles/dashboards/reports into custom app
JS “embed report” option (but now also have SPFx web
part)
Develop custom visuals
https://powerbi.microsoft.com/en-us/developers/
Chris O'Brien - Intro to Power BI for Office 365 devs (March 2017)

Chris O'Brien - Intro to Power BI for Office 365 devs (March 2017)

  • 2.
    A quick guideto getting started with Power BI…. …from someone else who isn’t an expert either 
  • 3.
    You want easyvisualisations (charts, maps etc.) You want easy sorting/filtering You have drilldown or parent/child scenarios You want to support mobile Your client has E5 or Power BI Pro licenses Your data is in SQL, SP lists, or a file (e.g. Excel, XML etc.) Easier than with D3 for example..
  • 4.
    Make sure youget the right bits Power BI *Desktop* https://powerbi.microsoft.com/en-us/desktop Consider licensing, even for your “dev environment” E5 Power BI Pro
  • 6.
  • 7.
    1. Generally “broughtinto model” 2. Direct Query
  • 8.
    Tables and columnsnow detected Can use “Edit Queries” button to bring in extra columns/change detected relationships etc.
  • 9.
    1. Use “NewVisual” button to add a shape 2. Select the type 3. Bind it to data
  • 10.
  • 11.
    Drag fields tothe “Filters” section of the control to make it act as a filter
  • 12.
    Use the EditInteractions button to control which other visualizations should react “Filter” or “do nothing” buttons will appear on other filterable visualizations:
  • 13.
    Use filter visualizationswith Table visualization Select item in chart –> filters items in table
  • 14.
    The Slicer isa special kind of visualization – it acts as a filter depending on data type:
  • 15.
    Cannot select itemin (the standard) table Slicers can be inflexible CUSTOM VISUALS TO THE RESCUE!
  • 16.
    Investigate to seeif they meet your requirements Original Microsoft control Custom controls Table Grid (by MAQ Software) Slicer Chiclet slicer Attribute slicer Timeline slicer Obtain from https://store.office.com/
  • 18.
    Typically will publishto an Office 365 Group ..or use “My Workspace” when in dev/testing..
  • 19.
  • 20.
  • 21.
    Pull tiles/dashboards/reports intocustom app JS “embed report” option (but now also have SPFx web part) Develop custom visuals https://powerbi.microsoft.com/en-us/developers/