1
Module 2: DataVisualization and Communication
Data Visualization using PowerBI
Siddharth Sundar
MyAnatomy Integration
NCET Core Team
2.
2
What is PowerBI?
•PowerBI is a data visualization and reporting platform, created by
Microsoft.
• It is used by Businesses and Professionals on a regular basis.
• Microsoft PowerBI is a robust tool for analysts to create visually
appealing dashboards that help stakeholders understand data, with
just a look.
3.
3
Features of PowerBI?
•PowerBI has a suite of features that make it one of the most sought-after solutions
for creating dashboards and visualizations.
• Features include:
• Various Connectors (Excel, SQL Servers, other Cloud Platforms)
• Can be integrated within a website
• Can be used to track KPIs in real-time.
• Data modelling feature to define tables, measures, and relationships.
• Power Query for cleaning and transforming data
• Custom Visuals and Add-Ons
• … and many more
4.
4
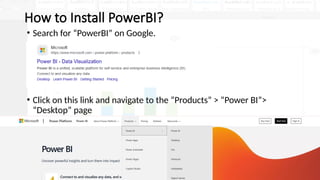
How to InstallPowerBI?
• Search for “PowerBI” on Google.
• Click on this link and navigate to the “Products” > “Power BI”>
“Desktop” page
5.
5
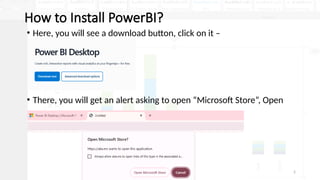
How to InstallPowerBI?
• Here, you will see a download button, click on it –
• There, you will get an alert asking to open “Microsoft Store”, Open
6.
6
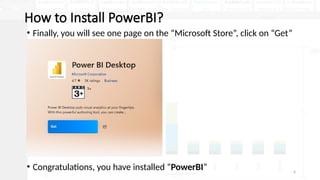
How to InstallPowerBI?
• Finally, you will see one page on the “Microsoft Store”, click on “Get”
• Congratulations, you have installed “PowerBI”
8
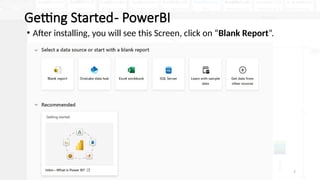
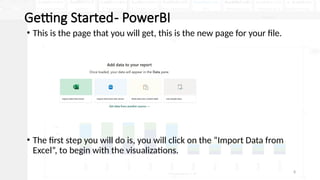
Getting Started- PowerBI
•This is the page that you will get, this is the new page for your file.
• The first step you will do is, you will click on the “Import Data from
Excel”, to begin with the visualizations.
9.
9
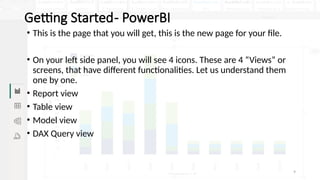
Getting Started- PowerBI
•This is the page that you will get, this is the new page for your file.
• On your left side panel, you will see 4 icons. These are 4 “Views” or
screens, that have different functionalities. Let us understand them
one by one.
• Report view
• Table view
• Model view
• DAX Query view
10.
10
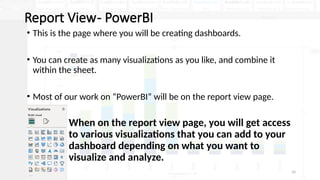
Report View- PowerBI
•This is the page where you will be creating dashboards.
• You can create as many visualizations as you like, and combine it
within the sheet.
• Most of our work on “PowerBI” will be on the report view page.
• When on the report view page, you will get access
to various visualizations that you can add to your
dashboard depending on what you want to
visualize and analyze.
11.
11
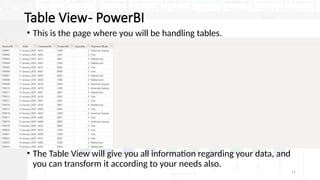
Table View- PowerBI
•This is the page where you will be handling tables.
• The Table View will give you all information regarding your data, and
you can transform it according to your needs also.
12.
12
Model View- PowerBI
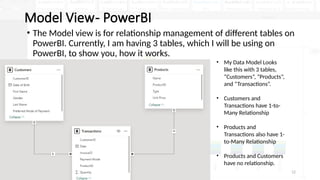
•The Model view is for relationship management of different tables on
PowerBI. Currently, I am having 3 tables, which I will be using on
PowerBI, to show you, how it works.
• My Data Model Looks
like this with 3 tables,
“Customers”, “Products”,
and “Transactions”.
• Customers and
Transactions have 1-to-
Many Relationship
• Products and
Transactions also have 1-
to-Many Relationship
• Products and Customers
have no relationship.
13.
13
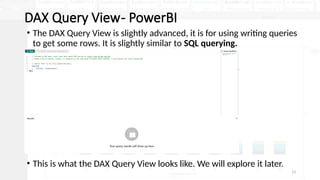
DAX Query View-PowerBI
• The DAX Query View is slightly advanced, it is for using writing queries
to get some rows. It is slightly similar to SQL querying.
• This is what the DAX Query View looks like. We will explore it later.