The document provides a daily market summary and outlook for the Indian stock market. It notes that the Nifty index opened mildly positive but ended the day lower due to weak global cues. Key factors dampening sentiment included a slower services sector expansion and concerns about job losses due to automation. The document analyzes technical indicators for the Nifty and Bank Nifty indexes and provides short term trading recommendations. It also summarizes derivative open interest data and lists stocks with unusual option activity.
VIP Independent Call Girls in Mira Bhayandar 🌹 9920725232 ( Call Me ) Mumbai ...
Equity bazaar 06.10.2016
1. Equity Bazaar
SEBI Registered– Research Analyst Equities I Commodities I Currencies I Mutual Funds
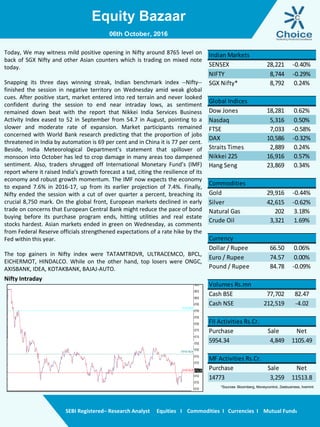
Nifty Intraday
Today, We may witness mild positive opening in Nifty around 8765 level on
back of SGX Nifty and other Asian counters which is trading on mixed note
today.
Snapping its three days winning streak, Indian benchmark index --Nifty--
finished the session in negative territory on Wednesday amid weak global
cues. After positive start, market entered into red terrain and never looked
confident during the session to end near intraday lows, as sentiment
remained down beat with the report that Nikkei India Services Business
Activity Index eased to 52 in September from 54.7 in August, pointing to a
slower and moderate rate of expansion. Market participants remained
concerned with World Bank research predicting that the proportion of jobs
threatened in India by automation is 69 per cent and in China it is 77 per cent.
Beside, India Meteorological Department’s statement that spillover of
monsoon into October has led to crop damage in many areas too dampened
sentiment. Also, traders shrugged off International Monetary Fund’s (IMF)
report where it raised India’s growth forecast a tad, citing the resilience of its
economy and robust growth momentum. The IMF now expects the economy
to expand 7.6% in 2016-17, up from its earlier projection of 7.4%. Finally,
Nifty ended the session with a cut of over quarter a percent, breaching its
crucial 8,750 mark. On the global front, European markets declined in early
trade on concerns that European Central Bank might reduce the pace of bond
buying before its purchase program ends, hitting utilities and real estate
stocks hardest. Asian markets ended in green on Wednesday, as comments
from Federal Reserve officials strengthened expectations of a rate hike by the
Fed within this year.
The top gainers in Nifty index were TATAMTRDVR, ULTRACEMCO, BPCL,
EICHERMOT, HINDALCO. While on the other hand, top losers were ONGC,
AXISBANK, IDEA, KOTAKBANK, BAJAJ-AUTO.
06th October, 2016
SENSEX 28,221 -0.40%
NIFTY 8,744 -0.29%
SGX Nifty* 8,792 0.24%
Global Indices
Dow Jones 18,281 0.62%
Nasdaq 5,316 0.50%
FTSE 7,033 -0.58%
DAX 10,586 -0.32%
Straits Times 2,889 0.24%
Nikkei 225 16,916 0.57%
Hang Seng 23,869 0.34%
Commodities
Gold 29,916 -0.44%
Silver 42,615 -0.62%
Natural Gas 202 3.18%
Crude Oil 3,321 1.69%
Currency
Dollar / Rupee 66.50 0.06%
Euro / Rupee 74.57 0.00%
Pound / Rupee 84.78 -0.09%
Volumes Rs.mn
Cash BSE 77,702 82.47
Cash NSE 212,519 -4.02
FII Activities Rs.Cr.
Purchase Sale Net
5954.34 4,849 1105.49
MF Activities Rs.Cr.
Purchase Sale Net
14773 3,259 11513.8
Indian Markets
*Sources- Bloomberg, Moneycontrol, Zeebusiness, livemint
2. Equity Bazaar
SEBI Registered– Research Analyst Equities I Commodities I Currencies I Mutual Funds
Nifty Outlook
Bank Nifty Outlook
06th October, 2016
L1 L2 L3
R 8790 8836 8866
S 8715 8685 8639
21 DEMA 8736
50 DEMA 8661
100 DEMA 8475
Moving Averages
L1 L2 L3
R 19738 19939 20062
S 19414 19292 19091
21 DEMA 19635
50 DEMA 19336
100 DEMA 18687
Moving Averages
After a 3 day upside move wherein it has recovered biggest fall in recent time, mild sell off has been
observed.
Nifty opened on positive note but not able to sustain at higher level, it has formed tweezer top which
indicate selling pressure from initial trade itself.
Nifty has recovered above its 21 day moving average but still trading below its previous top, combining
two technical development Nifty’s optimist view has shifted to cautious upside.
Going forward, cautious approach can be adopted with positive bias upto 8800 and 8840 level and
support lies at 8680 level.
After 3 day positive move and post RBI policy Index has lose mild strength at higher level.
Bank Nifty has formed tweezer top which indicate bulls came into play but surrendered to bears in
initial ticks only.
Due to high volatility there is often switch in dominance of bulls and bears as both DI is in zigzag mode.
Going forward, further upside movement can be expected upto 19700 to 19750 level which is inception
point of selling pressure earlier. On down side support lies at 19300 level.
3. Equity Bazaar
SEBI Registered– Research Analyst Equities I Commodities I Currencies I Mutual Funds
Derivative Front:
The India VIX contraction by 0.45% and reached 14.92. The
Nifty was down by 25.20 points or 0.29% to settle at
8,743.95.
From the most active contracts, State Bank of India October
2016 futures traded at a premium of 1.35 points at 261.35
compared with spot closing of 260.00. ICICI Bank October
2016 futures traded at a premium of 0.80 points at 256.20
compared with spot closing of 255.40. DLF October 2016
futures traded at a premium of 1.95 points at 159.60
compared with spot closing of 157.65. Bank of Baroda
October 2016 futures traded at a premium of 1.50 points at
170.25 compared with spot closing of 168.75. Vedanta
October 2016 futures traded at a premium of 1.70 points at
192.40 compared with spot closing of 190.70.
The Nifty PCR finally stood at 1.03 for October month
contract. The top five scrips with highest PCR on OI were
MRF (4.00), OFSS (2.00), APOLLOHOSP (1.67), M&M (1.14)
and BPCL (1.10).
06th October, 2016
Long Built Up
Symbol Close Price Chng % OI Chng % Buy Above
MCLEODRUSS 179.80 4.38 27.08 183.09
SRF 1937.20 3.24 15.25 1973.60
AMBUJACEM 257.70 0.06 11.48 259.51
DLF 159.6 3.33 10.13 162.79
Short Covering
Symbol Close Price Chng % OI Chng % Buy Above
NMDC 112.05 0.67 -8.32 112.68
UNIONBANK 152.90 0.26 -6.21 154.64
LT 1460.80 0.22 -4.37 1470.35
IBREALEST 94.6 0.69 -4.10 95.98
Short Built Up
Symbol Close Price Chng % OI Chng % Sell Below
CESC 617.80 -2.90 15.25 627.75
AJANTPHARM 2014.95 -1.73 12.60 2031.36
PCJEWELLER 494.95 -0.75 9.17 499.74
AXISBANK 538.5 -2.12 6.79 544.84
Long Liquidation
Symbol Close Price Chng % OI Chng % Sell Below
IGL 831.95 -1.30 -6.90 838.14
HAVELLS 449.35 -0.90 -4.55 452.88
ICICIBANK 256.20 -1.08 -4.13 258.47
JUSTDIAL 431.80 -1.56 -3.68 437.70
APOLLOTYRE COVERED CALL
4. Equity Bazaar
SEBI Registered– Research Analyst Equities I Commodities I Currencies I Mutual Funds
06th October, 2016
Symbols CLOSE R3 R2 R1 P S1 S2 S3 Trend Action
ACC 1633 1672 1660 1647 1635 1621 1609 1584 Down Sell
ADANIPORTS 265 275 272 269 266 263 260 254 Down Sell
AMBUJACEM 256 263 260 258 256 254 251 246 Up Buy
ASIANPAINT 1206 1264 1244 1225 1205 1186 1166 1127 Up Buy
AUROPHARMA 867 886 879 873 867 861 854 841 Up Buy
AXISBANK 534 563 557 545 539 528 522 505 Down Sell
BAJAJ-AUTO 2854 2958 2934 2894 2870 2830 2806 2742 Down Sell
BANKBARODA 169 177 175 172 170 167 165 161 Down Sell
BHARTIARTL 322 331 328 325 323 320 317 312 Down Sell
BHEL 137 142 140 138 137 135 134 131 Down Sell
BOSCHLTD 22800 23149 23042 22921 22814 22693 22586 22358 Down Sell
BPCL 649 683 668 658 643 633 618 593 Up Buy
CIPLA 591 607 604 597 594 587 583 573 Down Sell
COALINDIA 321 328 326 323 321 319 316 311 Down Sell
DRREDDY 3120 3190 3170 3145 3125 3100 3080 3035 Down Sell
EICHERMOT 26250 27260 26803 26527 26069 25793 25336 24602 Up Buy
GAIL 400 414 411 406 402 397 394 385 Down Sell
GRASIM 4942 5078 5035 4988 4945 4899 4856 4766 Down Sell
HCLTECH 815 840 832 823 815 806 798 781 Up Buy
HDFC 1423 1458 1448 1435 1425 1412 1402 1379 Down Sell
HDFCBANK 1286 1322 1311 1298 1287 1275 1264 1240 Down Sell
HEROMOTOCO 3486 3606 3582 3534 3510 3462 3438 3366 Down Sell
HINDALCO 157 162 161 159 157 155 154 150 Down Sell
HINDUNILVR 872 888 881 876 869 865 858 847 Up Buy
ICICIBANK 255 265 263 259 257 253 251 245 Down Sell
IDEA 80 85 84 82 81 79 78 74 Down Sell
INDUSINDBK 1211 1249 1241 1226 1218 1203 1195 1172 Down Sell
INFRATEL 374 395 387 381 373 366 358 344 Up Buy
INFY 1041 1061 1055 1048 1043 1035 1030 1017 Down Sell
ITC 241 247 245 243 241 239 237 233 Down Sell
KOTAKBANK 781 804 800 790 785 776 771 757 Down Sell
LT 1457 1486 1474 1466 1453 1445 1433 1412 Up Buy
LUPIN 1491 1520 1511 1501 1493 1483 1474 1456 Down Sell
M&M 1396 1447 1437 1416 1406 1385 1374 1343 Down Sell
MARUTI 5689 5840 5804 5746 5710 5652 5616 5522 Down Sell
NTPC 153 158 156 154 152 151 149 145 Up Buy
ONGC 267 283 279 273 269 263 260 250 Down Sell
POWERGRID 181 186 185 183 182 180 179 176 Down Sell
RELIANCE 1090 1123 1115 1102 1094 1082 1073 1053 Down Sell
SBIN 260 269 267 263 261 258 256 251 Down Sell
SUNPHARMA 762 779 774 768 763 757 751 740 Down Sell
TATAMOTORS 557 576 569 563 556 551 544 531 Up Buy
TATAMTRDVR 358 373 367 362 356 352 346 335 Up Buy
TATAPOWER 78 80 80 79 78 77 77 75 Down Sell
TATASTEEL 389 402 399 394 392 387 384 377 Down Sell
TCS 2386 2448 2432 2409 2393 2370 2353 2314 Down Sell
TECHM 425 440 437 431 427 421 417 407 Down Sell
ULTRACEMCO 4031 4176 4110 4070 4005 3965 3899 3793 Up Buy
WIPRO 480 490 486 483 480 477 473 467 Up Buy
YESBANK 1274 1317 1307 1291 1281 1264 1254 1228 Down Sell
ZEEL 566 586 580 573 567 560 554 542 Down Sell
5. Equity Bazaar
SEBI Registered– Research Analyst Equities I Commodities I Currencies I Mutual Funds
Contact Us
www.choicebroking.in
Kkunal Parar
Sr. Research Associate
kkunal.parar@choiceindia.com
Vikas Chaudhari
Research Associate
vikas.chaudhari@choiceindia.com
www.choicebroking.incustomercare@choiceindia.com
Disclaimer
This is solely for information of clients of Choice Broking and does not construe to be an investment advice. It is also not intended as an offer or solicitation for the purchase and sale of any financial
instruments. Any action taken by you on the basis of the information contained herein is your responsibility alone and Choice Broking its subsidiaries or its employees or associates will not be liable in
any manner for the consequences of such action taken by you. We have exercised due diligence in checking the correctness and authenticity of the information contained in this recommendation, but
Choice Broking or any of its subsidiaries or associates or employees shall not be in any way responsible for any loss or damage that may arise to any person from any inadvertent error in the
information contained in this recommendation or any action taken on basis of this information. Technical analysis studies market psychology, price patterns and volume levels. It is used to forecast
future price and market movements. Technical analysis is complementary to fundamental analysis and news sources. The recommendations issued herewith might be contrary to recommendations
issued by Choice Broking in the company research undertaken as the recommendations stated in this report is derived purely from technical analysis. Choice Broking has based this document on
information obtained from sources it believes to be reliable but which it has not independently verified; Choice Broking makes no guarantee, representation or warranty and accepts no responsibility
or liability as to its accuracy or completeness. The opinions contained within the report are based upon publicly available information at the time of publication and are subject to change without
notice. The information and any disclosures provided herein are in summary form and have been prepared for informational purposes. The recommendations and suggested price levels are intended
purely for trading purposes. The recommendations are valid for the day of the report however trading trends and volumes might vary substantially on an intraday basis and the recommendations may
be subject to change. The information and any disclosures provided herein may be considered confidential. Any use, distribution, modification, copying, forwarding or disclosure by any person is
strictly prohibited. The information and any disclosures provided herein do not constitute a solicitation or offer to purchase or sell any security or other financial product or instrument. The current
performance may be unaudited. Past performance does not guarantee future returns. There can be no assurance that investments will achieve any targeted rates of return, and there is no guarantee
against the loss of your entire investment.
POTENTIAL CONFLICT OF INTEREST DISCLOSURE (as on date of report) Disclosure of interest statement – • Analyst interest of the stock /Instrument(s): - No. • Firm interest of the stock /
Instrument (s): - No.
Amit Pathania
Research Associate
amit.pathania@choiceindia.com
06th October, 2016
Kapil Shah
Research Associate
kapil.shah@choiceindia.com
Kapil Shah
Digitally signed by Kapil Shah
DN: cn=Kapil Shah, o=Choice Equity Pvt Ltd,
ou=Research Team,
email=kapil.shah@choiceindia.com, c=US
Date: 2016.10.06 09:13:57 +05'30'