SlideShare a Scribd company logo
1 of 21
Download to read offline
Control Charts SigmaXL® Version 6.1
Summary Report on Test for Special
Causes

Control Charts: Overview

Use Historical Groups to Display
Before VS After Improvement

Individuals & Moving Range Charts

Scroll Through Charts

X-Bar & R/S Charts

Process Capability Report (Long
Term/Short Term)

I-MR-R/S Charts (Between/Within)

Individuals Charts for Non-normal
Data: Johnson Transformation

Control Chart Selection Tool

Use Historical Limits; Flag Special
Causes

Add Comments as Data Labels

Box-Cox Power Transformation

Reliability/Weilbull Analysis

Training Opportunities
Control Charts










Individuals
Individuals & Moving Range
X-bar & R
X-bar & S
P, NP, C, U
P’ and U’ (Laney) to handle overdispersion
I-MR-R (Between/Within)
I-MR-S (Between/Within)
Back to
Index
Control Charts


Tests for Special Causes





Control Chart Selection Tool




Special causes are also labeled on the control
chart data point.
Set defaults to apply any or all of Tests 1-8

Simplifies the selection of appropriate control chart
based on data type

Process Capability report



Pp, Ppk, Cp, Cpk
Available for I, I-MR, X-Bar & R, X-bar & S charts.
Back to
Index
Control Charts


Add data to existing charts – ideal for
operator ease of use!



Scroll through charts with user defined
window size
Advanced Control Limit options: Subgroup
Start and End; Historical Groups (e.g. split
control limits to demonstrate before and after
improvement)



Back to
Index
Control Charts





Exclude data points for control limit calculation
Add comment to data point for assignable cause
± 1, 2 Sigma Zone Lines
Control Charts for Nonnormal data








Box-Cox and Johnson Transformations
16 Nonnormal distributions supported (see Capability
Combination Report for Nonnormal Data)
Individuals chart of original data with percentile based
control limits
Individuals/Moving Range chart for normalized data with
optional tests for special causes
Back to
Index
Control Charts:
Individuals &
Moving Range Charts

Back to
Index
oe

oe

oe

oe

oe

oe

oe

oe

8

Da
vid

Su
e

Sa
lly

M

Jo
hn

Da
vid

Su
e

Sa
lly

M

Jo
hn

Da
vid

Su
e

Sa
lly

M

Jo
hn

Da
vid

Su
e

Sa
lly

M

Jo
hn

X-Bar - Shot 1 - Shot 3
109.5292156

Da
vid

Su
e

Sa
lly

M

Jo
hn

Da
vid

Su
e

Sa
lly

M

Jo
hn

Da
vid

Su
e

Sa
lly

M

Jo
hn

Da
vid

Su
e

Sa
lly

M

Jo
hn

R - Shot 1 - Shot 3

Control Charts:
X-bar & R/S Charts

114.5292156

106.81

104.5292156

99.52921561
100.37

94.52921561
93.92

89.52921561

84.52921561

16
16.21776

14

12

10

6
6.30000

4

2

0
0.00000

Back to
Index
oe

oe

oe

oe

oe

oe

oe

oe

oe

oe

oe

oe

4.00

8.00

Da
vid

Su
e

Sa
lly

M

Jo
hn

Da
vid

Su
e

Sa
lly

M

Jo
hn

Da
vid

Su
e

Sa
lly

M

Jo
hn

Da
vid

Su
e

Sa
lly

M

Jo
hn

Individuals - Shot 1 - Shot 3
102.35

Su
e

Sa
lly

M

Jo
hn

Da
vid

Su
e

Sa
lly

M

Jo
hn

Da
vid

Su
e

Sa
lly

M

Jo
hn

Da
vid

Su
e

Sa
lly

M

Jo
hn

MR - Shot 1 - Shot 3
112.35

Sa
lly

M

Jo
hn

Da
vid

Su
e

Sa
lly

M

Jo
hn

Da
vid

Su
e

Sa
lly

M

Jo
hn

Da
vid

Su
e

Sa
lly

M

Jo
hn

R - Shot 1 - Shot 3

Control Charts: I-MR-R/S
Charts (Between/Within)

117.35

107.35
109.23

97.35
100.37

92.35
91.50

87.35

82.35

10.00
10.89000

8.00

6.00

3.33333

2.00

0.00
0.00000

16.00
16.21776

14.00

12.00

10.00

6.00
6.30000

4.00

2.00

0.00
0.00000

Back to
Index
Control Chart Selection
Tool




Simplifies the
selection of
appropriate control
chart based on
data type
Includes Data
Types and
Definitions help
tab.

Back to
Index
Control Charts:
Use Historical Limits;
Flag Special Causes
1

109.15

1 106.81

107.15
105.15
103.15
100.37

101.15
99.15
97.15
95.15

93.92

25

24

23

22

21

20

19

18

17

16

15

14

13

12

11

10

9

8

7

6

5

4

3

2

93.15

1

X-Bar - Shot 1 - Shot 3

5

Back to
Index
Control Charts:
Add Comments as Data Labels

Back to
Index
Control Charts:
Summary Report on
Tests for Special Causes

Back to
Index
Control Charts:
Use Historical Groups to
Display Before Versus
After Improvement
Individuals - Delivery Time Deviation

31

Before Improvement

After Improvement

26
21
16
11
7.00

6
1

Mean CL: 0.10

-4

-6.80

-9
-14
-19

Back to
Index
Control Charts:
Scroll Through Charts With
User Defined Window Size

Back to
Index
Control Charts:
Process Capability Report
(Long Term/Short Term)

Back to
Index
Individuals Chart for
Nonnormal Data:
Johnson Transformation

Back to
Index
Individuals/Moving Range
Chart for Nonnormal Data:
Johnson Transformation

Back to
Index
Control Charts:
Box-Cox Power
Transformation

Normality Test is
automatically applied
to transformed data!

Back to
Index
Reliability/Weibull
Analysis


Weibull Analysis






Complete and Right Censored data
Least Squares and Maximum Likelihood
methods
Output includes percentiles with confidence
intervals, survival probabilities, and Weibull
probability plot.
Back to
Index
SigmaXL® Training







We now offer On-Site Training in SigmaXL.
Course Duration: 4.5 Days.
Instructor is John Noguera, SigmaXL co-founder,
Six Sigma Master Black Belt, Motorola University
Senior Instructor.
Hands-on exercises with catapult.

Back to
Index
SigmaXL® Training
Course Contents:
 Day 1: Introduction to SigmaXL, Basic
Graphical Tools and Descriptive Statistics
 Day 2: Measurement Systems Analysis,
Process Capability
 Day 3: Comparative Methods, Multi-Vari
Analysis
 Day 4: Correlation, Regression and
Introduction to DOE
 Day 5: Statistical Process Control

Back to
Index

More Related Content

What's hot

Methods of data presentation
Methods of data presentation Methods of data presentation
Methods of data presentation Dr Athar Khan
 
Attributes Control Charts
Attributes Control ChartsAttributes Control Charts
Attributes Control Chartsahmad bassiouny
 
P chart & c-chart
P chart & c-chartP chart & c-chart
P chart & c-chartprinku k
 
control Chart u np c p
control Chart u np c pcontrol Chart u np c p
control Chart u np c pblactigger401
 
Performance Of A Combined Shewhart-Cusum Control Chart With Binomial Data For...
Performance Of A Combined Shewhart-Cusum Control Chart With Binomial Data For...Performance Of A Combined Shewhart-Cusum Control Chart With Binomial Data For...
Performance Of A Combined Shewhart-Cusum Control Chart With Binomial Data For...IJERA Editor
 
JF608: Quality Control - Unit 4
JF608: Quality Control - Unit 4JF608: Quality Control - Unit 4
JF608: Quality Control - Unit 4Asraf Malik
 

What's hot (11)

P Chart Tutorial
P Chart TutorialP Chart Tutorial
P Chart Tutorial
 
Methods of data presentation
Methods of data presentation Methods of data presentation
Methods of data presentation
 
Attributes Control Charts
Attributes Control ChartsAttributes Control Charts
Attributes Control Charts
 
Control charts
Control chartsControl charts
Control charts
 
P chart & c-chart
P chart & c-chartP chart & c-chart
P chart & c-chart
 
control Chart u np c p
control Chart u np c pcontrol Chart u np c p
control Chart u np c p
 
Performance Of A Combined Shewhart-Cusum Control Chart With Binomial Data For...
Performance Of A Combined Shewhart-Cusum Control Chart With Binomial Data For...Performance Of A Combined Shewhart-Cusum Control Chart With Binomial Data For...
Performance Of A Combined Shewhart-Cusum Control Chart With Binomial Data For...
 
P Charts
P ChartsP Charts
P Charts
 
Quality management training
Quality management trainingQuality management training
Quality management training
 
JF608: Quality Control - Unit 4
JF608: Quality Control - Unit 4JF608: Quality Control - Unit 4
JF608: Quality Control - Unit 4
 
Presentation1
Presentation1Presentation1
Presentation1
 

Similar to Control charts

Copyright © 2016 John Wiley & Sons, Inc.Chapter 6 - Stat.docx
Copyright © 2016 John Wiley & Sons, Inc.Chapter 6 - Stat.docxCopyright © 2016 John Wiley & Sons, Inc.Chapter 6 - Stat.docx
Copyright © 2016 John Wiley & Sons, Inc.Chapter 6 - Stat.docxbobbywlane695641
 
UNIT III.pptx
UNIT III.pptxUNIT III.pptx
UNIT III.pptxMECHHOD6
 
TQM control charts for variables and attributes
TQM control charts for variables and attributesTQM control charts for variables and attributes
TQM control charts for variables and attributesTamilselvan S
 
The 7 basic quality tools through minitab 18
The 7 basic quality tools through minitab 18The 7 basic quality tools through minitab 18
The 7 basic quality tools through minitab 18RAMAR BOSE
 
Copyright © 2016 John Wiley & Sons, Inc.ITS 631 Chapte.docx
Copyright © 2016 John Wiley & Sons, Inc.ITS 631 Chapte.docxCopyright © 2016 John Wiley & Sons, Inc.ITS 631 Chapte.docx
Copyright © 2016 John Wiley & Sons, Inc.ITS 631 Chapte.docxbobbywlane695641
 
Use of control charts in laboratory as per ISO 17025:2017
Use of control charts in laboratory as per ISO 17025:2017Use of control charts in laboratory as per ISO 17025:2017
Use of control charts in laboratory as per ISO 17025:2017Rahul Gupta
 
JF608: Quality Control - Unit 3
JF608: Quality Control - Unit 3JF608: Quality Control - Unit 3
JF608: Quality Control - Unit 3Asraf Malik
 
supplement-6-e28093-spc.ppt- SPC_ Operation Management
supplement-6-e28093-spc.ppt- SPC_ Operation Managementsupplement-6-e28093-spc.ppt- SPC_ Operation Management
supplement-6-e28093-spc.ppt- SPC_ Operation ManagementRanjeet338208
 
Understanding SPC Charts for Quality Control.pdf
Understanding SPC Charts for Quality Control.pdfUnderstanding SPC Charts for Quality Control.pdf
Understanding SPC Charts for Quality Control.pdfjawadullah25
 
Statistical quality control presentation
Statistical quality control presentationStatistical quality control presentation
Statistical quality control presentationSuchitra Sahu
 
Quality and statistical process control ppt @ bec doms
Quality and statistical process control ppt @ bec domsQuality and statistical process control ppt @ bec doms
Quality and statistical process control ppt @ bec domsBabasab Patil
 
A-guide-to-creating-and-interpreting-run-and-control-charts
A-guide-to-creating-and-interpreting-run-and-control-chartsA-guide-to-creating-and-interpreting-run-and-control-charts
A-guide-to-creating-and-interpreting-run-and-control-chartsRohitLakhotia12
 
Control charts[1]
Control charts[1]Control charts[1]
Control charts[1]66784532
 

Similar to Control charts (20)

Copyright © 2016 John Wiley & Sons, Inc.Chapter 6 - Stat.docx
Copyright © 2016 John Wiley & Sons, Inc.Chapter 6 - Stat.docxCopyright © 2016 John Wiley & Sons, Inc.Chapter 6 - Stat.docx
Copyright © 2016 John Wiley & Sons, Inc.Chapter 6 - Stat.docx
 
Control chart ppt
Control chart pptControl chart ppt
Control chart ppt
 
UNIT III.pptx
UNIT III.pptxUNIT III.pptx
UNIT III.pptx
 
Qc tools
Qc toolsQc tools
Qc tools
 
Qc tools
Qc toolsQc tools
Qc tools
 
TQM control charts for variables and attributes
TQM control charts for variables and attributesTQM control charts for variables and attributes
TQM control charts for variables and attributes
 
The 7 basic quality tools through minitab 18
The 7 basic quality tools through minitab 18The 7 basic quality tools through minitab 18
The 7 basic quality tools through minitab 18
 
Copyright © 2016 John Wiley & Sons, Inc.ITS 631 Chapte.docx
Copyright © 2016 John Wiley & Sons, Inc.ITS 631 Chapte.docxCopyright © 2016 John Wiley & Sons, Inc.ITS 631 Chapte.docx
Copyright © 2016 John Wiley & Sons, Inc.ITS 631 Chapte.docx
 
Use of control charts in laboratory as per ISO 17025:2017
Use of control charts in laboratory as per ISO 17025:2017Use of control charts in laboratory as per ISO 17025:2017
Use of control charts in laboratory as per ISO 17025:2017
 
JF608: Quality Control - Unit 3
JF608: Quality Control - Unit 3JF608: Quality Control - Unit 3
JF608: Quality Control - Unit 3
 
supplement-6-e28093-spc.ppt- SPC_ Operation Management
supplement-6-e28093-spc.ppt- SPC_ Operation Managementsupplement-6-e28093-spc.ppt- SPC_ Operation Management
supplement-6-e28093-spc.ppt- SPC_ Operation Management
 
Contrlchart
ContrlchartContrlchart
Contrlchart
 
WEI_ZHENGTAI_SPC
WEI_ZHENGTAI_SPCWEI_ZHENGTAI_SPC
WEI_ZHENGTAI_SPC
 
X bar and-r_charts
X bar and-r_chartsX bar and-r_charts
X bar and-r_charts
 
Understanding SPC Charts for Quality Control.pdf
Understanding SPC Charts for Quality Control.pdfUnderstanding SPC Charts for Quality Control.pdf
Understanding SPC Charts for Quality Control.pdf
 
Statistical quality control presentation
Statistical quality control presentationStatistical quality control presentation
Statistical quality control presentation
 
Quality and statistical process control ppt @ bec doms
Quality and statistical process control ppt @ bec domsQuality and statistical process control ppt @ bec doms
Quality and statistical process control ppt @ bec doms
 
A-guide-to-creating-and-interpreting-run-and-control-charts
A-guide-to-creating-and-interpreting-run-and-control-chartsA-guide-to-creating-and-interpreting-run-and-control-charts
A-guide-to-creating-and-interpreting-run-and-control-charts
 
Control Charts[1]
Control Charts[1]Control Charts[1]
Control Charts[1]
 
Control charts[1]
Control charts[1]Control charts[1]
Control charts[1]
 

More from Cynthia Cumby

More from Cynthia Cumby (7)

Sigma xl eula
Sigma xl eulaSigma xl eula
Sigma xl eula
 
Design of experiments
Design of experimentsDesign of experiments
Design of experiments
 
Graphical tools
Graphical toolsGraphical tools
Graphical tools
 
Measurement system analysis
Measurement system analysisMeasurement system analysis
Measurement system analysis
 
Stats tools
Stats toolsStats tools
Stats tools
 
Templates & Calculators
Templates & CalculatorsTemplates & Calculators
Templates & Calculators
 
Sigma xl getting_started
Sigma xl getting_startedSigma xl getting_started
Sigma xl getting_started
 

Recently uploaded

4.18.24 Movement Legacies, Reflection, and Review.pptx
4.18.24 Movement Legacies, Reflection, and Review.pptx4.18.24 Movement Legacies, Reflection, and Review.pptx
4.18.24 Movement Legacies, Reflection, and Review.pptxmary850239
 
DATA STRUCTURE AND ALGORITHM for beginners
DATA STRUCTURE AND ALGORITHM for beginnersDATA STRUCTURE AND ALGORITHM for beginners
DATA STRUCTURE AND ALGORITHM for beginnersSabitha Banu
 
ECONOMIC CONTEXT - PAPER 1 Q3: NEWSPAPERS.pptx
ECONOMIC CONTEXT - PAPER 1 Q3: NEWSPAPERS.pptxECONOMIC CONTEXT - PAPER 1 Q3: NEWSPAPERS.pptx
ECONOMIC CONTEXT - PAPER 1 Q3: NEWSPAPERS.pptxiammrhaywood
 
ACC 2024 Chronicles. Cardiology. Exam.pdf
ACC 2024 Chronicles. Cardiology. Exam.pdfACC 2024 Chronicles. Cardiology. Exam.pdf
ACC 2024 Chronicles. Cardiology. Exam.pdfSpandanaRallapalli
 
How to Add Barcode on PDF Report in Odoo 17
How to Add Barcode on PDF Report in Odoo 17How to Add Barcode on PDF Report in Odoo 17
How to Add Barcode on PDF Report in Odoo 17Celine George
 
GRADE 4 - SUMMATIVE TEST QUARTER 4 ALL SUBJECTS
GRADE 4 - SUMMATIVE TEST QUARTER 4 ALL SUBJECTSGRADE 4 - SUMMATIVE TEST QUARTER 4 ALL SUBJECTS
GRADE 4 - SUMMATIVE TEST QUARTER 4 ALL SUBJECTSJoshuaGantuangco2
 
ENGLISH 7_Q4_LESSON 2_ Employing a Variety of Strategies for Effective Interp...
ENGLISH 7_Q4_LESSON 2_ Employing a Variety of Strategies for Effective Interp...ENGLISH 7_Q4_LESSON 2_ Employing a Variety of Strategies for Effective Interp...
ENGLISH 7_Q4_LESSON 2_ Employing a Variety of Strategies for Effective Interp...JhezDiaz1
 
Choosing the Right CBSE School A Comprehensive Guide for Parents
Choosing the Right CBSE School A Comprehensive Guide for ParentsChoosing the Right CBSE School A Comprehensive Guide for Parents
Choosing the Right CBSE School A Comprehensive Guide for Parentsnavabharathschool99
 
INTRODUCTION TO CATHOLIC CHRISTOLOGY.pptx
INTRODUCTION TO CATHOLIC CHRISTOLOGY.pptxINTRODUCTION TO CATHOLIC CHRISTOLOGY.pptx
INTRODUCTION TO CATHOLIC CHRISTOLOGY.pptxHumphrey A Beña
 
Roles & Responsibilities in Pharmacovigilance
Roles & Responsibilities in PharmacovigilanceRoles & Responsibilities in Pharmacovigilance
Roles & Responsibilities in PharmacovigilanceSamikshaHamane
 
ISYU TUNGKOL SA SEKSWLADIDA (ISSUE ABOUT SEXUALITY
ISYU TUNGKOL SA SEKSWLADIDA (ISSUE ABOUT SEXUALITYISYU TUNGKOL SA SEKSWLADIDA (ISSUE ABOUT SEXUALITY
ISYU TUNGKOL SA SEKSWLADIDA (ISSUE ABOUT SEXUALITYKayeClaireEstoconing
 
Field Attribute Index Feature in Odoo 17
Field Attribute Index Feature in Odoo 17Field Attribute Index Feature in Odoo 17
Field Attribute Index Feature in Odoo 17Celine George
 
Full Stack Web Development Course for Beginners
Full Stack Web Development Course  for BeginnersFull Stack Web Development Course  for Beginners
Full Stack Web Development Course for BeginnersSabitha Banu
 
What is Model Inheritance in Odoo 17 ERP
What is Model Inheritance in Odoo 17 ERPWhat is Model Inheritance in Odoo 17 ERP
What is Model Inheritance in Odoo 17 ERPCeline George
 
USPS® Forced Meter Migration - How to Know if Your Postage Meter Will Soon be...
USPS® Forced Meter Migration - How to Know if Your Postage Meter Will Soon be...USPS® Forced Meter Migration - How to Know if Your Postage Meter Will Soon be...
USPS® Forced Meter Migration - How to Know if Your Postage Meter Will Soon be...Postal Advocate Inc.
 
Influencing policy (training slides from Fast Track Impact)
Influencing policy (training slides from Fast Track Impact)Influencing policy (training slides from Fast Track Impact)
Influencing policy (training slides from Fast Track Impact)Mark Reed
 

Recently uploaded (20)

4.18.24 Movement Legacies, Reflection, and Review.pptx
4.18.24 Movement Legacies, Reflection, and Review.pptx4.18.24 Movement Legacies, Reflection, and Review.pptx
4.18.24 Movement Legacies, Reflection, and Review.pptx
 
LEFT_ON_C'N_ PRELIMS_EL_DORADO_2024.pptx
LEFT_ON_C'N_ PRELIMS_EL_DORADO_2024.pptxLEFT_ON_C'N_ PRELIMS_EL_DORADO_2024.pptx
LEFT_ON_C'N_ PRELIMS_EL_DORADO_2024.pptx
 
DATA STRUCTURE AND ALGORITHM for beginners
DATA STRUCTURE AND ALGORITHM for beginnersDATA STRUCTURE AND ALGORITHM for beginners
DATA STRUCTURE AND ALGORITHM for beginners
 
ECONOMIC CONTEXT - PAPER 1 Q3: NEWSPAPERS.pptx
ECONOMIC CONTEXT - PAPER 1 Q3: NEWSPAPERS.pptxECONOMIC CONTEXT - PAPER 1 Q3: NEWSPAPERS.pptx
ECONOMIC CONTEXT - PAPER 1 Q3: NEWSPAPERS.pptx
 
Model Call Girl in Tilak Nagar Delhi reach out to us at 🔝9953056974🔝
Model Call Girl in Tilak Nagar Delhi reach out to us at 🔝9953056974🔝Model Call Girl in Tilak Nagar Delhi reach out to us at 🔝9953056974🔝
Model Call Girl in Tilak Nagar Delhi reach out to us at 🔝9953056974🔝
 
ACC 2024 Chronicles. Cardiology. Exam.pdf
ACC 2024 Chronicles. Cardiology. Exam.pdfACC 2024 Chronicles. Cardiology. Exam.pdf
ACC 2024 Chronicles. Cardiology. Exam.pdf
 
How to Add Barcode on PDF Report in Odoo 17
How to Add Barcode on PDF Report in Odoo 17How to Add Barcode on PDF Report in Odoo 17
How to Add Barcode on PDF Report in Odoo 17
 
GRADE 4 - SUMMATIVE TEST QUARTER 4 ALL SUBJECTS
GRADE 4 - SUMMATIVE TEST QUARTER 4 ALL SUBJECTSGRADE 4 - SUMMATIVE TEST QUARTER 4 ALL SUBJECTS
GRADE 4 - SUMMATIVE TEST QUARTER 4 ALL SUBJECTS
 
ENGLISH 7_Q4_LESSON 2_ Employing a Variety of Strategies for Effective Interp...
ENGLISH 7_Q4_LESSON 2_ Employing a Variety of Strategies for Effective Interp...ENGLISH 7_Q4_LESSON 2_ Employing a Variety of Strategies for Effective Interp...
ENGLISH 7_Q4_LESSON 2_ Employing a Variety of Strategies for Effective Interp...
 
Choosing the Right CBSE School A Comprehensive Guide for Parents
Choosing the Right CBSE School A Comprehensive Guide for ParentsChoosing the Right CBSE School A Comprehensive Guide for Parents
Choosing the Right CBSE School A Comprehensive Guide for Parents
 
INTRODUCTION TO CATHOLIC CHRISTOLOGY.pptx
INTRODUCTION TO CATHOLIC CHRISTOLOGY.pptxINTRODUCTION TO CATHOLIC CHRISTOLOGY.pptx
INTRODUCTION TO CATHOLIC CHRISTOLOGY.pptx
 
Roles & Responsibilities in Pharmacovigilance
Roles & Responsibilities in PharmacovigilanceRoles & Responsibilities in Pharmacovigilance
Roles & Responsibilities in Pharmacovigilance
 
ISYU TUNGKOL SA SEKSWLADIDA (ISSUE ABOUT SEXUALITY
ISYU TUNGKOL SA SEKSWLADIDA (ISSUE ABOUT SEXUALITYISYU TUNGKOL SA SEKSWLADIDA (ISSUE ABOUT SEXUALITY
ISYU TUNGKOL SA SEKSWLADIDA (ISSUE ABOUT SEXUALITY
 
FINALS_OF_LEFT_ON_C'N_EL_DORADO_2024.pptx
FINALS_OF_LEFT_ON_C'N_EL_DORADO_2024.pptxFINALS_OF_LEFT_ON_C'N_EL_DORADO_2024.pptx
FINALS_OF_LEFT_ON_C'N_EL_DORADO_2024.pptx
 
Field Attribute Index Feature in Odoo 17
Field Attribute Index Feature in Odoo 17Field Attribute Index Feature in Odoo 17
Field Attribute Index Feature in Odoo 17
 
Full Stack Web Development Course for Beginners
Full Stack Web Development Course  for BeginnersFull Stack Web Development Course  for Beginners
Full Stack Web Development Course for Beginners
 
What is Model Inheritance in Odoo 17 ERP
What is Model Inheritance in Odoo 17 ERPWhat is Model Inheritance in Odoo 17 ERP
What is Model Inheritance in Odoo 17 ERP
 
USPS® Forced Meter Migration - How to Know if Your Postage Meter Will Soon be...
USPS® Forced Meter Migration - How to Know if Your Postage Meter Will Soon be...USPS® Forced Meter Migration - How to Know if Your Postage Meter Will Soon be...
USPS® Forced Meter Migration - How to Know if Your Postage Meter Will Soon be...
 
YOUVE_GOT_EMAIL_PRELIMS_EL_DORADO_2024.pptx
YOUVE_GOT_EMAIL_PRELIMS_EL_DORADO_2024.pptxYOUVE_GOT_EMAIL_PRELIMS_EL_DORADO_2024.pptx
YOUVE_GOT_EMAIL_PRELIMS_EL_DORADO_2024.pptx
 
Influencing policy (training slides from Fast Track Impact)
Influencing policy (training slides from Fast Track Impact)Influencing policy (training slides from Fast Track Impact)
Influencing policy (training slides from Fast Track Impact)
 

Control charts

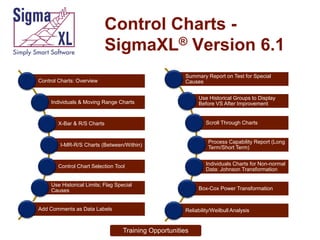
  • 1. Control Charts SigmaXL® Version 6.1 Summary Report on Test for Special Causes Control Charts: Overview Use Historical Groups to Display Before VS After Improvement Individuals & Moving Range Charts Scroll Through Charts X-Bar & R/S Charts Process Capability Report (Long Term/Short Term) I-MR-R/S Charts (Between/Within) Individuals Charts for Non-normal Data: Johnson Transformation Control Chart Selection Tool Use Historical Limits; Flag Special Causes Add Comments as Data Labels Box-Cox Power Transformation Reliability/Weilbull Analysis Training Opportunities
  • 2. Control Charts         Individuals Individuals & Moving Range X-bar & R X-bar & S P, NP, C, U P’ and U’ (Laney) to handle overdispersion I-MR-R (Between/Within) I-MR-S (Between/Within) Back to Index
  • 3. Control Charts  Tests for Special Causes    Control Chart Selection Tool   Special causes are also labeled on the control chart data point. Set defaults to apply any or all of Tests 1-8 Simplifies the selection of appropriate control chart based on data type Process Capability report   Pp, Ppk, Cp, Cpk Available for I, I-MR, X-Bar & R, X-bar & S charts. Back to Index
  • 4. Control Charts  Add data to existing charts – ideal for operator ease of use!  Scroll through charts with user defined window size Advanced Control Limit options: Subgroup Start and End; Historical Groups (e.g. split control limits to demonstrate before and after improvement)  Back to Index
  • 5. Control Charts     Exclude data points for control limit calculation Add comment to data point for assignable cause ± 1, 2 Sigma Zone Lines Control Charts for Nonnormal data     Box-Cox and Johnson Transformations 16 Nonnormal distributions supported (see Capability Combination Report for Nonnormal Data) Individuals chart of original data with percentile based control limits Individuals/Moving Range chart for normalized data with optional tests for special causes Back to Index
  • 6. Control Charts: Individuals & Moving Range Charts Back to Index
  • 7. oe oe oe oe oe oe oe oe 8 Da vid Su e Sa lly M Jo hn Da vid Su e Sa lly M Jo hn Da vid Su e Sa lly M Jo hn Da vid Su e Sa lly M Jo hn X-Bar - Shot 1 - Shot 3 109.5292156 Da vid Su e Sa lly M Jo hn Da vid Su e Sa lly M Jo hn Da vid Su e Sa lly M Jo hn Da vid Su e Sa lly M Jo hn R - Shot 1 - Shot 3 Control Charts: X-bar & R/S Charts 114.5292156 106.81 104.5292156 99.52921561 100.37 94.52921561 93.92 89.52921561 84.52921561 16 16.21776 14 12 10 6 6.30000 4 2 0 0.00000 Back to Index
  • 8. oe oe oe oe oe oe oe oe oe oe oe oe 4.00 8.00 Da vid Su e Sa lly M Jo hn Da vid Su e Sa lly M Jo hn Da vid Su e Sa lly M Jo hn Da vid Su e Sa lly M Jo hn Individuals - Shot 1 - Shot 3 102.35 Su e Sa lly M Jo hn Da vid Su e Sa lly M Jo hn Da vid Su e Sa lly M Jo hn Da vid Su e Sa lly M Jo hn MR - Shot 1 - Shot 3 112.35 Sa lly M Jo hn Da vid Su e Sa lly M Jo hn Da vid Su e Sa lly M Jo hn Da vid Su e Sa lly M Jo hn R - Shot 1 - Shot 3 Control Charts: I-MR-R/S Charts (Between/Within) 117.35 107.35 109.23 97.35 100.37 92.35 91.50 87.35 82.35 10.00 10.89000 8.00 6.00 3.33333 2.00 0.00 0.00000 16.00 16.21776 14.00 12.00 10.00 6.00 6.30000 4.00 2.00 0.00 0.00000 Back to Index
  • 9. Control Chart Selection Tool   Simplifies the selection of appropriate control chart based on data type Includes Data Types and Definitions help tab. Back to Index
  • 10. Control Charts: Use Historical Limits; Flag Special Causes 1 109.15 1 106.81 107.15 105.15 103.15 100.37 101.15 99.15 97.15 95.15 93.92 25 24 23 22 21 20 19 18 17 16 15 14 13 12 11 10 9 8 7 6 5 4 3 2 93.15 1 X-Bar - Shot 1 - Shot 3 5 Back to Index
  • 11. Control Charts: Add Comments as Data Labels Back to Index
  • 12. Control Charts: Summary Report on Tests for Special Causes Back to Index
  • 13. Control Charts: Use Historical Groups to Display Before Versus After Improvement Individuals - Delivery Time Deviation 31 Before Improvement After Improvement 26 21 16 11 7.00 6 1 Mean CL: 0.10 -4 -6.80 -9 -14 -19 Back to Index
  • 14. Control Charts: Scroll Through Charts With User Defined Window Size Back to Index
  • 15. Control Charts: Process Capability Report (Long Term/Short Term) Back to Index
  • 16. Individuals Chart for Nonnormal Data: Johnson Transformation Back to Index
  • 17. Individuals/Moving Range Chart for Nonnormal Data: Johnson Transformation Back to Index
  • 18. Control Charts: Box-Cox Power Transformation Normality Test is automatically applied to transformed data! Back to Index
  • 19. Reliability/Weibull Analysis  Weibull Analysis    Complete and Right Censored data Least Squares and Maximum Likelihood methods Output includes percentiles with confidence intervals, survival probabilities, and Weibull probability plot. Back to Index
  • 20. SigmaXL® Training     We now offer On-Site Training in SigmaXL. Course Duration: 4.5 Days. Instructor is John Noguera, SigmaXL co-founder, Six Sigma Master Black Belt, Motorola University Senior Instructor. Hands-on exercises with catapult. Back to Index
  • 21. SigmaXL® Training Course Contents:  Day 1: Introduction to SigmaXL, Basic Graphical Tools and Descriptive Statistics  Day 2: Measurement Systems Analysis, Process Capability  Day 3: Comparative Methods, Multi-Vari Analysis  Day 4: Correlation, Regression and Introduction to DOE  Day 5: Statistical Process Control Back to Index