SlideShare a Scribd company logo
1 of 29
Control Charts
GE6757- Total Quality Management
Control Charts
Prepared By,
V.Sutha Jebakumari, AP/CSE
L.Shanmuga Priya, AP/CSE,
Kamaraj College of Engineering & Technology,
Virudhunagar.
Control Charts
• Walter Shewhart first utilized control charts in
1924 to aid the world of manufacturing. Control
charts have two general uses in an improvement
project.
• The most common application is as a tool to
monitor process stability and control.
Control Charts
• “No matter how well the process is designed,
there exists a certain amount of nature variability
in output measurements.“
• A control chart tells us how much variation the
process causes.
• A stable process produces predictable results
consistently. An example of a control chart that
shows an unstable process means variables
affected must be analyzed and controlled before
the improvement process can begin.
Types of control charts
• There are two types of control charts; those that
analyze attributes and those that look at variables
in a process or project. Examples of a control chart
include:
• X-Bar & R Control Charts
• X-Bar & S Control Charts
• U Charts
• P Control Charts
• C Control Charts
Examples of Control Charts
• U Charts – These variable types of control charts utilize an upper and lower
range. Elements falling in the upper range need attention and analysis in order
for the problem to be corrected.
• X-Bar & R Charts – These variable charts utilize the X-Bar or the Mean to
determine subgroups. The R or Range plots the subgroups based on upper and
lower control limits. X-Bar & R Charts are the most widely utilized charts in
project management, however, are only successful if 5 or less subgroups are
analyzed.
• X-Bar & S Charts – Using this example of a variable control chart is effective for
5 or more subgroups and the S or Standard Deviations are considered in both
upper and lower control limits based on the X-Bar or Mean.
• p Control Charts – This attribute-type chart is effective when elements are not
equal. A p Control Chart might be used to determine how many accidents
occur each day at a chosen intersection.
• c Control Charts – Another attribute-type control chart, the c Control Chart
explores elements that are nonconforming. A c Control Chart might be used to
explore mass-production of one similar product where the elements per unit
do not conform to the norm.
Two causes of fluctuation
• Most examples of a control chart considers
two causes of fluctuation, common causes
and special causes.
Three categories of variation
1. Within piecewise variation(eg. Roughness of a
piece)
2. Piece to piece variation (light intensity of four
bulbs produced from a machine will be
different)
3. Time to time variation (difference in product
produced at different times of the day)
Second categories of variation
Variation is due to a combination of
1.Equipment
2.Materials
3.Environment
4.Operator
1. Equipment
• Source includes tool wear, machine vibrations
and electrical fluctuations.
• Even identical machines will have different
capabilities.
• It becomes crucial when scheduling the
manufacture of critical parts.
2. Material
• Because variation occurs in the finished
product, it must also occur in the raw
material.
• Quality characteristics as tensile strength,
ductility, thickness, porosity and moisture
content can be expected to contribute to the
overall variation in the final product.
3. Environment
• Temperature, light, radiation, particle size,
pressure and humidity all can contribute to
variation in the product.
• Experiments are conducted in outer space to
learn more about the effect of the environment
on product variation.
4. Operator
• The source of variation includes the method by
which the operator performs the operation.
• The operator’s physical and emotional well-
being contribute to the variation.
• A cut finger, a personal problem or a headache
can make an operator’s quality performance
vary.
Elements of a Control Chart
• A control chart begins with a time series graph.
• A central line (X) is added as a visual reference
for detecting shifts or trends – this is also
referred to as the process location.
• Upper and lower control limits (UCL and LCL) are
computed from available data and placed
equidistant from the central line. This is also
referred to as process dispersion.
•
• Control limits (CLs) ensure time is not wasted looking for
unnecessary trouble – the goal of any process
improvement practitioner should be to only take action
when warranted. Control limits are calculated by:
• Estimating the standard deviation, σ, of the sample data
• Multiplying that number by three
• Adding (3 x σ to the average) for the UCL and subtracting (3
x σ from the average) for the LCL
• Mathematically, the calculation of control limits looks like:
•
Run Charts
• Monitor the performance of one or more
processes over time to detect trends, shifts or
cycles.
• Allow us to compare a performance measure
before and after implementation of a solution to
measure its impact.
• Focuses attention on truly vital changes in the
process.
• Assess whether improved performance has been
sustained.
How to Create a Run Chart
There are seven steps to creating a run chart.
• Decide on the measure to be analyzed (assuming there is a
reliable measurement system in place).
• Gather the data – have a minimum of 10 data points.
• Draw a graph with a vertical line and a horizontal line.
• On the vertical line, or the y-axis, draw the scale relative to
the variable you are measuring.
• On the horizontal line, or the x-axis, draw the time or
sequence scale.
• Calculate the mean/median (whichever the data set
indicates to be appropriate) and draw a horizontal line at
that value – going across the graph.
• Plot the data in the sequence, or the time order, in which
the data was collected.
Characteristics of a run chart
• On the X axis you have data in some sort of
chronological order e.g. Jan, Feb, Mar
• On the Y axis you have the measure of interest
e.g. %, count
• Once the data points are connected you put a
centre line (CL) between the graph. For a run
chart the CL is called the Median.
Interpreting a run chart
• There are four rules that can be used to
interpret a run chart. Non-random variation
can be recognized by looking for:
• Rule 1 – Shift
Six or more consecutive points either all above
or all below the centre line (CL). Values that
fall on the CL do not add to nor break a shift.
Skip values that fall on the median and
continue counting.
Rule 1 – Shift
Rule 2 – Trend
• Five or more consecutive points all going up or
all going down. If the value of two or more
successive points is the same (repeats), ignore
the like points when counting.
Rule 2 – Trend
Rule 3 – Too many or too few runs
• A non-random pattern is signalled by too few or too
many runs, or crossings of the median line. If there are
too many or too few runs, this is a sign of non-random
variation. An easy way to count the number of runs is
to count the number of times the line connecting all
the data points crosses the median and add one. If the
number of runs you have are:
• Within the range outlined in the table, then you have a
random pattern.
• Outside the range outline in the table, then you have a
non-random pattern or signal of change.
Too many or too few runs
Rule 4 – An astronomical data point
• This is a data point that is clearly different
from all others. Different people looking at
the same graph would be expected to
recognize the same data point as
astronomical.
Rule 4 – An astronomical data point
By applying each of the four rules, you can evaluate the
run chart for a signal for change (through a non-
random variation). However, it is not necessary to find
evidence of change with each of the four rules to
determine that a change has occurred. Any single rule
occurring is sufficient evidence of a non-random signal
of change.
Benefits of Run Charts
The following are a few benefits of a run chart:
• Easy to draft.
• Easy to analyze and interpret.
• Does not require much technical skill.
• Straightforward representation of data.

More Related Content

What's hot

Statistical Quality Control
Statistical Quality ControlStatistical Quality Control
Statistical Quality ControlDr. Rana Singh
 
Statistical process control (spc)
Statistical process control (spc)Statistical process control (spc)
Statistical process control (spc)Ashish Chaudhari
 
Statistical Process Control
Statistical Process ControlStatistical Process Control
Statistical Process ControlTushar Naik
 
Introduction To Statistical Process Control
Introduction To Statistical Process ControlIntroduction To Statistical Process Control
Introduction To Statistical Process ControlGaurav bhatnagar
 
Introduction to control charts
Introduction to control chartsIntroduction to control charts
Introduction to control chartskavya ravali
 
Statistical Process control
Statistical Process controlStatistical Process control
Statistical Process controlPrashant Tomar
 
Control chart for variables
Control chart for variablesControl chart for variables
Control chart for variablesSahul Hameed
 
Control charts (p np c u)
Control charts (p np c u)Control charts (p np c u)
Control charts (p np c u)Vipul Wadhwa
 
Statistical Process Control,Control Chart and Process Capability
Statistical Process Control,Control Chart and Process CapabilityStatistical Process Control,Control Chart and Process Capability
Statistical Process Control,Control Chart and Process Capabilityvaidehishah25
 
Quality control and inspection
Quality control and inspectionQuality control and inspection
Quality control and inspectionSujal Topno
 
Statistical process control (spc)
Statistical process control (spc)Statistical process control (spc)
Statistical process control (spc)Ashish Chaudhari
 
Statistical Quality Control
Statistical Quality ControlStatistical Quality Control
Statistical Quality ControlMahmudul Hasan
 
Statistical process control ppt @ doms
Statistical process control ppt @ doms Statistical process control ppt @ doms
Statistical process control ppt @ doms Babasab Patil
 
Six Sigma Principle and Methods
Six Sigma Principle and MethodsSix Sigma Principle and Methods
Six Sigma Principle and MethodsAshwinDigarse
 
Statistical process control
Statistical process controlStatistical process control
Statistical process controlANOOPA NARAYANAN
 

What's hot (20)

Statistical Quality Control
Statistical Quality ControlStatistical Quality Control
Statistical Quality Control
 
Statistical process control (spc)
Statistical process control (spc)Statistical process control (spc)
Statistical process control (spc)
 
Statistical Process Control
Statistical Process ControlStatistical Process Control
Statistical Process Control
 
Introduction To Statistical Process Control
Introduction To Statistical Process ControlIntroduction To Statistical Process Control
Introduction To Statistical Process Control
 
Introduction to control charts
Introduction to control chartsIntroduction to control charts
Introduction to control charts
 
Statistical Process control
Statistical Process controlStatistical Process control
Statistical Process control
 
Control chart for variables
Control chart for variablesControl chart for variables
Control chart for variables
 
Control charts (p np c u)
Control charts (p np c u)Control charts (p np c u)
Control charts (p np c u)
 
Basics of Process Capability
Basics of Process CapabilityBasics of Process Capability
Basics of Process Capability
 
Statistical Process Control,Control Chart and Process Capability
Statistical Process Control,Control Chart and Process CapabilityStatistical Process Control,Control Chart and Process Capability
Statistical Process Control,Control Chart and Process Capability
 
Control charts
Control chartsControl charts
Control charts
 
Quality control and inspection
Quality control and inspectionQuality control and inspection
Quality control and inspection
 
Control charts
Control chartsControl charts
Control charts
 
Statistical process control (spc)
Statistical process control (spc)Statistical process control (spc)
Statistical process control (spc)
 
Quality control
Quality controlQuality control
Quality control
 
Statistical Quality Control
Statistical Quality ControlStatistical Quality Control
Statistical Quality Control
 
Statistical process control ppt @ doms
Statistical process control ppt @ doms Statistical process control ppt @ doms
Statistical process control ppt @ doms
 
Six Sigma Principle and Methods
Six Sigma Principle and MethodsSix Sigma Principle and Methods
Six Sigma Principle and Methods
 
Statistical process control
Statistical process controlStatistical process control
Statistical process control
 
Acceptance sampling
Acceptance samplingAcceptance sampling
Acceptance sampling
 

Similar to Control charts

STATISTICAL PHARMACEUTICAL QUALITY CONTROL
STATISTICAL  PHARMACEUTICAL QUALITY CONTROLSTATISTICAL  PHARMACEUTICAL QUALITY CONTROL
STATISTICAL PHARMACEUTICAL QUALITY CONTROLHasnat Tariq
 
STATISTICAL PROCESS CONTROL(PPT).pptx
STATISTICAL PROCESS CONTROL(PPT).pptxSTATISTICAL PROCESS CONTROL(PPT).pptx
STATISTICAL PROCESS CONTROL(PPT).pptxmayankdubey99
 
lecture 5 SPC Charta.pptx
lecture 5 SPC Charta.pptxlecture 5 SPC Charta.pptx
lecture 5 SPC Charta.pptxssuser378d7c
 
Statistical process control
Statistical process controlStatistical process control
Statistical process controljsembiring
 
Control Chart Basics.ppt
Control Chart Basics.pptControl Chart Basics.ppt
Control Chart Basics.pptVishnuCRajan1
 
Control Chart Basics.ppt
Control Chart Basics.pptControl Chart Basics.ppt
Control Chart Basics.pptSulavGiri3
 
Understanding SPC Charts for Quality Control.pdf
Understanding SPC Charts for Quality Control.pdfUnderstanding SPC Charts for Quality Control.pdf
Understanding SPC Charts for Quality Control.pdfjawadullah25
 
A-guide-to-creating-and-interpreting-run-and-control-charts
A-guide-to-creating-and-interpreting-run-and-control-chartsA-guide-to-creating-and-interpreting-run-and-control-charts
A-guide-to-creating-and-interpreting-run-and-control-chartsRohitLakhotia12
 
Call center quality management
Call center quality managementCall center quality management
Call center quality managementselinasimpson2601
 
Statistical process control
Statistical process control Statistical process control
Statistical process control Hardil Shah
 
Quality management presentation
Quality management presentationQuality management presentation
Quality management presentationselinasimpson1501
 
Quality management organization
Quality management organizationQuality management organization
Quality management organizationselinasimpson2601
 
Quality management system course
Quality management system courseQuality management system course
Quality management system courseselinasimpson2101
 
Six sigma control charts
Six sigma control chartsSix sigma control charts
Six sigma control chartsprabumech08
 
4 26 2013 1 IME 674 Quality Assurance Reliability EXAM TERM PROJECT INFO...
4 26 2013 1 IME 674  Quality Assurance   Reliability EXAM   TERM PROJECT INFO...4 26 2013 1 IME 674  Quality Assurance   Reliability EXAM   TERM PROJECT INFO...
4 26 2013 1 IME 674 Quality Assurance Reliability EXAM TERM PROJECT INFO...Robin Beregovska
 

Similar to Control charts (20)

STATISTICAL PHARMACEUTICAL QUALITY CONTROL
STATISTICAL  PHARMACEUTICAL QUALITY CONTROLSTATISTICAL  PHARMACEUTICAL QUALITY CONTROL
STATISTICAL PHARMACEUTICAL QUALITY CONTROL
 
STATISTICAL PROCESS CONTROL(PPT).pptx
STATISTICAL PROCESS CONTROL(PPT).pptxSTATISTICAL PROCESS CONTROL(PPT).pptx
STATISTICAL PROCESS CONTROL(PPT).pptx
 
7 QC - NEW.ppt
7 QC - NEW.ppt7 QC - NEW.ppt
7 QC - NEW.ppt
 
lecture 5 SPC Charta.pptx
lecture 5 SPC Charta.pptxlecture 5 SPC Charta.pptx
lecture 5 SPC Charta.pptx
 
Statistical process control
Statistical process controlStatistical process control
Statistical process control
 
Control Chart Basics.ppt
Control Chart Basics.pptControl Chart Basics.ppt
Control Chart Basics.ppt
 
Control Chart Basics.ppt
Control Chart Basics.pptControl Chart Basics.ppt
Control Chart Basics.ppt
 
TQM UNIT 3.ppt
TQM UNIT 3.pptTQM UNIT 3.ppt
TQM UNIT 3.ppt
 
Understanding SPC Charts for Quality Control.pdf
Understanding SPC Charts for Quality Control.pdfUnderstanding SPC Charts for Quality Control.pdf
Understanding SPC Charts for Quality Control.pdf
 
A-guide-to-creating-and-interpreting-run-and-control-charts
A-guide-to-creating-and-interpreting-run-and-control-chartsA-guide-to-creating-and-interpreting-run-and-control-charts
A-guide-to-creating-and-interpreting-run-and-control-charts
 
Quality management syllabus
Quality management syllabusQuality management syllabus
Quality management syllabus
 
Call center quality management
Call center quality managementCall center quality management
Call center quality management
 
Statistical process control
Statistical process control Statistical process control
Statistical process control
 
Quality management presentation
Quality management presentationQuality management presentation
Quality management presentation
 
Quality management organization
Quality management organizationQuality management organization
Quality management organization
 
Quality management system course
Quality management system courseQuality management system course
Quality management system course
 
Six sigma control charts
Six sigma control chartsSix sigma control charts
Six sigma control charts
 
4 26 2013 1 IME 674 Quality Assurance Reliability EXAM TERM PROJECT INFO...
4 26 2013 1 IME 674  Quality Assurance   Reliability EXAM   TERM PROJECT INFO...4 26 2013 1 IME 674  Quality Assurance   Reliability EXAM   TERM PROJECT INFO...
4 26 2013 1 IME 674 Quality Assurance Reliability EXAM TERM PROJECT INFO...
 
Qc tools
Qc toolsQc tools
Qc tools
 
Qc tools
Qc toolsQc tools
Qc tools
 

Recently uploaded

Decoding Kotlin - Your guide to solving the mysterious in Kotlin.pptx
Decoding Kotlin - Your guide to solving the mysterious in Kotlin.pptxDecoding Kotlin - Your guide to solving the mysterious in Kotlin.pptx
Decoding Kotlin - Your guide to solving the mysterious in Kotlin.pptxJoão Esperancinha
 
IVE Industry Focused Event - Defence Sector 2024
IVE Industry Focused Event - Defence Sector 2024IVE Industry Focused Event - Defence Sector 2024
IVE Industry Focused Event - Defence Sector 2024Mark Billinghurst
 
Work Experience-Dalton Park.pptxfvvvvvvv
Work Experience-Dalton Park.pptxfvvvvvvvWork Experience-Dalton Park.pptxfvvvvvvv
Work Experience-Dalton Park.pptxfvvvvvvvLewisJB
 
DATA ANALYTICS PPT definition usage example
DATA ANALYTICS PPT definition usage exampleDATA ANALYTICS PPT definition usage example
DATA ANALYTICS PPT definition usage examplePragyanshuParadkar1
 
Arduino_CSE ece ppt for working and principal of arduino.ppt
Arduino_CSE ece ppt for working and principal of arduino.pptArduino_CSE ece ppt for working and principal of arduino.ppt
Arduino_CSE ece ppt for working and principal of arduino.pptSAURABHKUMAR892774
 
main PPT.pptx of girls hostel security using rfid
main PPT.pptx of girls hostel security using rfidmain PPT.pptx of girls hostel security using rfid
main PPT.pptx of girls hostel security using rfidNikhilNagaraju
 
Effects of rheological properties on mixing
Effects of rheological properties on mixingEffects of rheological properties on mixing
Effects of rheological properties on mixingviprabot1
 
Introduction to Machine Learning Unit-3 for II MECH
Introduction to Machine Learning Unit-3 for II MECHIntroduction to Machine Learning Unit-3 for II MECH
Introduction to Machine Learning Unit-3 for II MECHC Sai Kiran
 
An experimental study in using natural admixture as an alternative for chemic...
An experimental study in using natural admixture as an alternative for chemic...An experimental study in using natural admixture as an alternative for chemic...
An experimental study in using natural admixture as an alternative for chemic...Chandu841456
 
Artificial-Intelligence-in-Electronics (K).pptx
Artificial-Intelligence-in-Electronics (K).pptxArtificial-Intelligence-in-Electronics (K).pptx
Artificial-Intelligence-in-Electronics (K).pptxbritheesh05
 
complete construction, environmental and economics information of biomass com...
complete construction, environmental and economics information of biomass com...complete construction, environmental and economics information of biomass com...
complete construction, environmental and economics information of biomass com...asadnawaz62
 
Biology for Computer Engineers Course Handout.pptx
Biology for Computer Engineers Course Handout.pptxBiology for Computer Engineers Course Handout.pptx
Biology for Computer Engineers Course Handout.pptxDeepakSakkari2
 
VICTOR MAESTRE RAMIREZ - Planetary Defender on NASA's Double Asteroid Redirec...
VICTOR MAESTRE RAMIREZ - Planetary Defender on NASA's Double Asteroid Redirec...VICTOR MAESTRE RAMIREZ - Planetary Defender on NASA's Double Asteroid Redirec...
VICTOR MAESTRE RAMIREZ - Planetary Defender on NASA's Double Asteroid Redirec...VICTOR MAESTRE RAMIREZ
 
Call Us ≽ 8377877756 ≼ Call Girls In Shastri Nagar (Delhi)
Call Us ≽ 8377877756 ≼ Call Girls In Shastri Nagar (Delhi)Call Us ≽ 8377877756 ≼ Call Girls In Shastri Nagar (Delhi)
Call Us ≽ 8377877756 ≼ Call Girls In Shastri Nagar (Delhi)dollysharma2066
 
EduAI - E learning Platform integrated with AI
EduAI - E learning Platform integrated with AIEduAI - E learning Platform integrated with AI
EduAI - E learning Platform integrated with AIkoyaldeepu123
 
CCS355 Neural Network & Deep Learning UNIT III notes and Question bank .pdf
CCS355 Neural Network & Deep Learning UNIT III notes and Question bank .pdfCCS355 Neural Network & Deep Learning UNIT III notes and Question bank .pdf
CCS355 Neural Network & Deep Learning UNIT III notes and Question bank .pdfAsst.prof M.Gokilavani
 
GDSC ASEB Gen AI study jams presentation
GDSC ASEB Gen AI study jams presentationGDSC ASEB Gen AI study jams presentation
GDSC ASEB Gen AI study jams presentationGDSCAESB
 

Recently uploaded (20)

Decoding Kotlin - Your guide to solving the mysterious in Kotlin.pptx
Decoding Kotlin - Your guide to solving the mysterious in Kotlin.pptxDecoding Kotlin - Your guide to solving the mysterious in Kotlin.pptx
Decoding Kotlin - Your guide to solving the mysterious in Kotlin.pptx
 
IVE Industry Focused Event - Defence Sector 2024
IVE Industry Focused Event - Defence Sector 2024IVE Industry Focused Event - Defence Sector 2024
IVE Industry Focused Event - Defence Sector 2024
 
9953056974 Call Girls In South Ex, Escorts (Delhi) NCR.pdf
9953056974 Call Girls In South Ex, Escorts (Delhi) NCR.pdf9953056974 Call Girls In South Ex, Escorts (Delhi) NCR.pdf
9953056974 Call Girls In South Ex, Escorts (Delhi) NCR.pdf
 
Work Experience-Dalton Park.pptxfvvvvvvv
Work Experience-Dalton Park.pptxfvvvvvvvWork Experience-Dalton Park.pptxfvvvvvvv
Work Experience-Dalton Park.pptxfvvvvvvv
 
DATA ANALYTICS PPT definition usage example
DATA ANALYTICS PPT definition usage exampleDATA ANALYTICS PPT definition usage example
DATA ANALYTICS PPT definition usage example
 
Arduino_CSE ece ppt for working and principal of arduino.ppt
Arduino_CSE ece ppt for working and principal of arduino.pptArduino_CSE ece ppt for working and principal of arduino.ppt
Arduino_CSE ece ppt for working and principal of arduino.ppt
 
main PPT.pptx of girls hostel security using rfid
main PPT.pptx of girls hostel security using rfidmain PPT.pptx of girls hostel security using rfid
main PPT.pptx of girls hostel security using rfid
 
Effects of rheological properties on mixing
Effects of rheological properties on mixingEffects of rheological properties on mixing
Effects of rheological properties on mixing
 
Introduction to Machine Learning Unit-3 for II MECH
Introduction to Machine Learning Unit-3 for II MECHIntroduction to Machine Learning Unit-3 for II MECH
Introduction to Machine Learning Unit-3 for II MECH
 
An experimental study in using natural admixture as an alternative for chemic...
An experimental study in using natural admixture as an alternative for chemic...An experimental study in using natural admixture as an alternative for chemic...
An experimental study in using natural admixture as an alternative for chemic...
 
Artificial-Intelligence-in-Electronics (K).pptx
Artificial-Intelligence-in-Electronics (K).pptxArtificial-Intelligence-in-Electronics (K).pptx
Artificial-Intelligence-in-Electronics (K).pptx
 
complete construction, environmental and economics information of biomass com...
complete construction, environmental and economics information of biomass com...complete construction, environmental and economics information of biomass com...
complete construction, environmental and economics information of biomass com...
 
young call girls in Green Park🔝 9953056974 🔝 escort Service
young call girls in Green Park🔝 9953056974 🔝 escort Serviceyoung call girls in Green Park🔝 9953056974 🔝 escort Service
young call girls in Green Park🔝 9953056974 🔝 escort Service
 
Biology for Computer Engineers Course Handout.pptx
Biology for Computer Engineers Course Handout.pptxBiology for Computer Engineers Course Handout.pptx
Biology for Computer Engineers Course Handout.pptx
 
VICTOR MAESTRE RAMIREZ - Planetary Defender on NASA's Double Asteroid Redirec...
VICTOR MAESTRE RAMIREZ - Planetary Defender on NASA's Double Asteroid Redirec...VICTOR MAESTRE RAMIREZ - Planetary Defender on NASA's Double Asteroid Redirec...
VICTOR MAESTRE RAMIREZ - Planetary Defender on NASA's Double Asteroid Redirec...
 
Call Us ≽ 8377877756 ≼ Call Girls In Shastri Nagar (Delhi)
Call Us ≽ 8377877756 ≼ Call Girls In Shastri Nagar (Delhi)Call Us ≽ 8377877756 ≼ Call Girls In Shastri Nagar (Delhi)
Call Us ≽ 8377877756 ≼ Call Girls In Shastri Nagar (Delhi)
 
EduAI - E learning Platform integrated with AI
EduAI - E learning Platform integrated with AIEduAI - E learning Platform integrated with AI
EduAI - E learning Platform integrated with AI
 
CCS355 Neural Network & Deep Learning UNIT III notes and Question bank .pdf
CCS355 Neural Network & Deep Learning UNIT III notes and Question bank .pdfCCS355 Neural Network & Deep Learning UNIT III notes and Question bank .pdf
CCS355 Neural Network & Deep Learning UNIT III notes and Question bank .pdf
 
Call Us -/9953056974- Call Girls In Vikaspuri-/- Delhi NCR
Call Us -/9953056974- Call Girls In Vikaspuri-/- Delhi NCRCall Us -/9953056974- Call Girls In Vikaspuri-/- Delhi NCR
Call Us -/9953056974- Call Girls In Vikaspuri-/- Delhi NCR
 
GDSC ASEB Gen AI study jams presentation
GDSC ASEB Gen AI study jams presentationGDSC ASEB Gen AI study jams presentation
GDSC ASEB Gen AI study jams presentation
 

Control charts

  • 2. GE6757- Total Quality Management Control Charts Prepared By, V.Sutha Jebakumari, AP/CSE L.Shanmuga Priya, AP/CSE, Kamaraj College of Engineering & Technology, Virudhunagar.
  • 3. Control Charts • Walter Shewhart first utilized control charts in 1924 to aid the world of manufacturing. Control charts have two general uses in an improvement project. • The most common application is as a tool to monitor process stability and control.
  • 4. Control Charts • “No matter how well the process is designed, there exists a certain amount of nature variability in output measurements.“ • A control chart tells us how much variation the process causes. • A stable process produces predictable results consistently. An example of a control chart that shows an unstable process means variables affected must be analyzed and controlled before the improvement process can begin.
  • 5. Types of control charts • There are two types of control charts; those that analyze attributes and those that look at variables in a process or project. Examples of a control chart include: • X-Bar & R Control Charts • X-Bar & S Control Charts • U Charts • P Control Charts • C Control Charts
  • 6. Examples of Control Charts • U Charts – These variable types of control charts utilize an upper and lower range. Elements falling in the upper range need attention and analysis in order for the problem to be corrected. • X-Bar & R Charts – These variable charts utilize the X-Bar or the Mean to determine subgroups. The R or Range plots the subgroups based on upper and lower control limits. X-Bar & R Charts are the most widely utilized charts in project management, however, are only successful if 5 or less subgroups are analyzed. • X-Bar & S Charts – Using this example of a variable control chart is effective for 5 or more subgroups and the S or Standard Deviations are considered in both upper and lower control limits based on the X-Bar or Mean. • p Control Charts – This attribute-type chart is effective when elements are not equal. A p Control Chart might be used to determine how many accidents occur each day at a chosen intersection. • c Control Charts – Another attribute-type control chart, the c Control Chart explores elements that are nonconforming. A c Control Chart might be used to explore mass-production of one similar product where the elements per unit do not conform to the norm.
  • 7. Two causes of fluctuation • Most examples of a control chart considers two causes of fluctuation, common causes and special causes.
  • 8. Three categories of variation 1. Within piecewise variation(eg. Roughness of a piece) 2. Piece to piece variation (light intensity of four bulbs produced from a machine will be different) 3. Time to time variation (difference in product produced at different times of the day)
  • 9. Second categories of variation Variation is due to a combination of 1.Equipment 2.Materials 3.Environment 4.Operator
  • 10. 1. Equipment • Source includes tool wear, machine vibrations and electrical fluctuations. • Even identical machines will have different capabilities. • It becomes crucial when scheduling the manufacture of critical parts.
  • 11. 2. Material • Because variation occurs in the finished product, it must also occur in the raw material. • Quality characteristics as tensile strength, ductility, thickness, porosity and moisture content can be expected to contribute to the overall variation in the final product.
  • 12. 3. Environment • Temperature, light, radiation, particle size, pressure and humidity all can contribute to variation in the product. • Experiments are conducted in outer space to learn more about the effect of the environment on product variation.
  • 13. 4. Operator • The source of variation includes the method by which the operator performs the operation. • The operator’s physical and emotional well- being contribute to the variation. • A cut finger, a personal problem or a headache can make an operator’s quality performance vary.
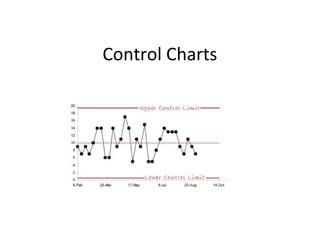
  • 14. Elements of a Control Chart • A control chart begins with a time series graph. • A central line (X) is added as a visual reference for detecting shifts or trends – this is also referred to as the process location. • Upper and lower control limits (UCL and LCL) are computed from available data and placed equidistant from the central line. This is also referred to as process dispersion. •
  • 15.
  • 16. • Control limits (CLs) ensure time is not wasted looking for unnecessary trouble – the goal of any process improvement practitioner should be to only take action when warranted. Control limits are calculated by: • Estimating the standard deviation, σ, of the sample data • Multiplying that number by three • Adding (3 x σ to the average) for the UCL and subtracting (3 x σ from the average) for the LCL • Mathematically, the calculation of control limits looks like: •
  • 17. Run Charts • Monitor the performance of one or more processes over time to detect trends, shifts or cycles. • Allow us to compare a performance measure before and after implementation of a solution to measure its impact. • Focuses attention on truly vital changes in the process. • Assess whether improved performance has been sustained.
  • 18. How to Create a Run Chart There are seven steps to creating a run chart. • Decide on the measure to be analyzed (assuming there is a reliable measurement system in place). • Gather the data – have a minimum of 10 data points. • Draw a graph with a vertical line and a horizontal line. • On the vertical line, or the y-axis, draw the scale relative to the variable you are measuring. • On the horizontal line, or the x-axis, draw the time or sequence scale. • Calculate the mean/median (whichever the data set indicates to be appropriate) and draw a horizontal line at that value – going across the graph. • Plot the data in the sequence, or the time order, in which the data was collected.
  • 19. Characteristics of a run chart • On the X axis you have data in some sort of chronological order e.g. Jan, Feb, Mar • On the Y axis you have the measure of interest e.g. %, count • Once the data points are connected you put a centre line (CL) between the graph. For a run chart the CL is called the Median.
  • 20. Interpreting a run chart • There are four rules that can be used to interpret a run chart. Non-random variation can be recognized by looking for: • Rule 1 – Shift Six or more consecutive points either all above or all below the centre line (CL). Values that fall on the CL do not add to nor break a shift. Skip values that fall on the median and continue counting.
  • 21. Rule 1 – Shift
  • 22. Rule 2 – Trend • Five or more consecutive points all going up or all going down. If the value of two or more successive points is the same (repeats), ignore the like points when counting.
  • 23. Rule 2 – Trend
  • 24. Rule 3 – Too many or too few runs • A non-random pattern is signalled by too few or too many runs, or crossings of the median line. If there are too many or too few runs, this is a sign of non-random variation. An easy way to count the number of runs is to count the number of times the line connecting all the data points crosses the median and add one. If the number of runs you have are: • Within the range outlined in the table, then you have a random pattern. • Outside the range outline in the table, then you have a non-random pattern or signal of change.
  • 25. Too many or too few runs
  • 26. Rule 4 – An astronomical data point • This is a data point that is clearly different from all others. Different people looking at the same graph would be expected to recognize the same data point as astronomical.
  • 27. Rule 4 – An astronomical data point
  • 28. Rule 4 – An astronomical data point By applying each of the four rules, you can evaluate the run chart for a signal for change (through a non- random variation). However, it is not necessary to find evidence of change with each of the four rules to determine that a change has occurred. Any single rule occurring is sufficient evidence of a non-random signal of change.
  • 29. Benefits of Run Charts The following are a few benefits of a run chart: • Easy to draft. • Easy to analyze and interpret. • Does not require much technical skill. • Straightforward representation of data.