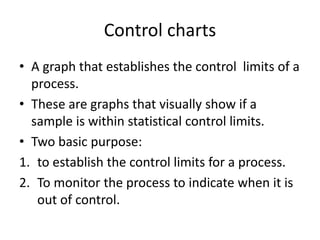
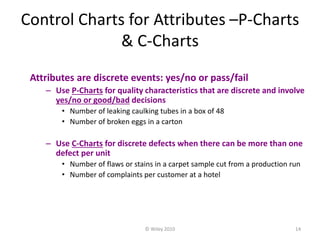
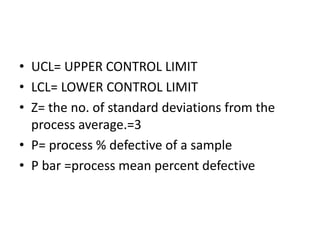
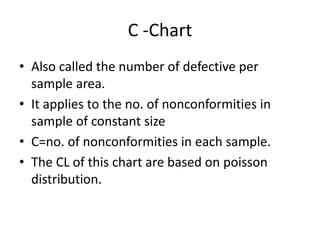
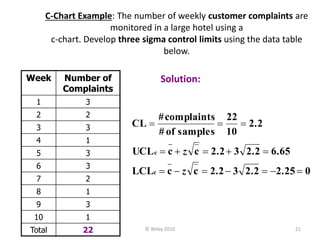
P-CHART & C-CHART
GROUP NO:B5
GROUP MEMBERS:
PRIYANKA K
NITHU K S
RANJITH
SARATH V
VISHNU DAS
STATISTICAL PROCESS CONTROL
• It involves monitoring the production process
to detect and prevent poor quality.
• It is a statistical procedure using control
charts to see if any part of a production
process is not functioning properly and could
cause poor quality.
• It is a tool for identifying problems in order to
make improvement.
QUALITY MEASURES
• ATTRIBUTE OF THE PRODUCT
• VARIABLE MEASURES
• ATTRIBUTE: An attribute is a product
characteristics such as colour , surface
texture,cleanlines, smell and taste.
• Attribute can be evaluated quickly with a
discrete response such as good or bad.
• If quality specification are complex and
extensive , a simple attribute test might be
used to determine whether or not a product
or service is defective.
• Variable measures:
A product characteristics that is
continuous and can be measured.
Spc applied to
• Hospitals
• Grocery store
• Airlines
• Fast food restuarant
Control charts
• A graph that establishes the control limits of a
process.
• These are graphs that visually show if a
sample is within statistical control limits.
• Two basic purpose:
1. to establish the control limits for a process.
2. To monitor the process to indicate when it is
out of control.
Statistical control charts
• It is one of graph to monitor a production
process.
• Samples are taken from the process periodically ,
and observation are plotted on the graph .
• If any observation is outside the upperlimit or
lower limit on the graph, it indicate that
something is wrong in the process.
• ie, it is not in control which may cause defective
or poor quality items.
Where control charts used?
• Control charts are used at critical points in the
process where historically the process has
shown a tendency to go out of control .
• At points where if the process goes out of
control it is particularly harmful and costly.
• It is frequently used at the beginning of a
process to check the quality of raw materials
and delivers for a service operation.
• Used before a costly or irreversible point in
process
• After which the product is difficult to rework
• Before or after assembly or painting
operations that might cover defects.
• Before the outgoing final product or service is
shipped or delivered
Types of the control charts
• Variables control charts
– Variable data are measured on a continuous scale. For example: time,
weight, distance or temperature can be measured in fractions or
decimals.
– Applied to data with continuous distribution
Eg: X chart and R chart
• Attributes control charts
– Attribute data are counted and cannot have fractions or decimals.
Attribute data arise when you are determining only the presence or
absence of something: success or failure, accept or reject, correct or
not correct. For example, a report can have four errors or five errors,
but it cannot have four and a half errors.
– Applied to data following discrete distribution
Eg: P chart and C chart
(http://www.asq.org/learn-about-quality/data-collection-analysis-tools/overview/control-chart.html)
Two types :
• P-chart & C-chart for attributes
• Mean X and range R for variables
P chart
• Also called the percent defective chart
• Uses the proportion of defective items in a
sample as the sample statistic.
• P-chart can be used when it is possible to
distinguish between defective and non
defective items and to state the number of
defectives as a percentage of the whole.
© Wiley 2010 14
Control Charts for Attributes –P-Charts
& C-Charts
Attributes are discrete events: yes/no or pass/fail
– Use P-Charts for quality characteristics that are discrete and involve
yes/no or good/bad decisions
• Number of leaking caulking tubes in a box of 48
• Number of broken eggs in a carton
– Use C-Charts for discrete defects when there can be more than one
defect per unit
• Number of flaws or stains in a carpet sample cut from a production run
• Number of complaints per customer at a hotel
© Wiley 2010 15
P-Chart Example: A production manager for a tire company has inspected
the number of defective tires in five random samples with 20 tires in each
sample. The table below shows the number of defective tires in each
sample of 20 tires. Calculate the control limits.
Sample Number
of
Defective
Tires
Number of
Tires in
each
Sample
Proportion
Defective
1 3 20 .15
2 2 20 .10
3 1 20 .05
4 2 20 .10
5 1 20 .05
Total 9 100 .09
Solution:
 
  0.1023(.064).09σzpLCL
.2823(.064).09σzpUCL
0.064
20
(.09)(.91)
n
)p(1p
σ
.09
100
9
InspectedTotal
Defectives#
pCL
p
p
p






• UCL= UPPER CONTROL LIMIT
• LCL= LOWER CONTROL LIMIT
• Z= the no. of standard deviations from the
process average.=3
• P= process % defective of a sample
• P bar =process mean percent defective
© Wiley 2010 17
P- Control Chart
C -Chart
• Also called the number of defective per
sample area.
• It applies to the no. of nonconformities in
sample of constant size
• C=no. of nonconformities in each sample.
• The CL of this chart are based on poisson
distribution.
Application of c chart
• To control the no. of nonconforming rivets in
an aircraft wing.
• To control the number of imperfection
observed in a galvanized sheet
• To control the no. of defects in final
assemblies(like TV, radio, computer)
© Wiley 2010 21
C-Chart Example: The number of weekly customer complaints are
monitored in a large hotel using a
c-chart. Develop three sigma control limits using the data table
below.
Week Number of
Complaints
1 3
2 2
3 3
4 1
5 3
6 3
7 2
8 1
9 3
10 1
Total 22
Solution:
02.252.232.2ccLCL
6.652.232.2ccUCL
2.2
10
22
samplesof#
complaints#
CL
c
c



z
z
© Wiley 2010 22
C- Control Chart
THANK U

P chart & c-chart

  • 1.
    P-CHART & C-CHART GROUPNO:B5 GROUP MEMBERS: PRIYANKA K NITHU K S RANJITH SARATH V VISHNU DAS
  • 2.
    STATISTICAL PROCESS CONTROL •It involves monitoring the production process to detect and prevent poor quality. • It is a statistical procedure using control charts to see if any part of a production process is not functioning properly and could cause poor quality. • It is a tool for identifying problems in order to make improvement.
  • 3.
    QUALITY MEASURES • ATTRIBUTEOF THE PRODUCT • VARIABLE MEASURES
  • 4.
    • ATTRIBUTE: Anattribute is a product characteristics such as colour , surface texture,cleanlines, smell and taste. • Attribute can be evaluated quickly with a discrete response such as good or bad. • If quality specification are complex and extensive , a simple attribute test might be used to determine whether or not a product or service is defective.
  • 5.
    • Variable measures: Aproduct characteristics that is continuous and can be measured.
  • 6.
    Spc applied to •Hospitals • Grocery store • Airlines • Fast food restuarant
  • 7.
    Control charts • Agraph that establishes the control limits of a process. • These are graphs that visually show if a sample is within statistical control limits. • Two basic purpose: 1. to establish the control limits for a process. 2. To monitor the process to indicate when it is out of control.
  • 8.
    Statistical control charts •It is one of graph to monitor a production process. • Samples are taken from the process periodically , and observation are plotted on the graph . • If any observation is outside the upperlimit or lower limit on the graph, it indicate that something is wrong in the process. • ie, it is not in control which may cause defective or poor quality items.
  • 9.
    Where control chartsused? • Control charts are used at critical points in the process where historically the process has shown a tendency to go out of control . • At points where if the process goes out of control it is particularly harmful and costly. • It is frequently used at the beginning of a process to check the quality of raw materials and delivers for a service operation.
  • 10.
    • Used beforea costly or irreversible point in process • After which the product is difficult to rework • Before or after assembly or painting operations that might cover defects. • Before the outgoing final product or service is shipped or delivered
  • 11.
    Types of thecontrol charts • Variables control charts – Variable data are measured on a continuous scale. For example: time, weight, distance or temperature can be measured in fractions or decimals. – Applied to data with continuous distribution Eg: X chart and R chart • Attributes control charts – Attribute data are counted and cannot have fractions or decimals. Attribute data arise when you are determining only the presence or absence of something: success or failure, accept or reject, correct or not correct. For example, a report can have four errors or five errors, but it cannot have four and a half errors. – Applied to data following discrete distribution Eg: P chart and C chart (http://www.asq.org/learn-about-quality/data-collection-analysis-tools/overview/control-chart.html)
  • 12.
    Two types : •P-chart & C-chart for attributes • Mean X and range R for variables
  • 13.
    P chart • Alsocalled the percent defective chart • Uses the proportion of defective items in a sample as the sample statistic. • P-chart can be used when it is possible to distinguish between defective and non defective items and to state the number of defectives as a percentage of the whole.
  • 14.
    © Wiley 201014 Control Charts for Attributes –P-Charts & C-Charts Attributes are discrete events: yes/no or pass/fail – Use P-Charts for quality characteristics that are discrete and involve yes/no or good/bad decisions • Number of leaking caulking tubes in a box of 48 • Number of broken eggs in a carton – Use C-Charts for discrete defects when there can be more than one defect per unit • Number of flaws or stains in a carpet sample cut from a production run • Number of complaints per customer at a hotel
  • 15.
    © Wiley 201015 P-Chart Example: A production manager for a tire company has inspected the number of defective tires in five random samples with 20 tires in each sample. The table below shows the number of defective tires in each sample of 20 tires. Calculate the control limits. Sample Number of Defective Tires Number of Tires in each Sample Proportion Defective 1 3 20 .15 2 2 20 .10 3 1 20 .05 4 2 20 .10 5 1 20 .05 Total 9 100 .09 Solution:     0.1023(.064).09σzpLCL .2823(.064).09σzpUCL 0.064 20 (.09)(.91) n )p(1p σ .09 100 9 InspectedTotal Defectives# pCL p p p      
  • 16.
    • UCL= UPPERCONTROL LIMIT • LCL= LOWER CONTROL LIMIT • Z= the no. of standard deviations from the process average.=3 • P= process % defective of a sample • P bar =process mean percent defective
  • 17.
    © Wiley 201017 P- Control Chart
  • 19.
    C -Chart • Alsocalled the number of defective per sample area. • It applies to the no. of nonconformities in sample of constant size • C=no. of nonconformities in each sample. • The CL of this chart are based on poisson distribution.
  • 20.
    Application of cchart • To control the no. of nonconforming rivets in an aircraft wing. • To control the number of imperfection observed in a galvanized sheet • To control the no. of defects in final assemblies(like TV, radio, computer)
  • 21.
    © Wiley 201021 C-Chart Example: The number of weekly customer complaints are monitored in a large hotel using a c-chart. Develop three sigma control limits using the data table below. Week Number of Complaints 1 3 2 2 3 3 4 1 5 3 6 3 7 2 8 1 9 3 10 1 Total 22 Solution: 02.252.232.2ccLCL 6.652.232.2ccUCL 2.2 10 22 samplesof# complaints# CL c c    z z
  • 22.
    © Wiley 201022 C- Control Chart
  • 23.