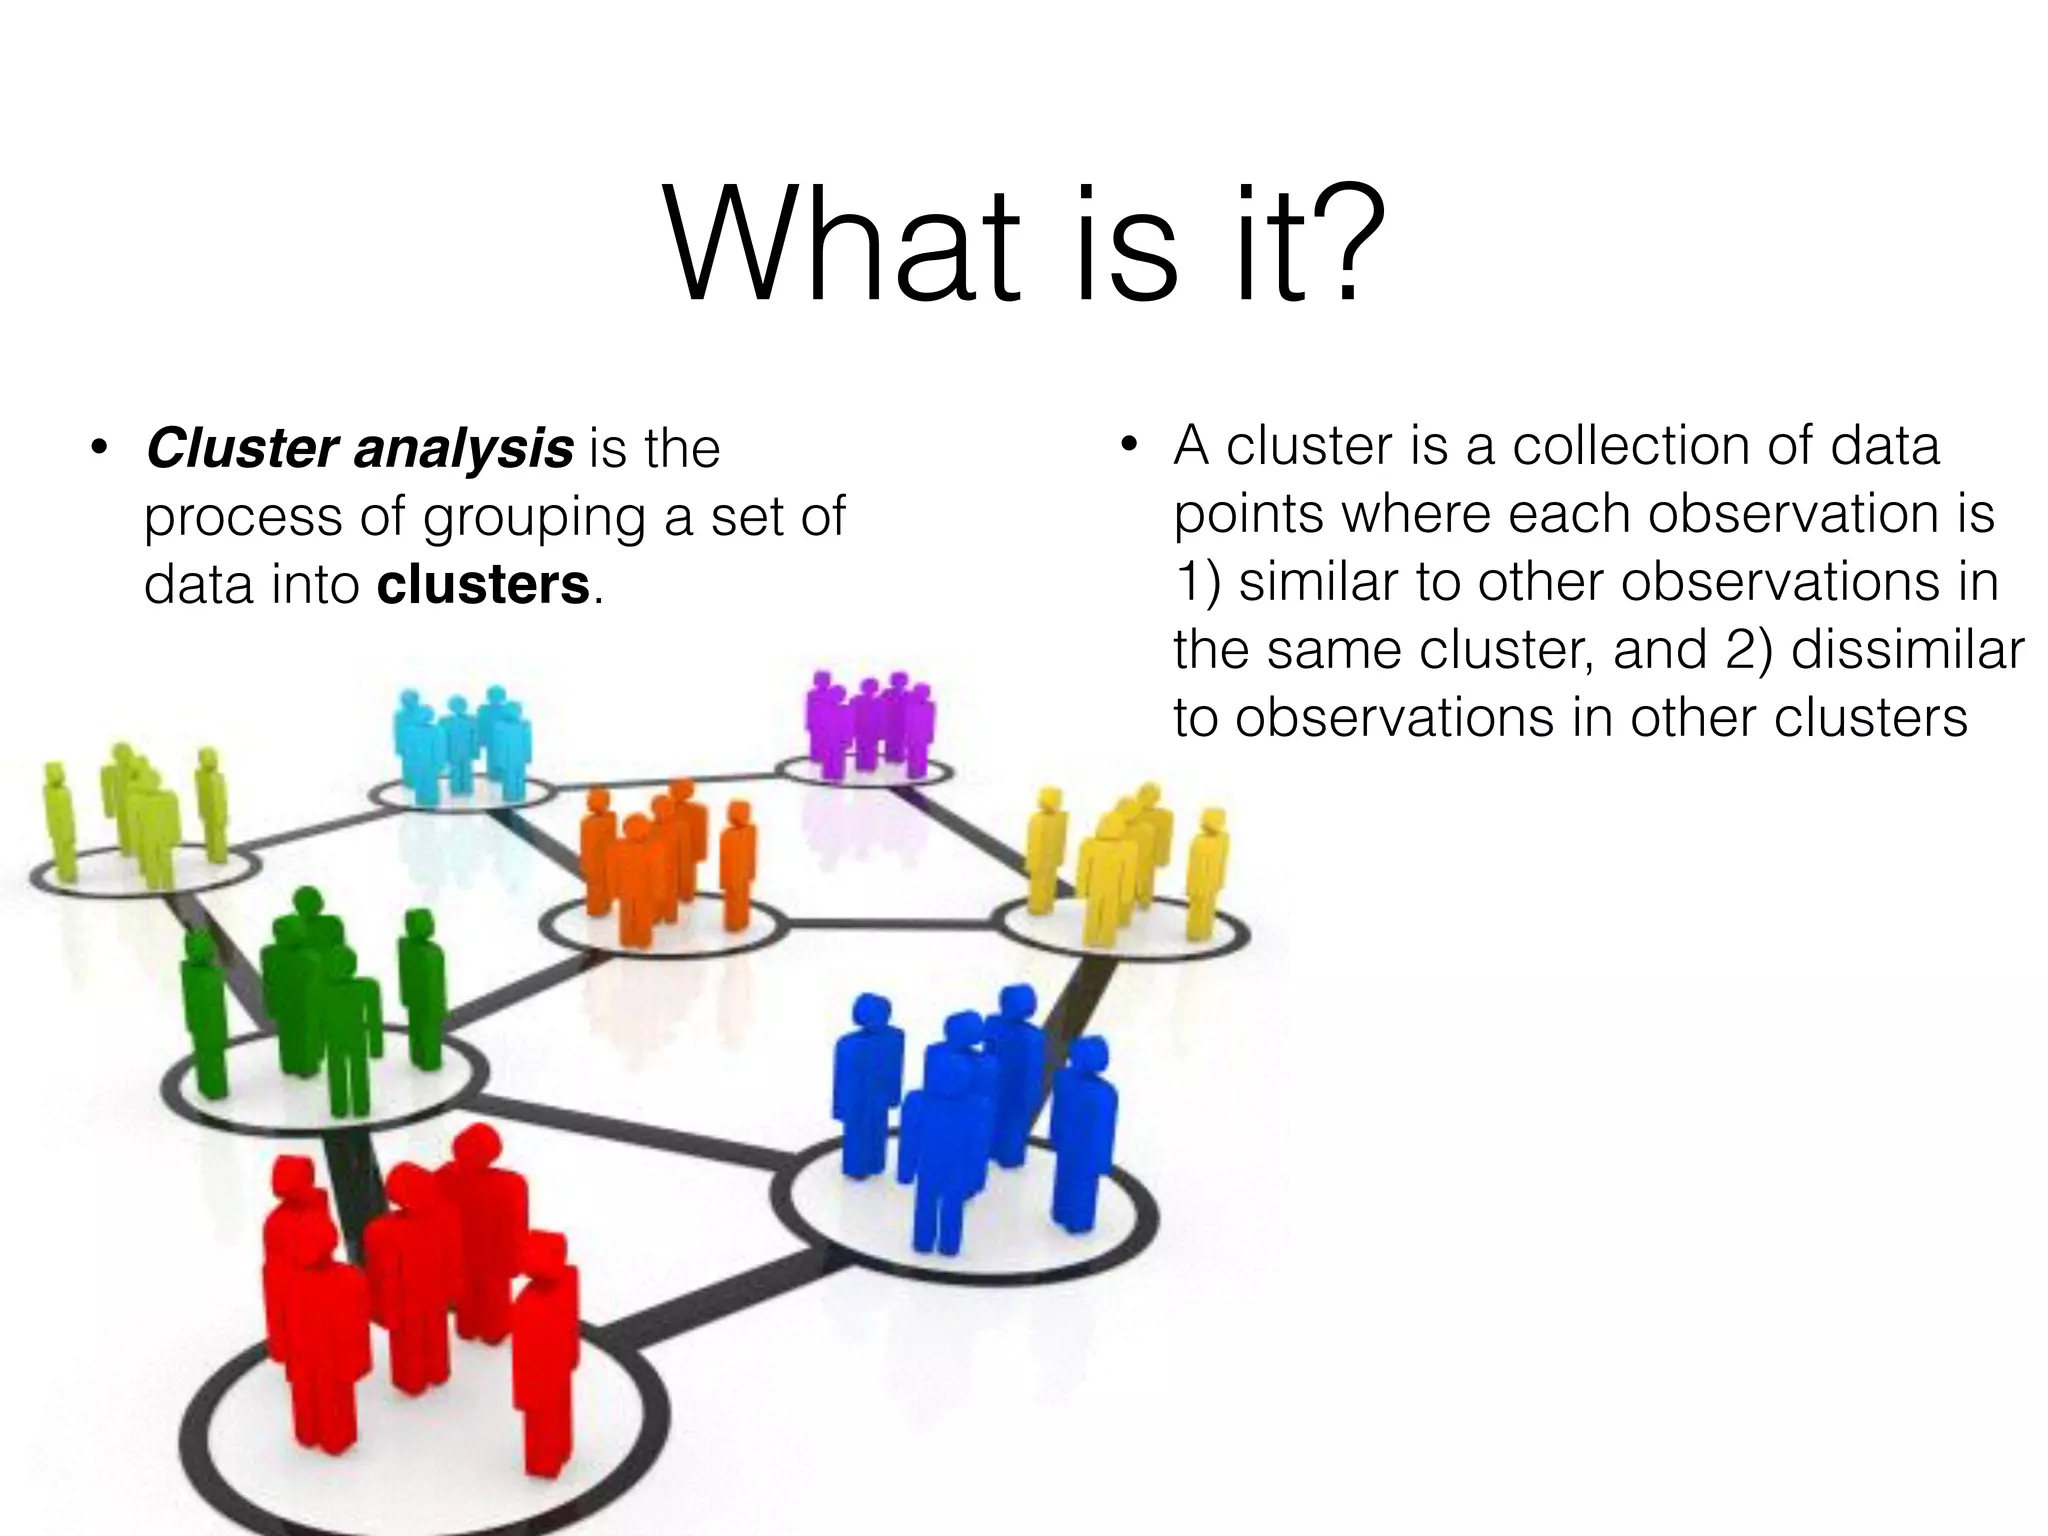
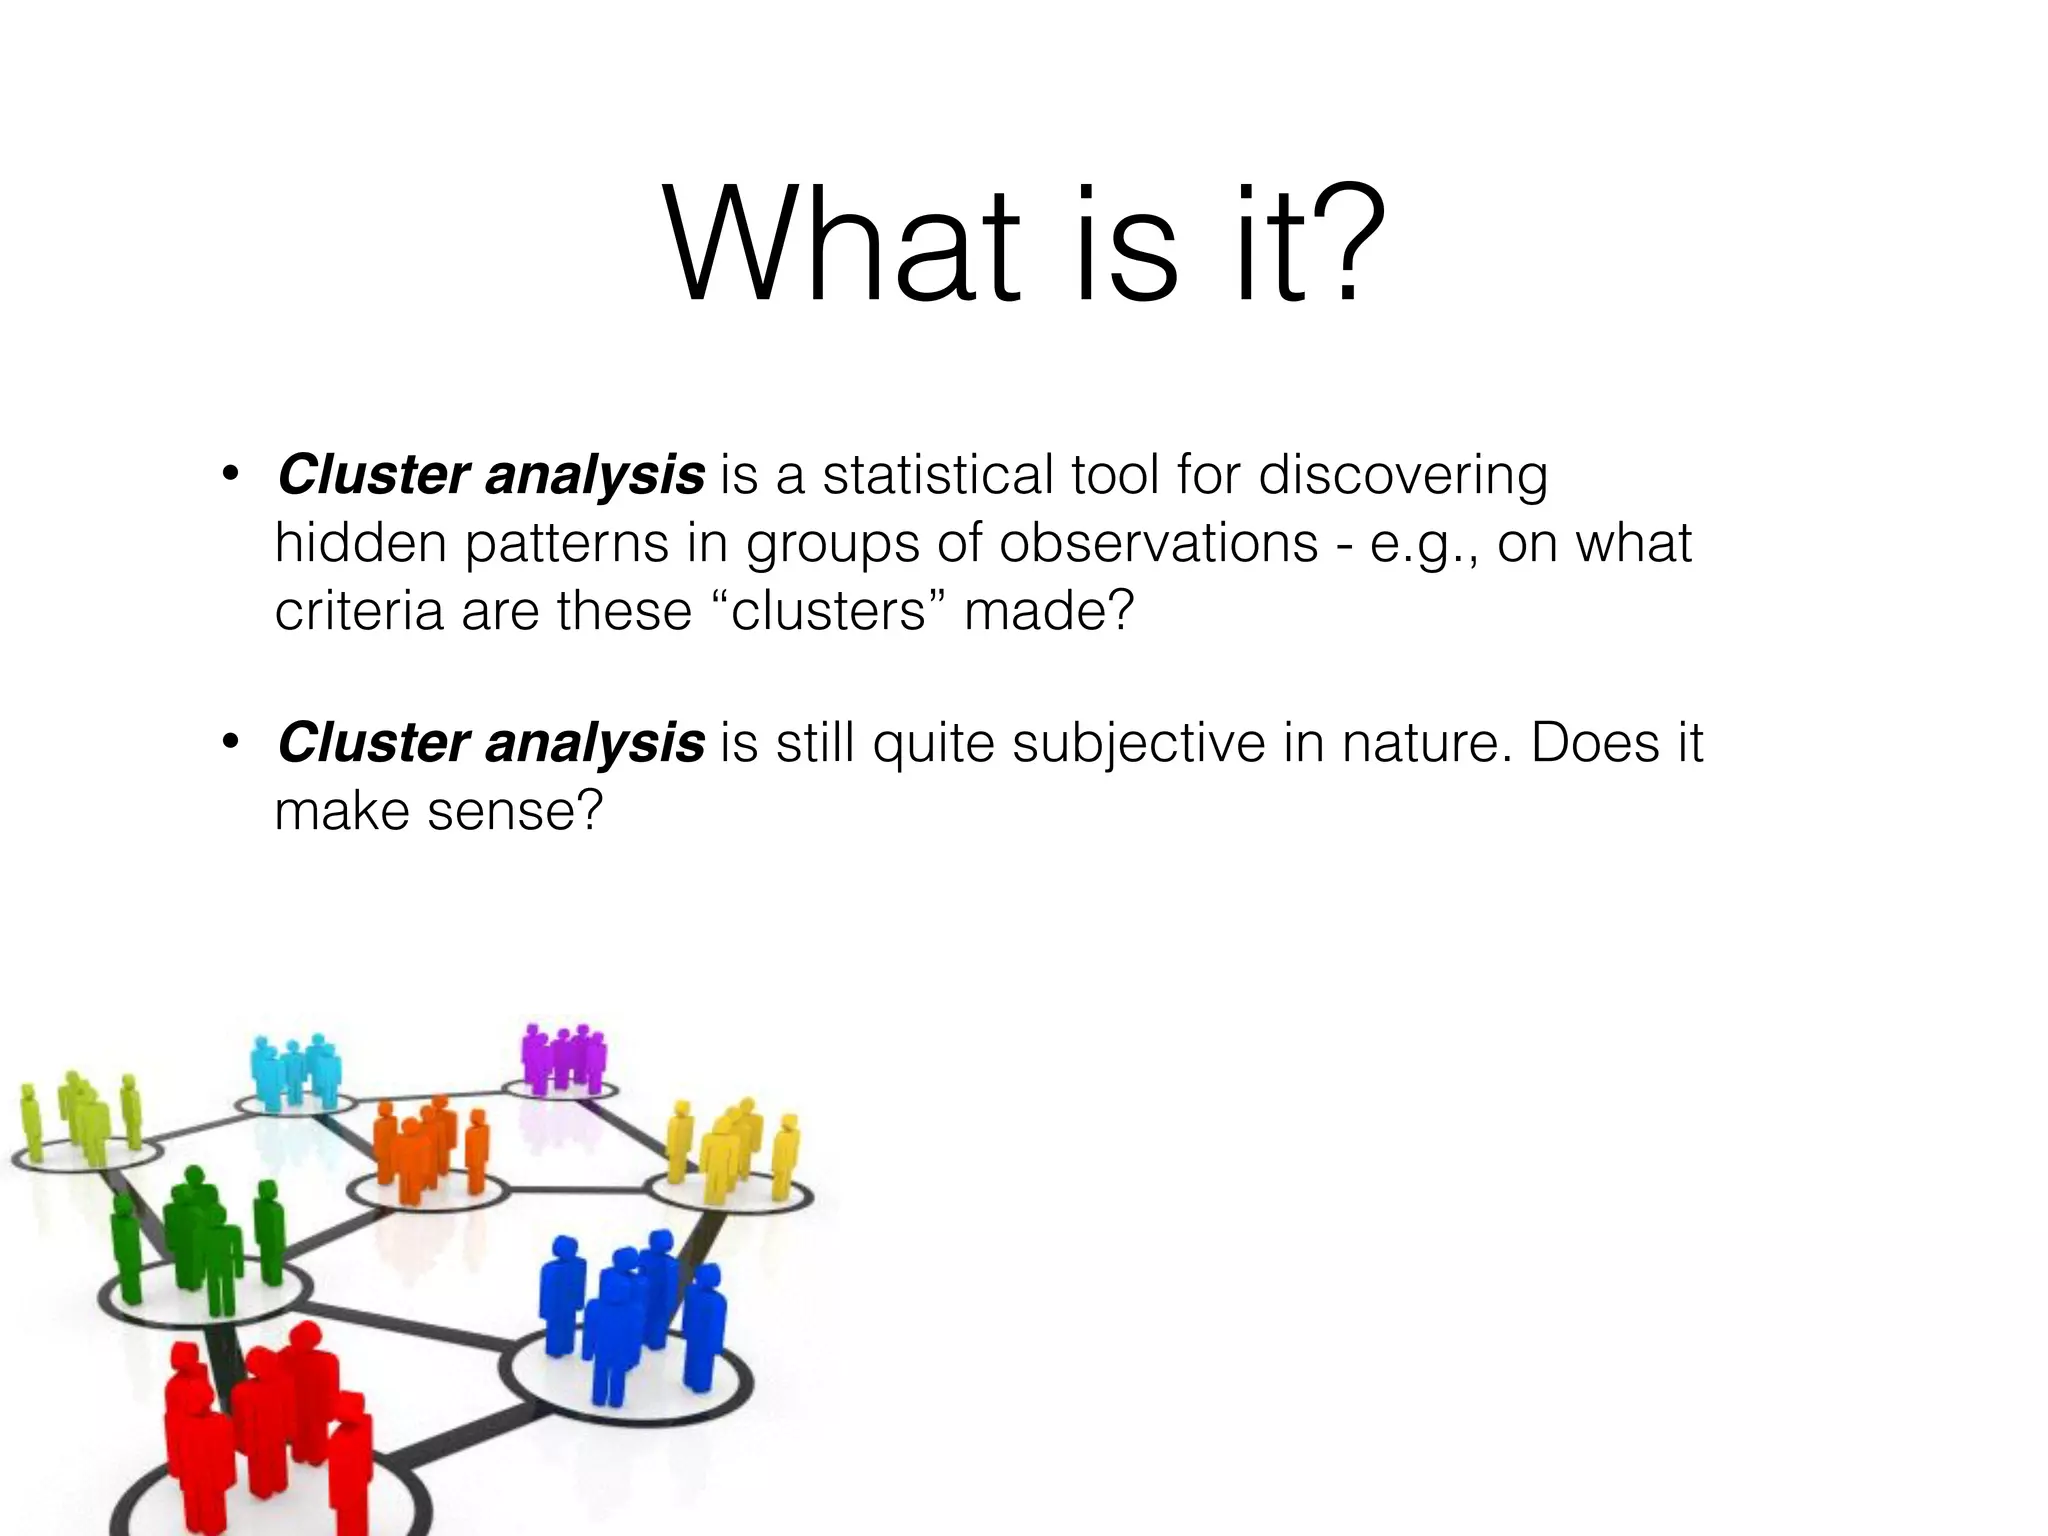
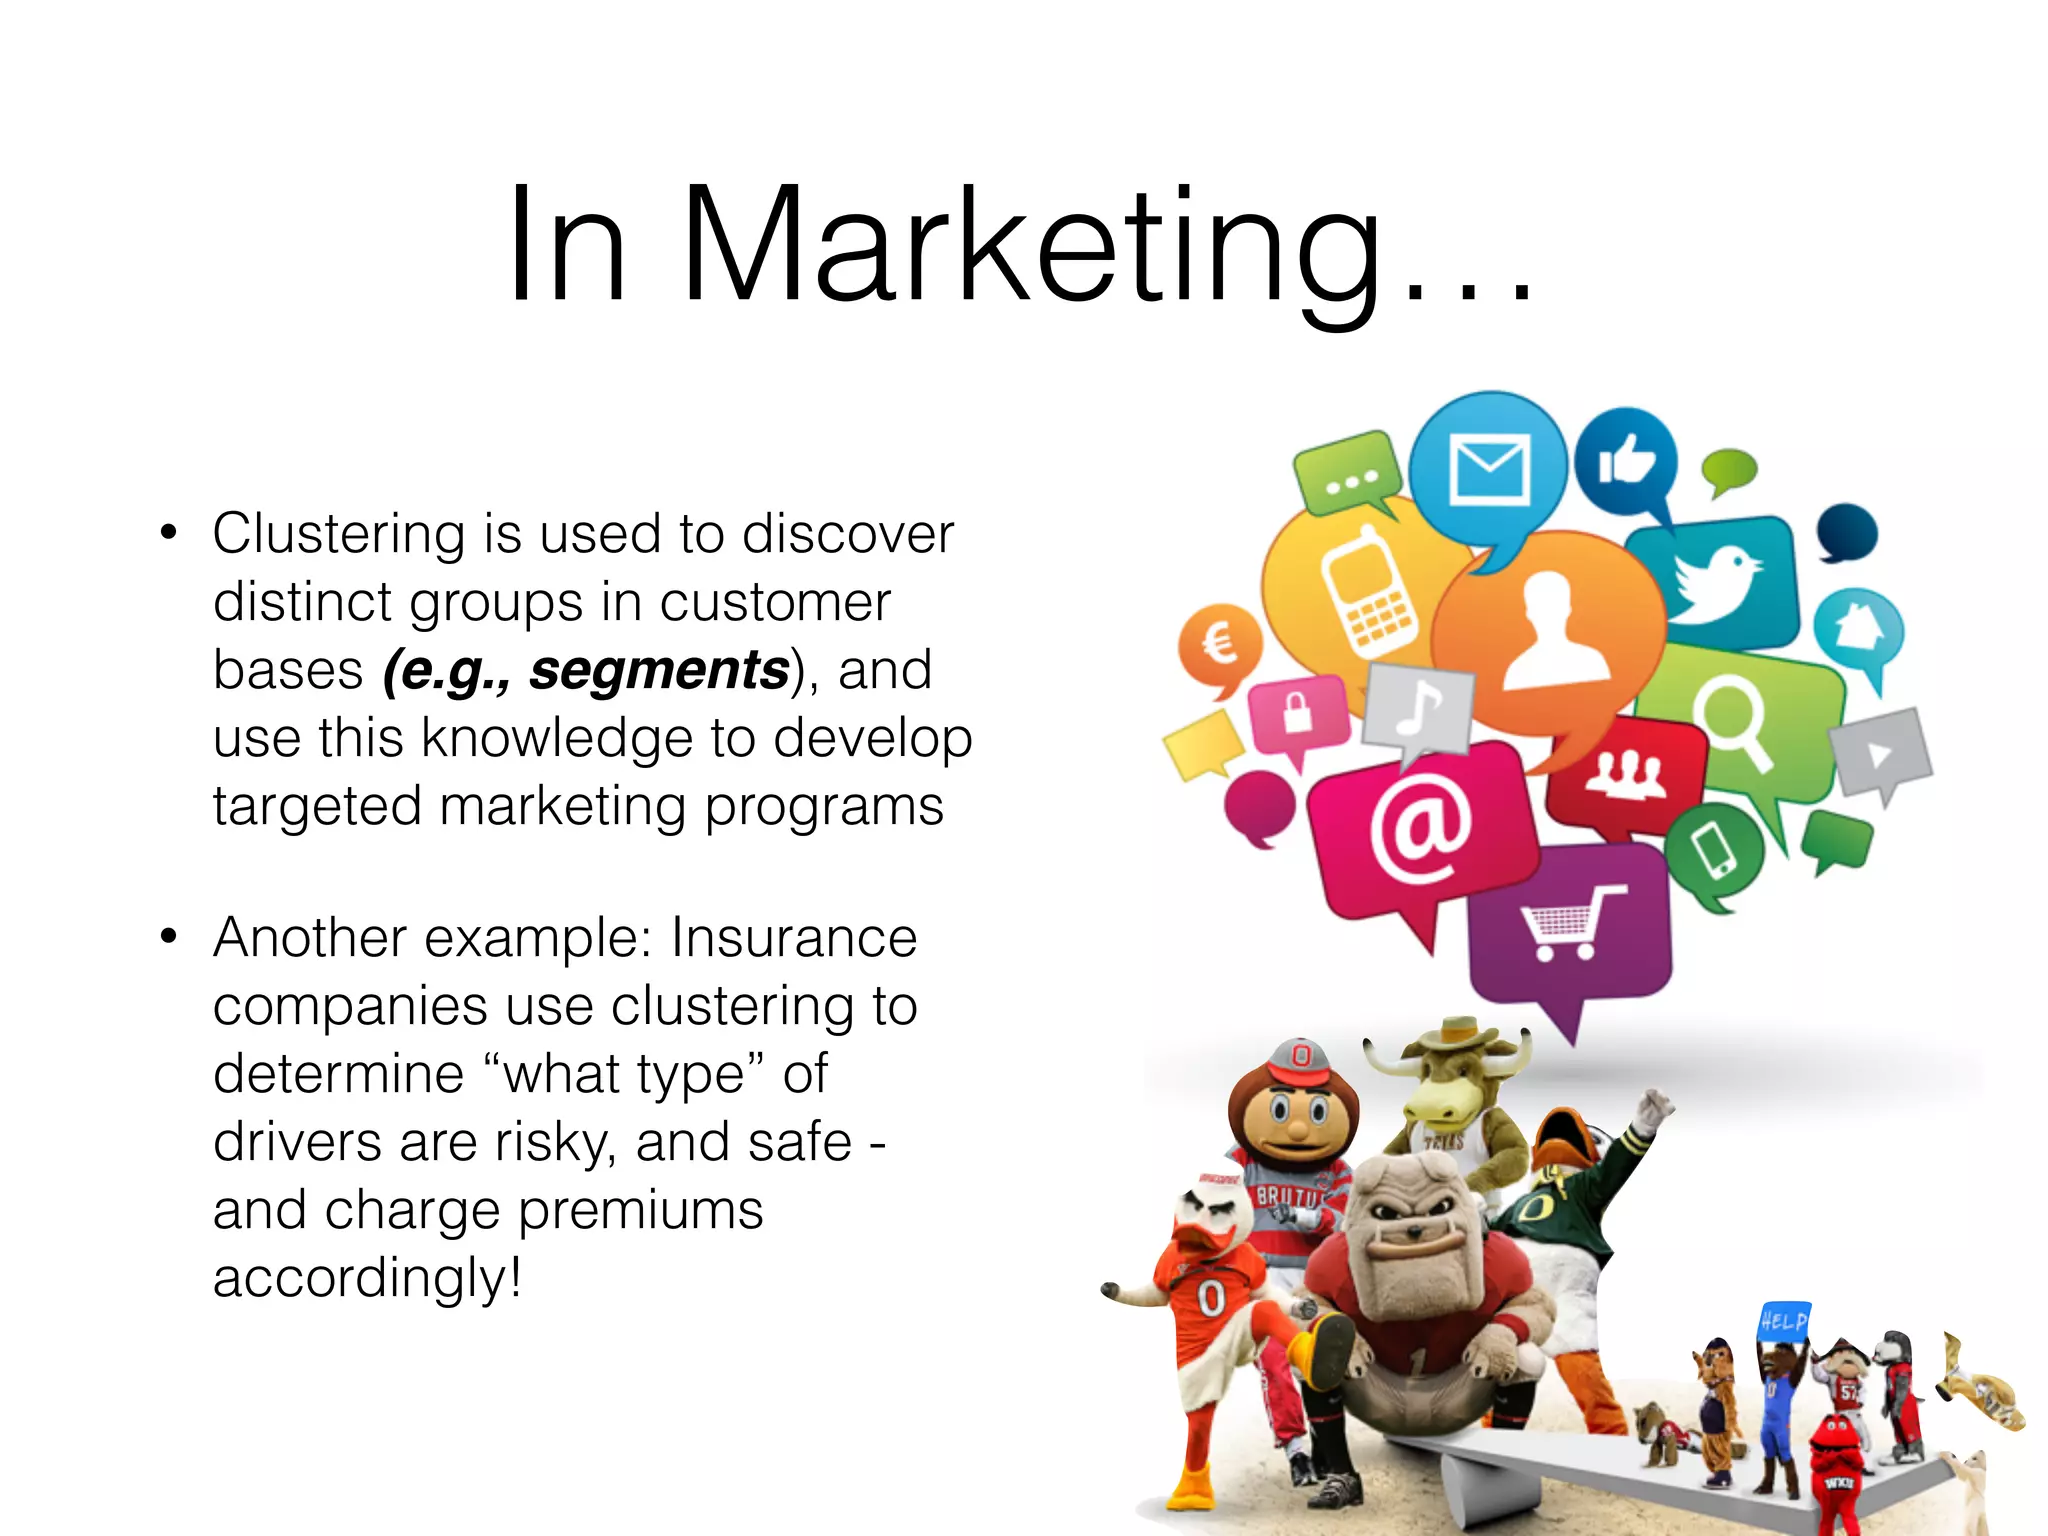
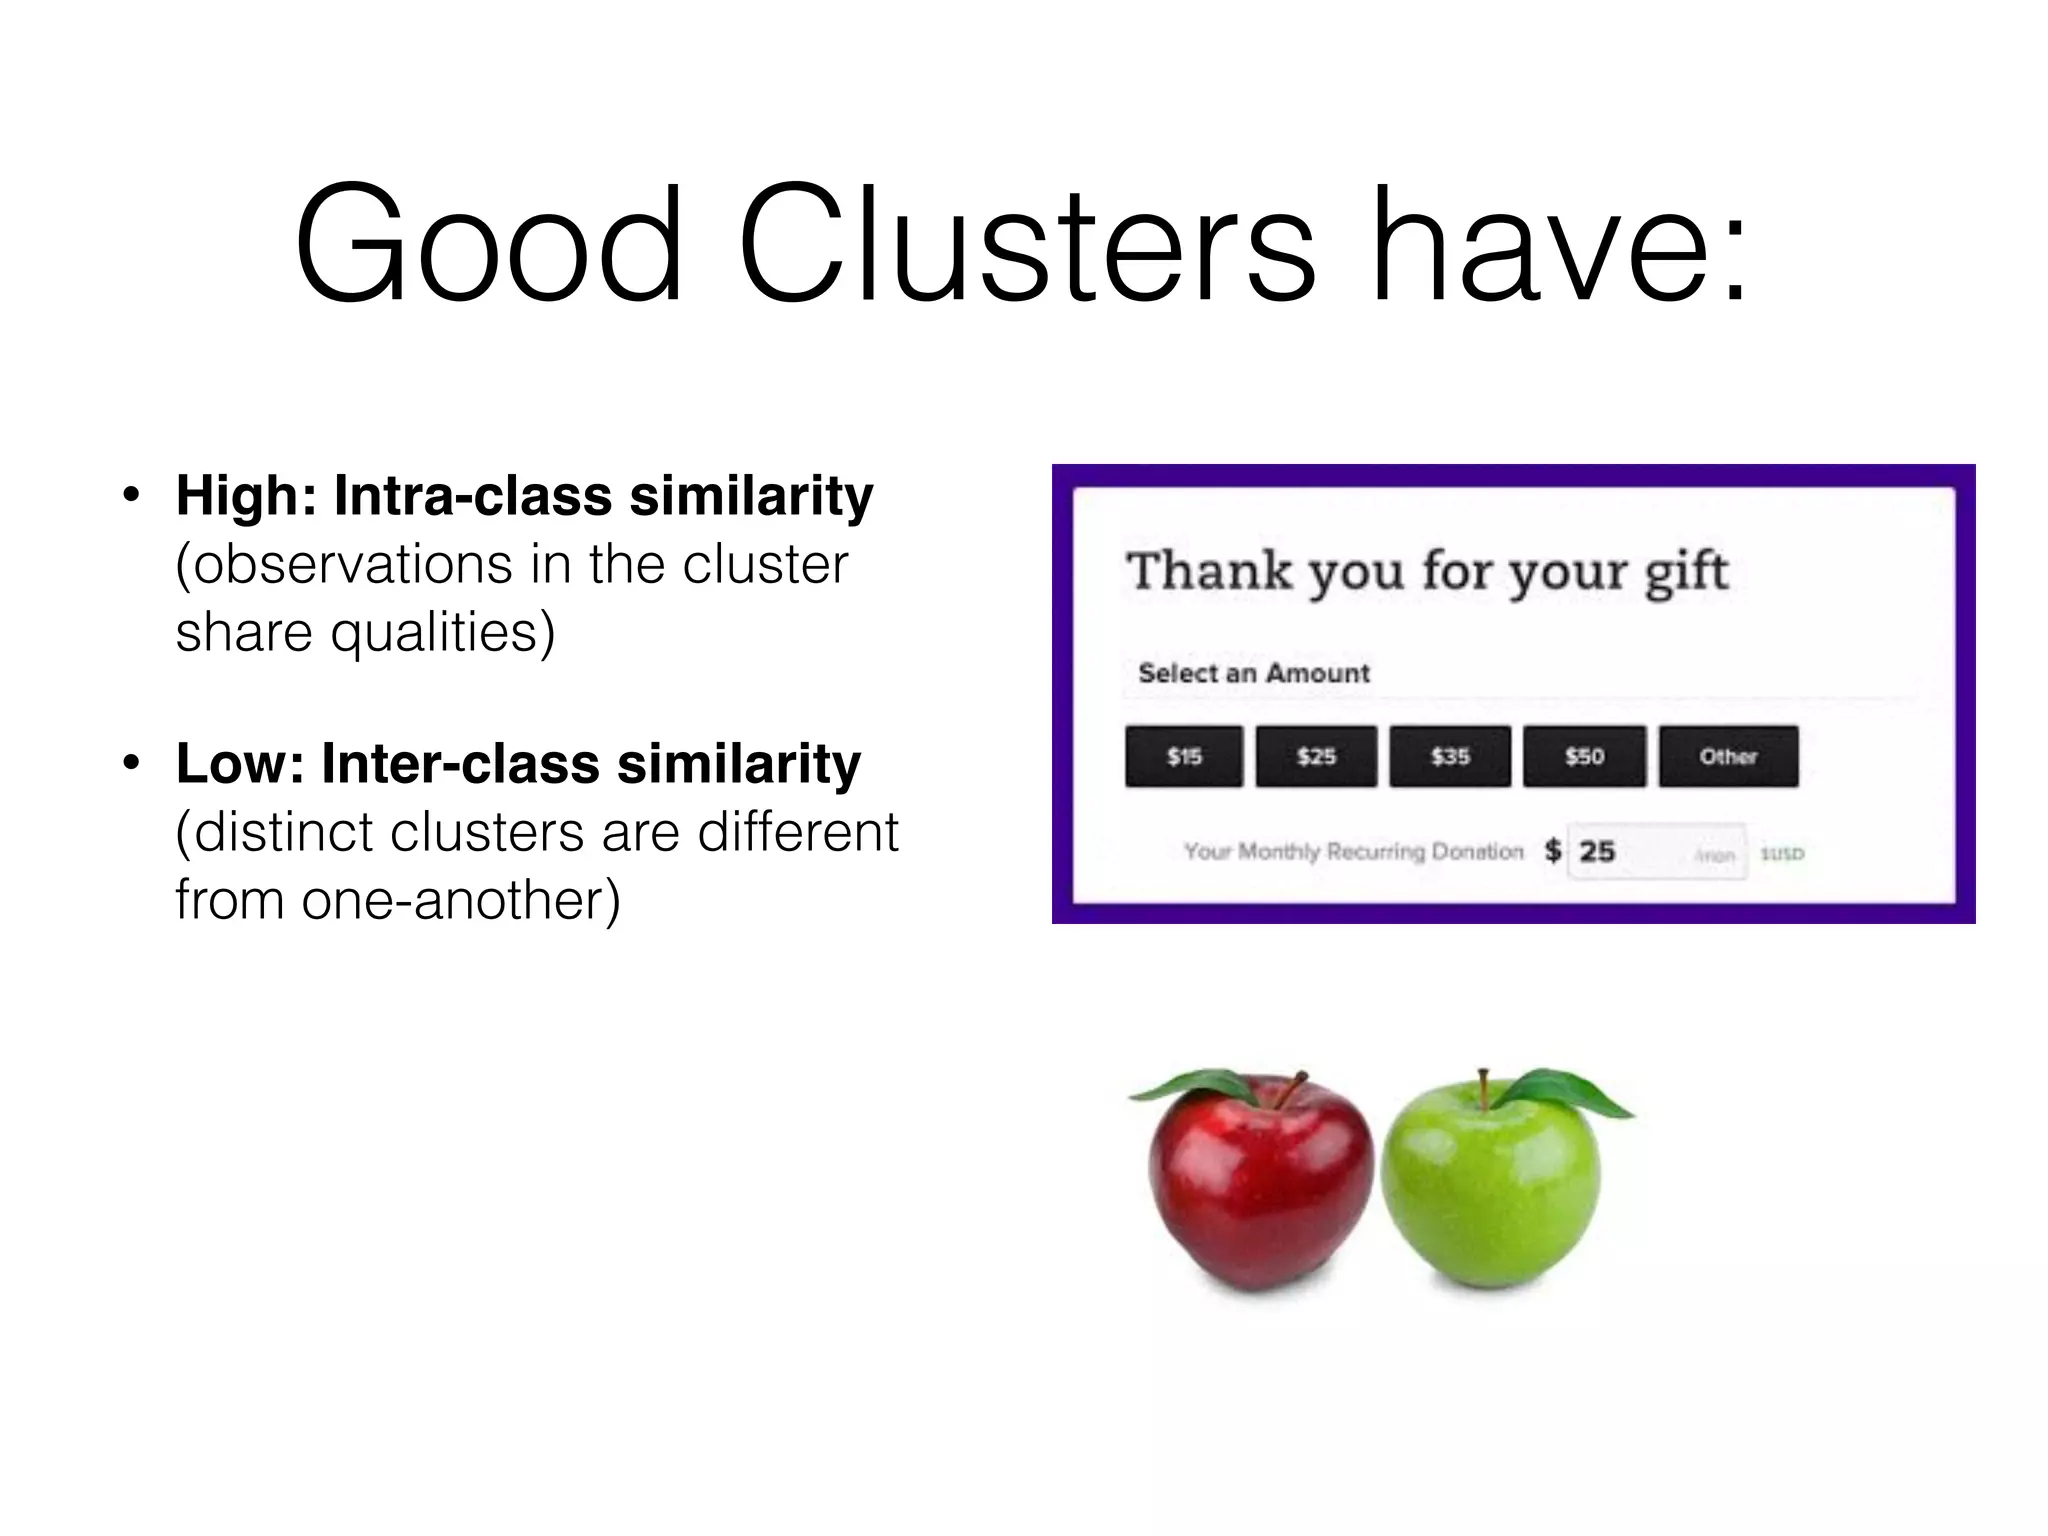
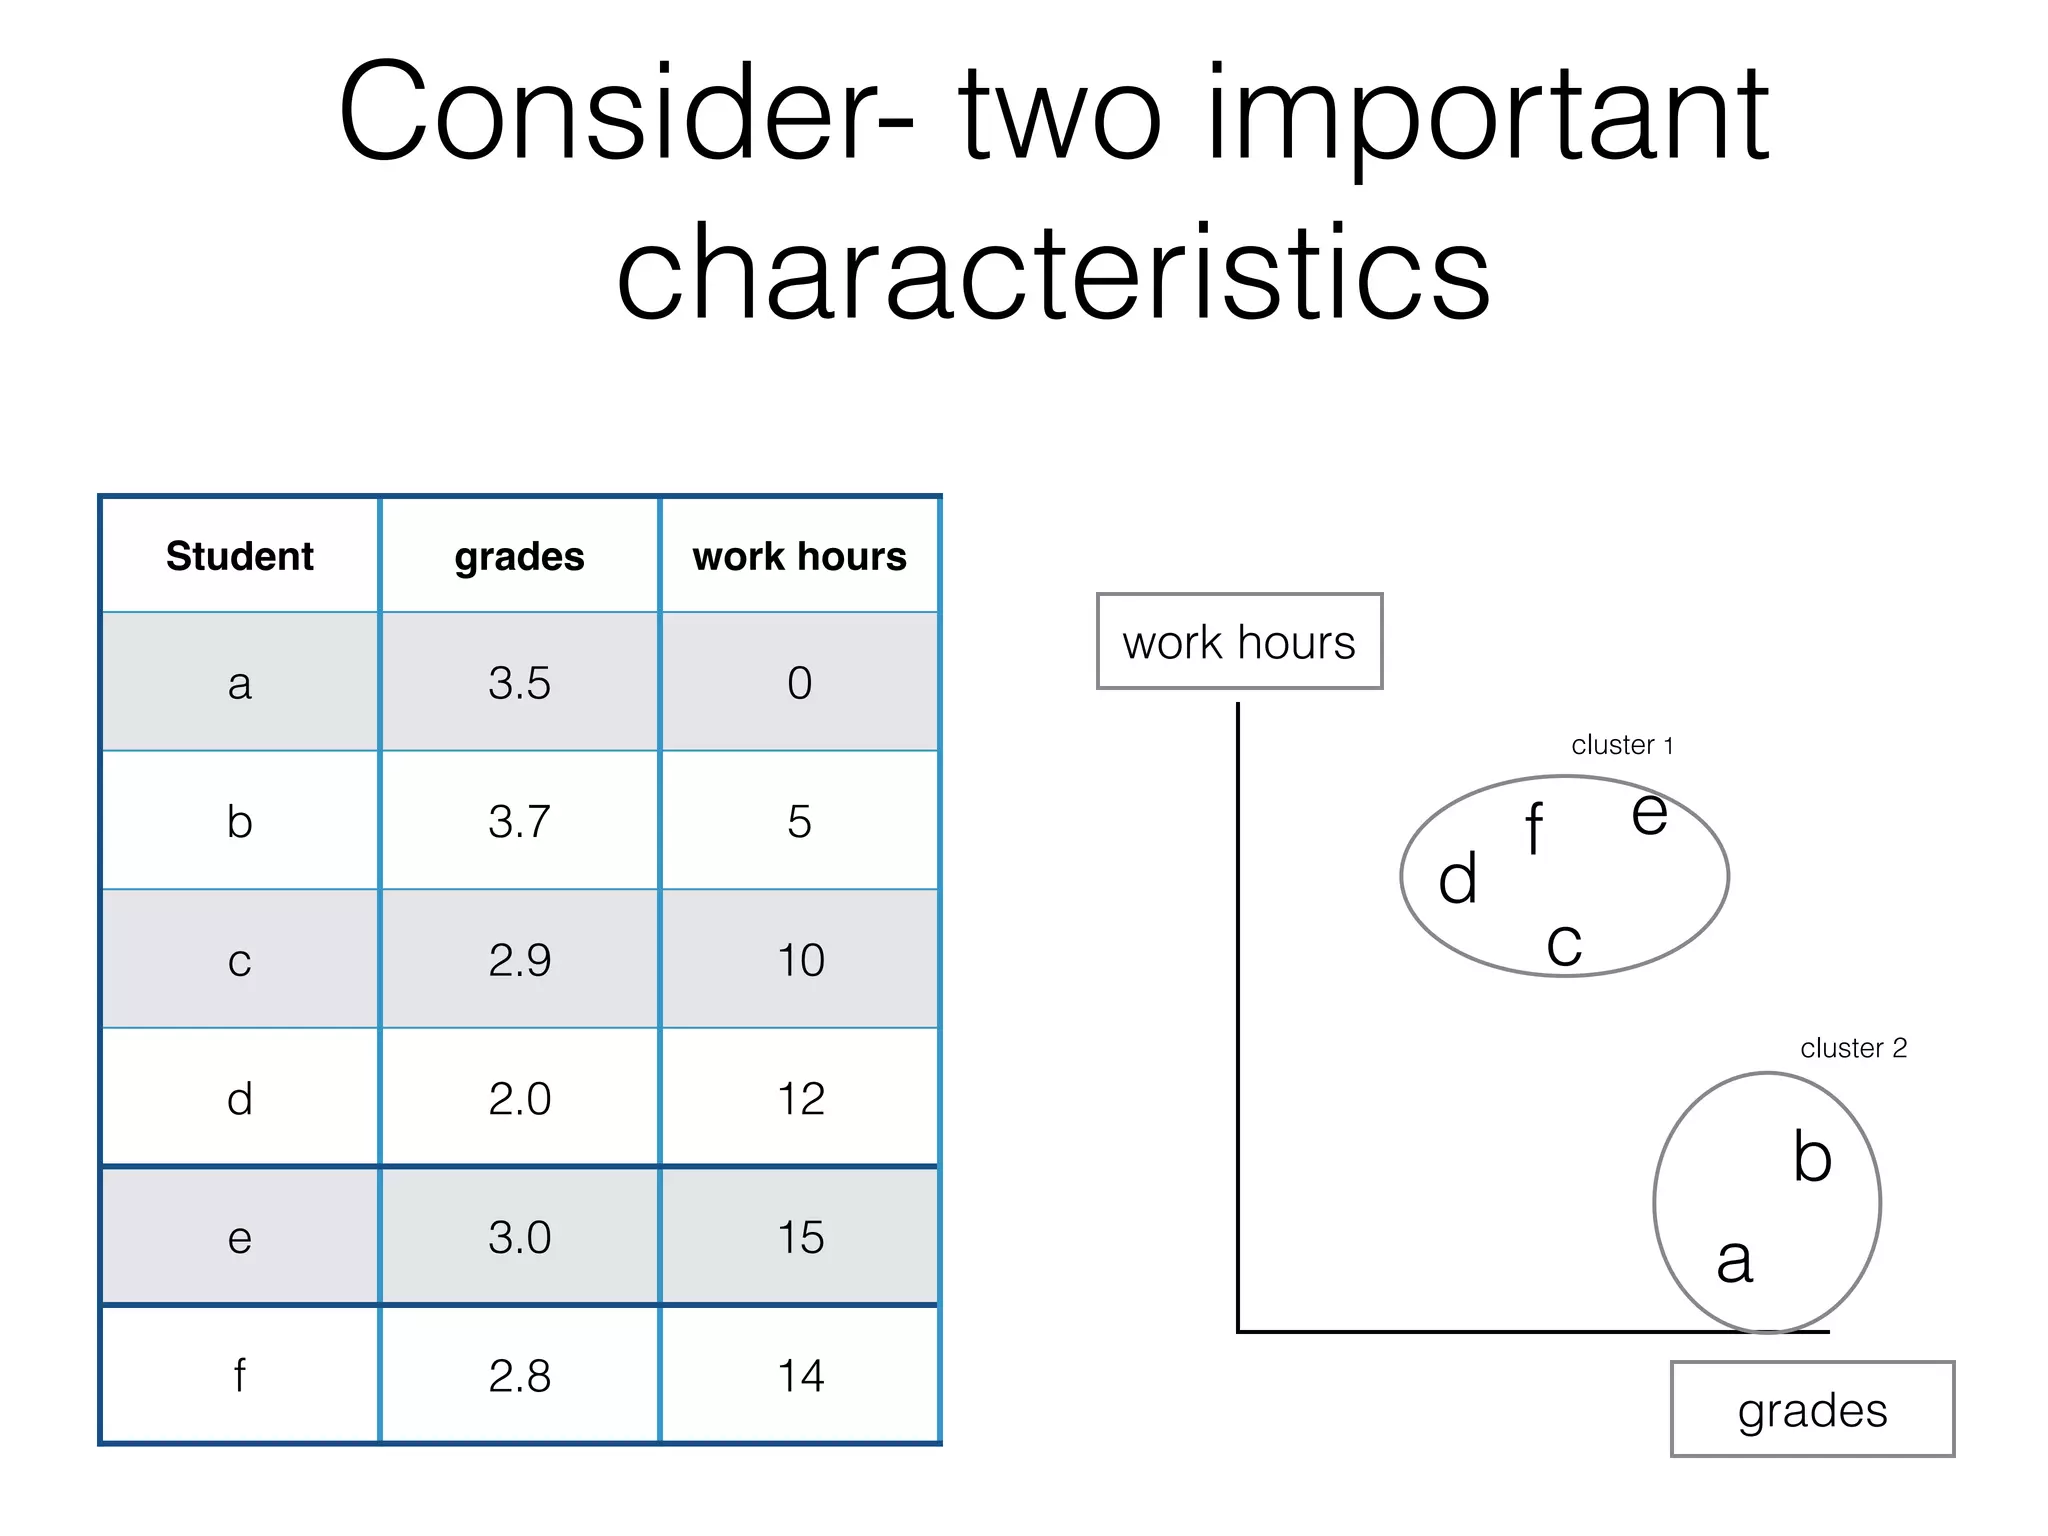
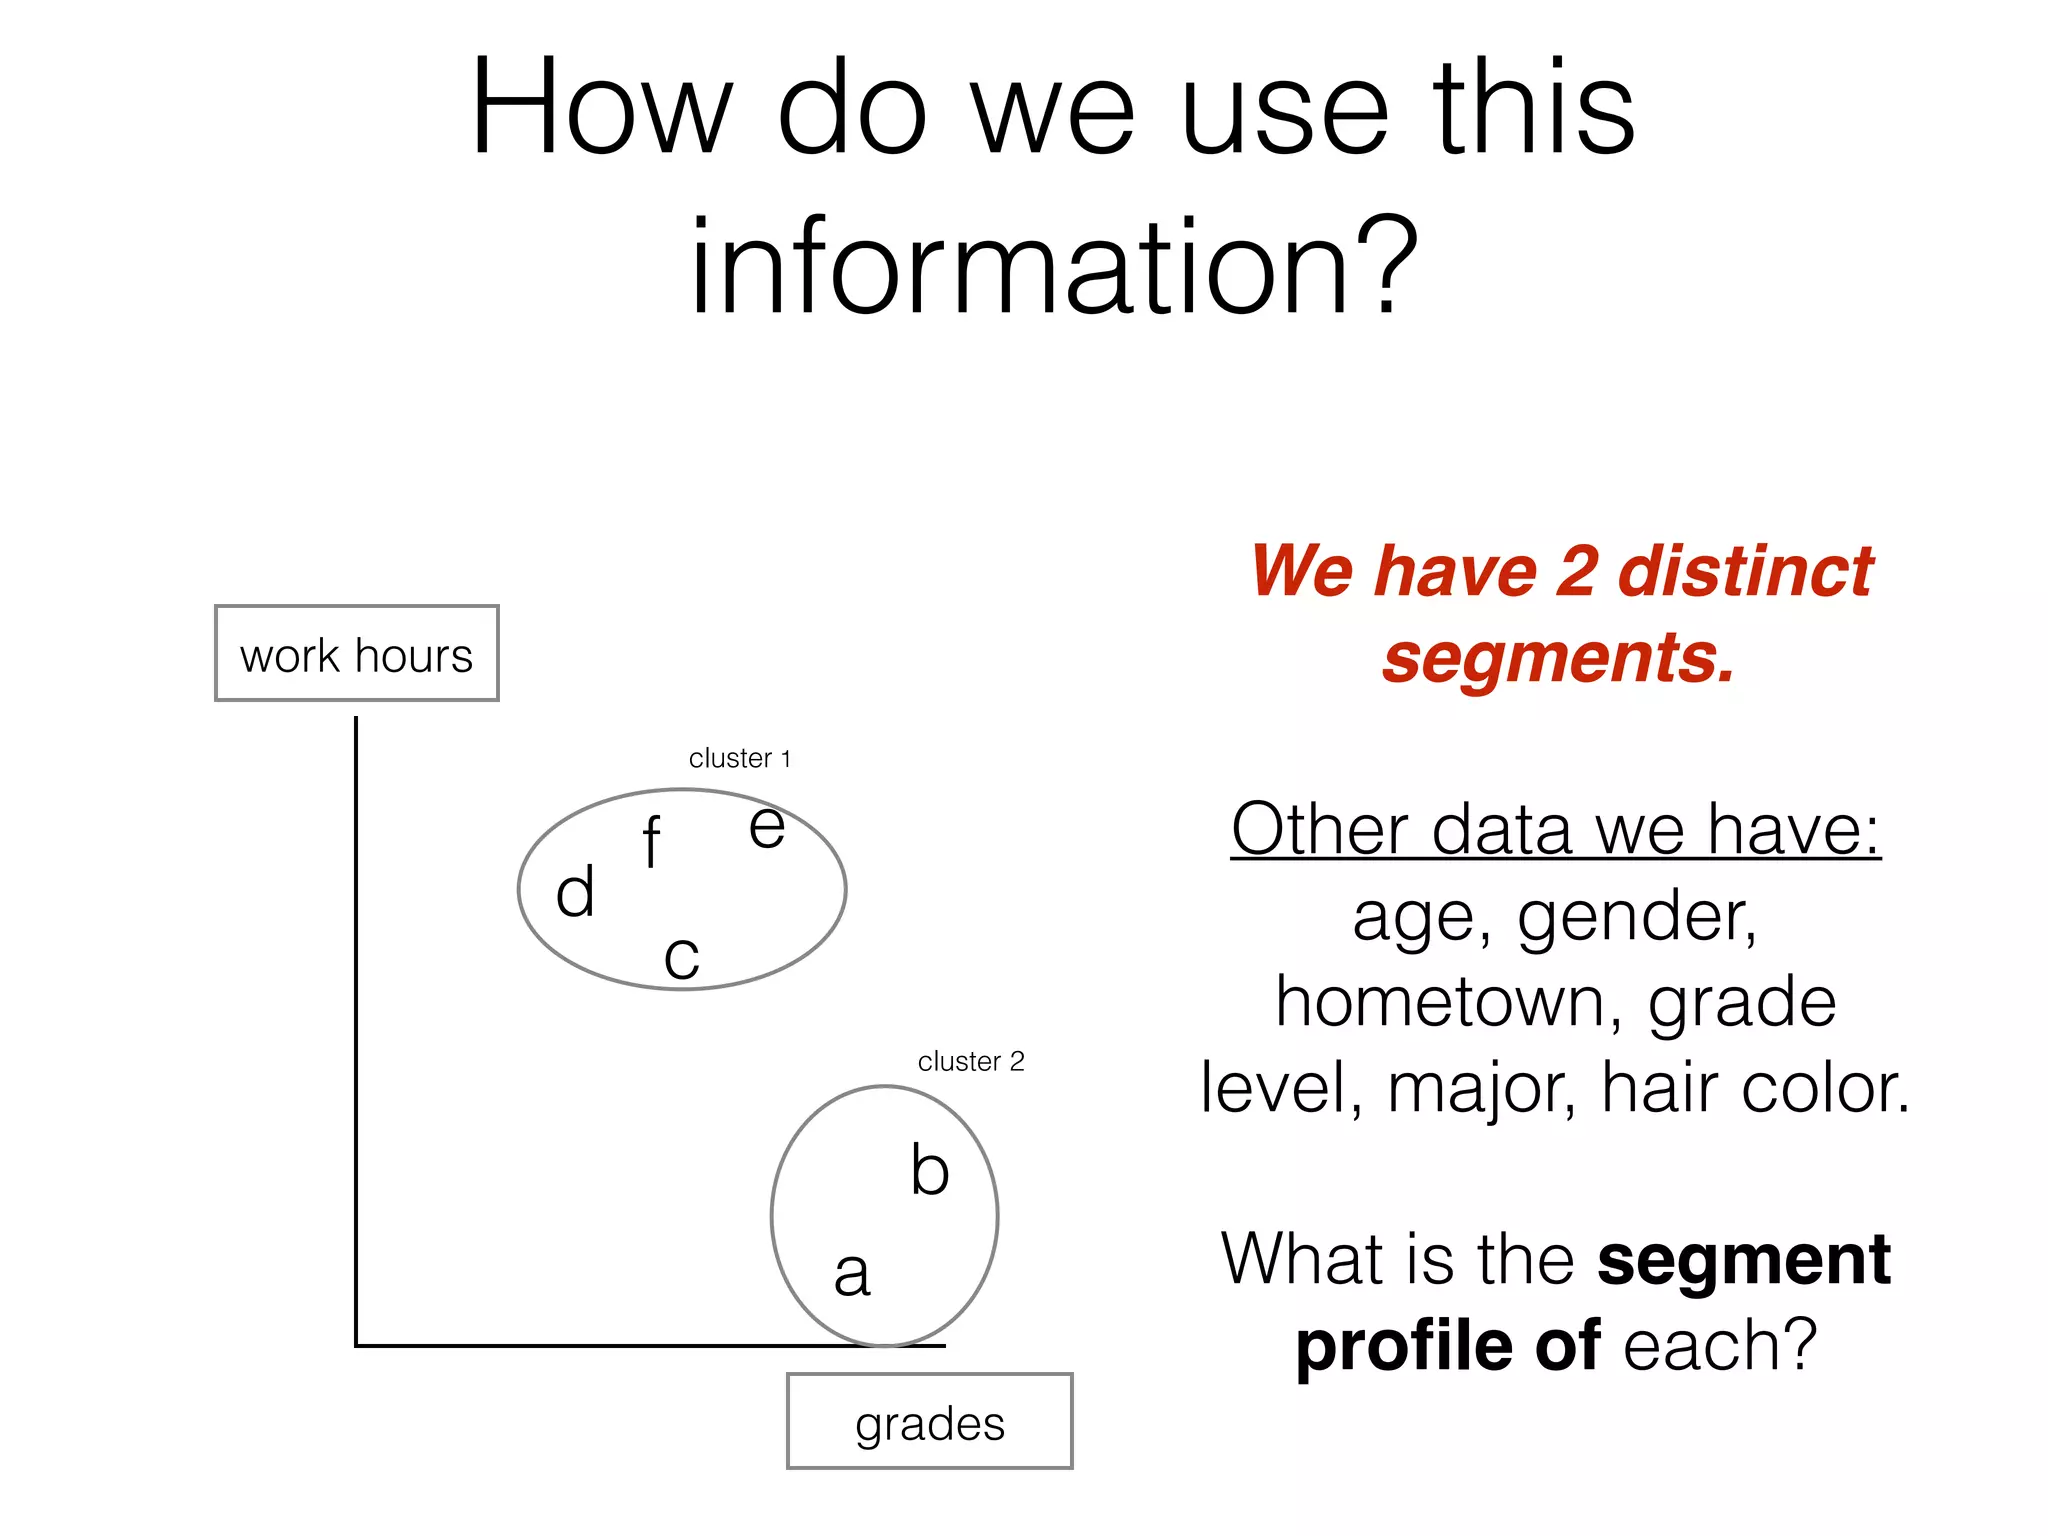
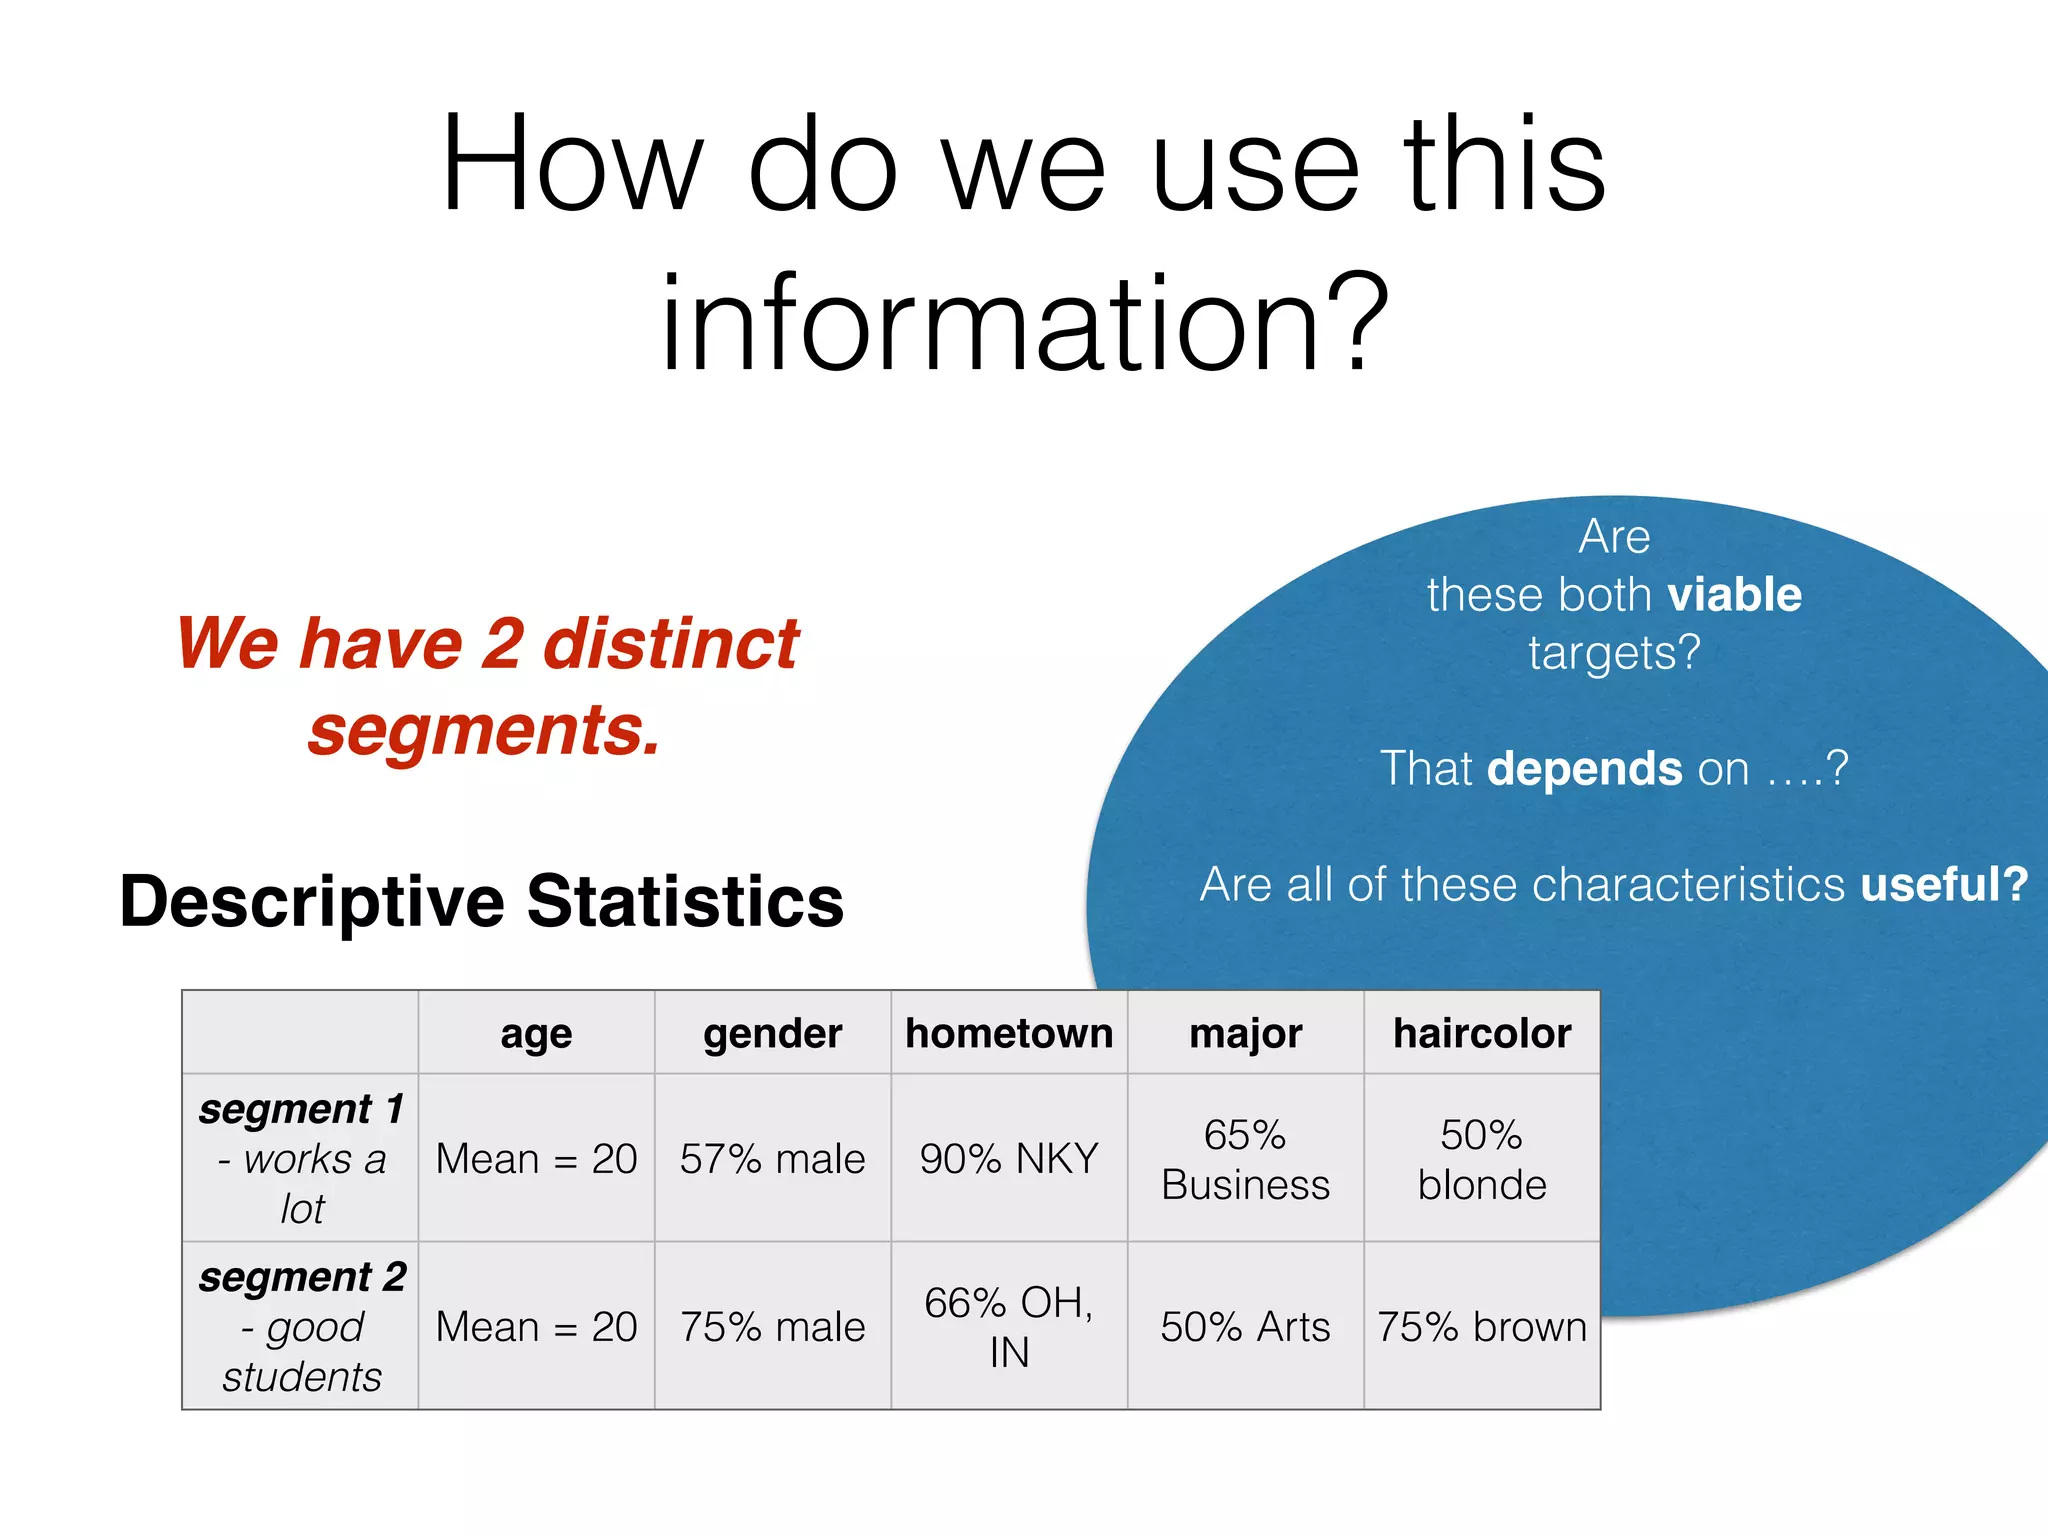
Cluster Analysis
For segmentation
Clustering
what is it?
why do we use it?
how do we do it?
What is it?
• Cluster analysis is the
process of grouping a set of
data into clusters.
• A cluster is a collection of data
points where each observation is
1) similar to other observations in
the same cluster, and 2) dissimilar
to observations in other clusters
What is it?
• Cluster analysis is a statistical tool for discovering
hidden patterns in groups of observations - e.g., on what
criteria are these “clusters” made?
• Cluster analysis is still quite subjective in nature. Does it
make sense?
In Marketing…
• Clustering is used to discover
distinct groups in customer
bases (e.g., segments), and
use this knowledge to develop
targeted marketing programs
• Another example: Insurance
companies use clustering to
determine “what type” of
drivers are risky, and safe -
and charge premiums
accordingly!
Good Clusters have:
• High: Intra-class similarity
(observations in the cluster
share qualities)
• Low: Inter-class similarity
(distinct clusters are different
from one-another)
Consider- two important
characteristics
Student grades work hours
a 3.5 0
b 3.7 5
c 2.9 10
d 2.0 12
e 3.0 15
f 2.8 14
work hours
grades
a
d
c
b
ef
cluster 1
cluster 2
How do we use this
information?
We have 2 distinct
segments.
Other data we have:
age, gender,
hometown, grade
level, major, hair color.
What is the segment
profile of each?
work hours
grades
a
d
c
b
ef
cluster 1
cluster 2
Are
these both viable
targets?
That depends on ….?
Are all of these characteristics useful?
How do we use this
information?
We have 2 distinct
segments.
Descriptive Statistics
age gender hometown major haircolor
segment 1
- works a
lot
Mean = 20 57% male 90% NKY
65%
Business
50%
blonde
segment 2
- good
students
Mean = 20 75% male
66% OH,
IN
50% Arts 75% brown
How to do it!
• You need access to SPSS.
You can either 1) log in to
NKU’s virtual network (VPN)
using the virtual desktop, or
you can use a University
computer. (I suggest VPN)
• Use this link to learn how to
use the virtual desktop. You
first have to install the VPN
software if you want to do it
off-campus: click here.
Steps to follow…
• Open your data set and save it
to a portable drive or your NKU
“j” drive
• We will be using “Two-Step”
cluster analysis.
• From SPSS file:
Analyze —->Classify —> two-step cluster
The Youtube tutorial is linked here if you need to review it.
Then follow the instructions on the YouTube
tutorial.
Warnings
Don’t use binary variables in the clustering process (e.g., gender,
team (yes/no)). These are “swamping variables” and will hijack your
clusters.
Clusters of 3-4 are ideal, even if you have to force it and the
criteria are not very good. You only have what you have…
Your data set might not ever give you “perfect” results based on the
criteria discussed in the video tutorial. Thats ok. Do the best you
can.
More on Profiles to come…

Basics of Clustering

  • 1.
  • 2.
    Clustering what is it? whydo we use it? how do we do it?
  • 3.
    What is it? •Cluster analysis is the process of grouping a set of data into clusters. • A cluster is a collection of data points where each observation is 1) similar to other observations in the same cluster, and 2) dissimilar to observations in other clusters
  • 4.
    What is it? •Cluster analysis is a statistical tool for discovering hidden patterns in groups of observations - e.g., on what criteria are these “clusters” made? • Cluster analysis is still quite subjective in nature. Does it make sense?
  • 5.
    In Marketing… • Clusteringis used to discover distinct groups in customer bases (e.g., segments), and use this knowledge to develop targeted marketing programs • Another example: Insurance companies use clustering to determine “what type” of drivers are risky, and safe - and charge premiums accordingly!
  • 6.
    Good Clusters have: •High: Intra-class similarity (observations in the cluster share qualities) • Low: Inter-class similarity (distinct clusters are different from one-another)
  • 7.
    Consider- two important characteristics Studentgrades work hours a 3.5 0 b 3.7 5 c 2.9 10 d 2.0 12 e 3.0 15 f 2.8 14 work hours grades a d c b ef cluster 1 cluster 2
  • 8.
    How do weuse this information? We have 2 distinct segments. Other data we have: age, gender, hometown, grade level, major, hair color. What is the segment profile of each? work hours grades a d c b ef cluster 1 cluster 2
  • 9.
    Are these both viable targets? Thatdepends on ….? Are all of these characteristics useful? How do we use this information? We have 2 distinct segments. Descriptive Statistics age gender hometown major haircolor segment 1 - works a lot Mean = 20 57% male 90% NKY 65% Business 50% blonde segment 2 - good students Mean = 20 75% male 66% OH, IN 50% Arts 75% brown
  • 10.
    How to doit! • You need access to SPSS. You can either 1) log in to NKU’s virtual network (VPN) using the virtual desktop, or you can use a University computer. (I suggest VPN) • Use this link to learn how to use the virtual desktop. You first have to install the VPN software if you want to do it off-campus: click here.
  • 11.
    Steps to follow… •Open your data set and save it to a portable drive or your NKU “j” drive • We will be using “Two-Step” cluster analysis. • From SPSS file: Analyze —->Classify —> two-step cluster The Youtube tutorial is linked here if you need to review it. Then follow the instructions on the YouTube tutorial.
  • 12.
    Warnings Don’t use binaryvariables in the clustering process (e.g., gender, team (yes/no)). These are “swamping variables” and will hijack your clusters. Clusters of 3-4 are ideal, even if you have to force it and the criteria are not very good. You only have what you have… Your data set might not ever give you “perfect” results based on the criteria discussed in the video tutorial. Thats ok. Do the best you can.
  • 13.