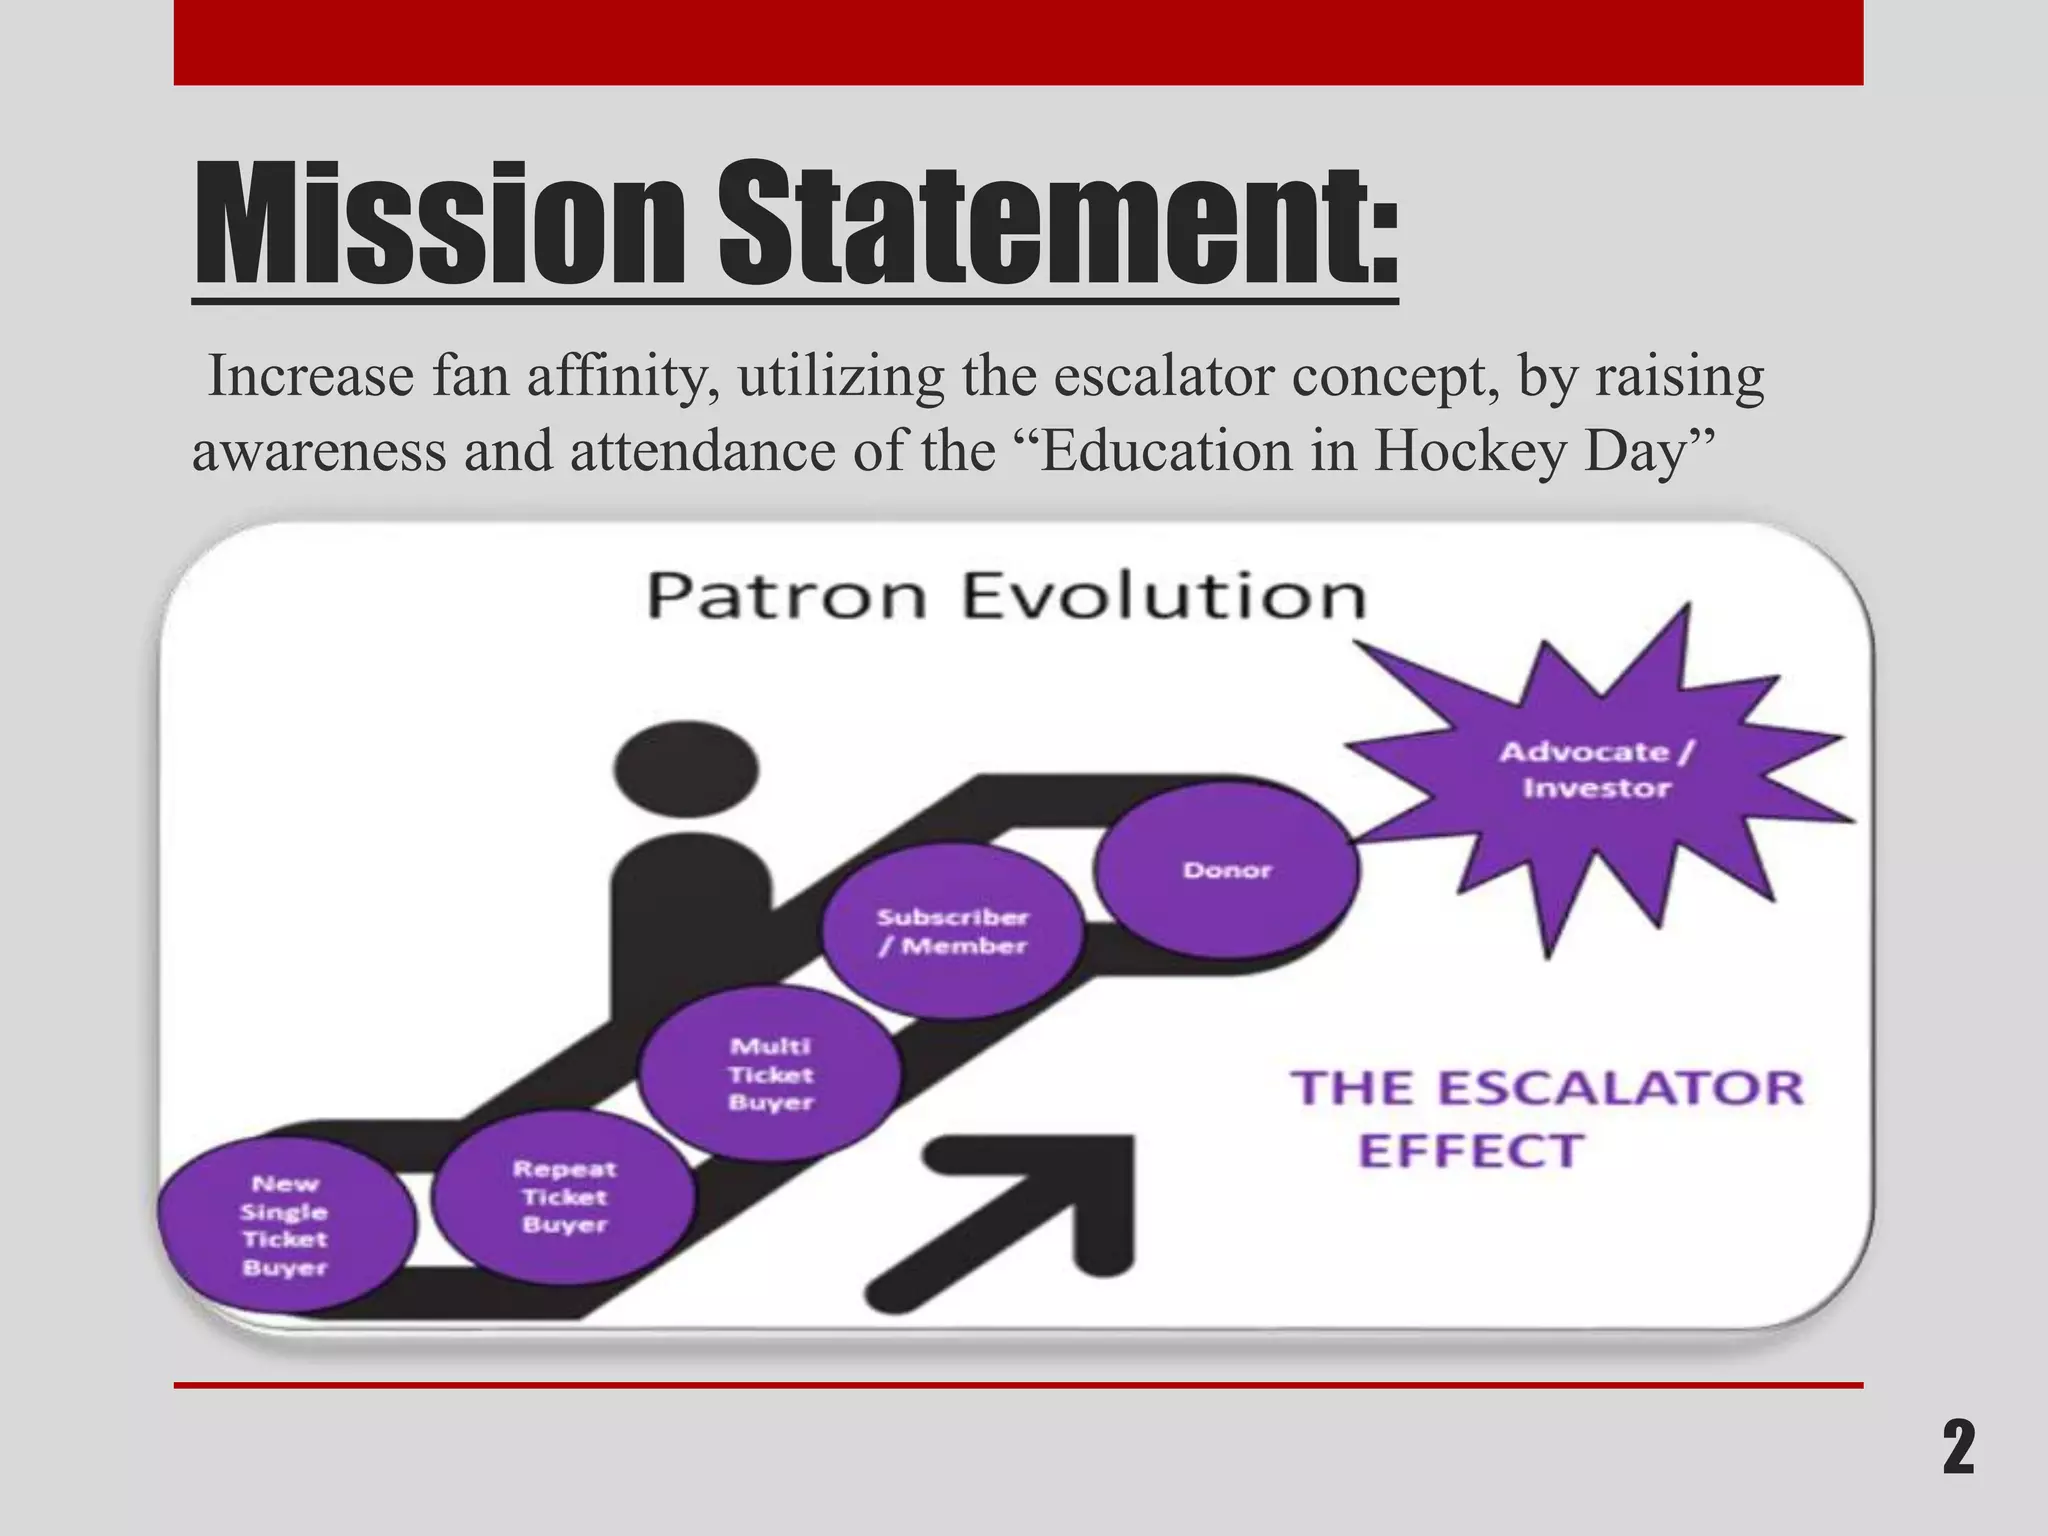
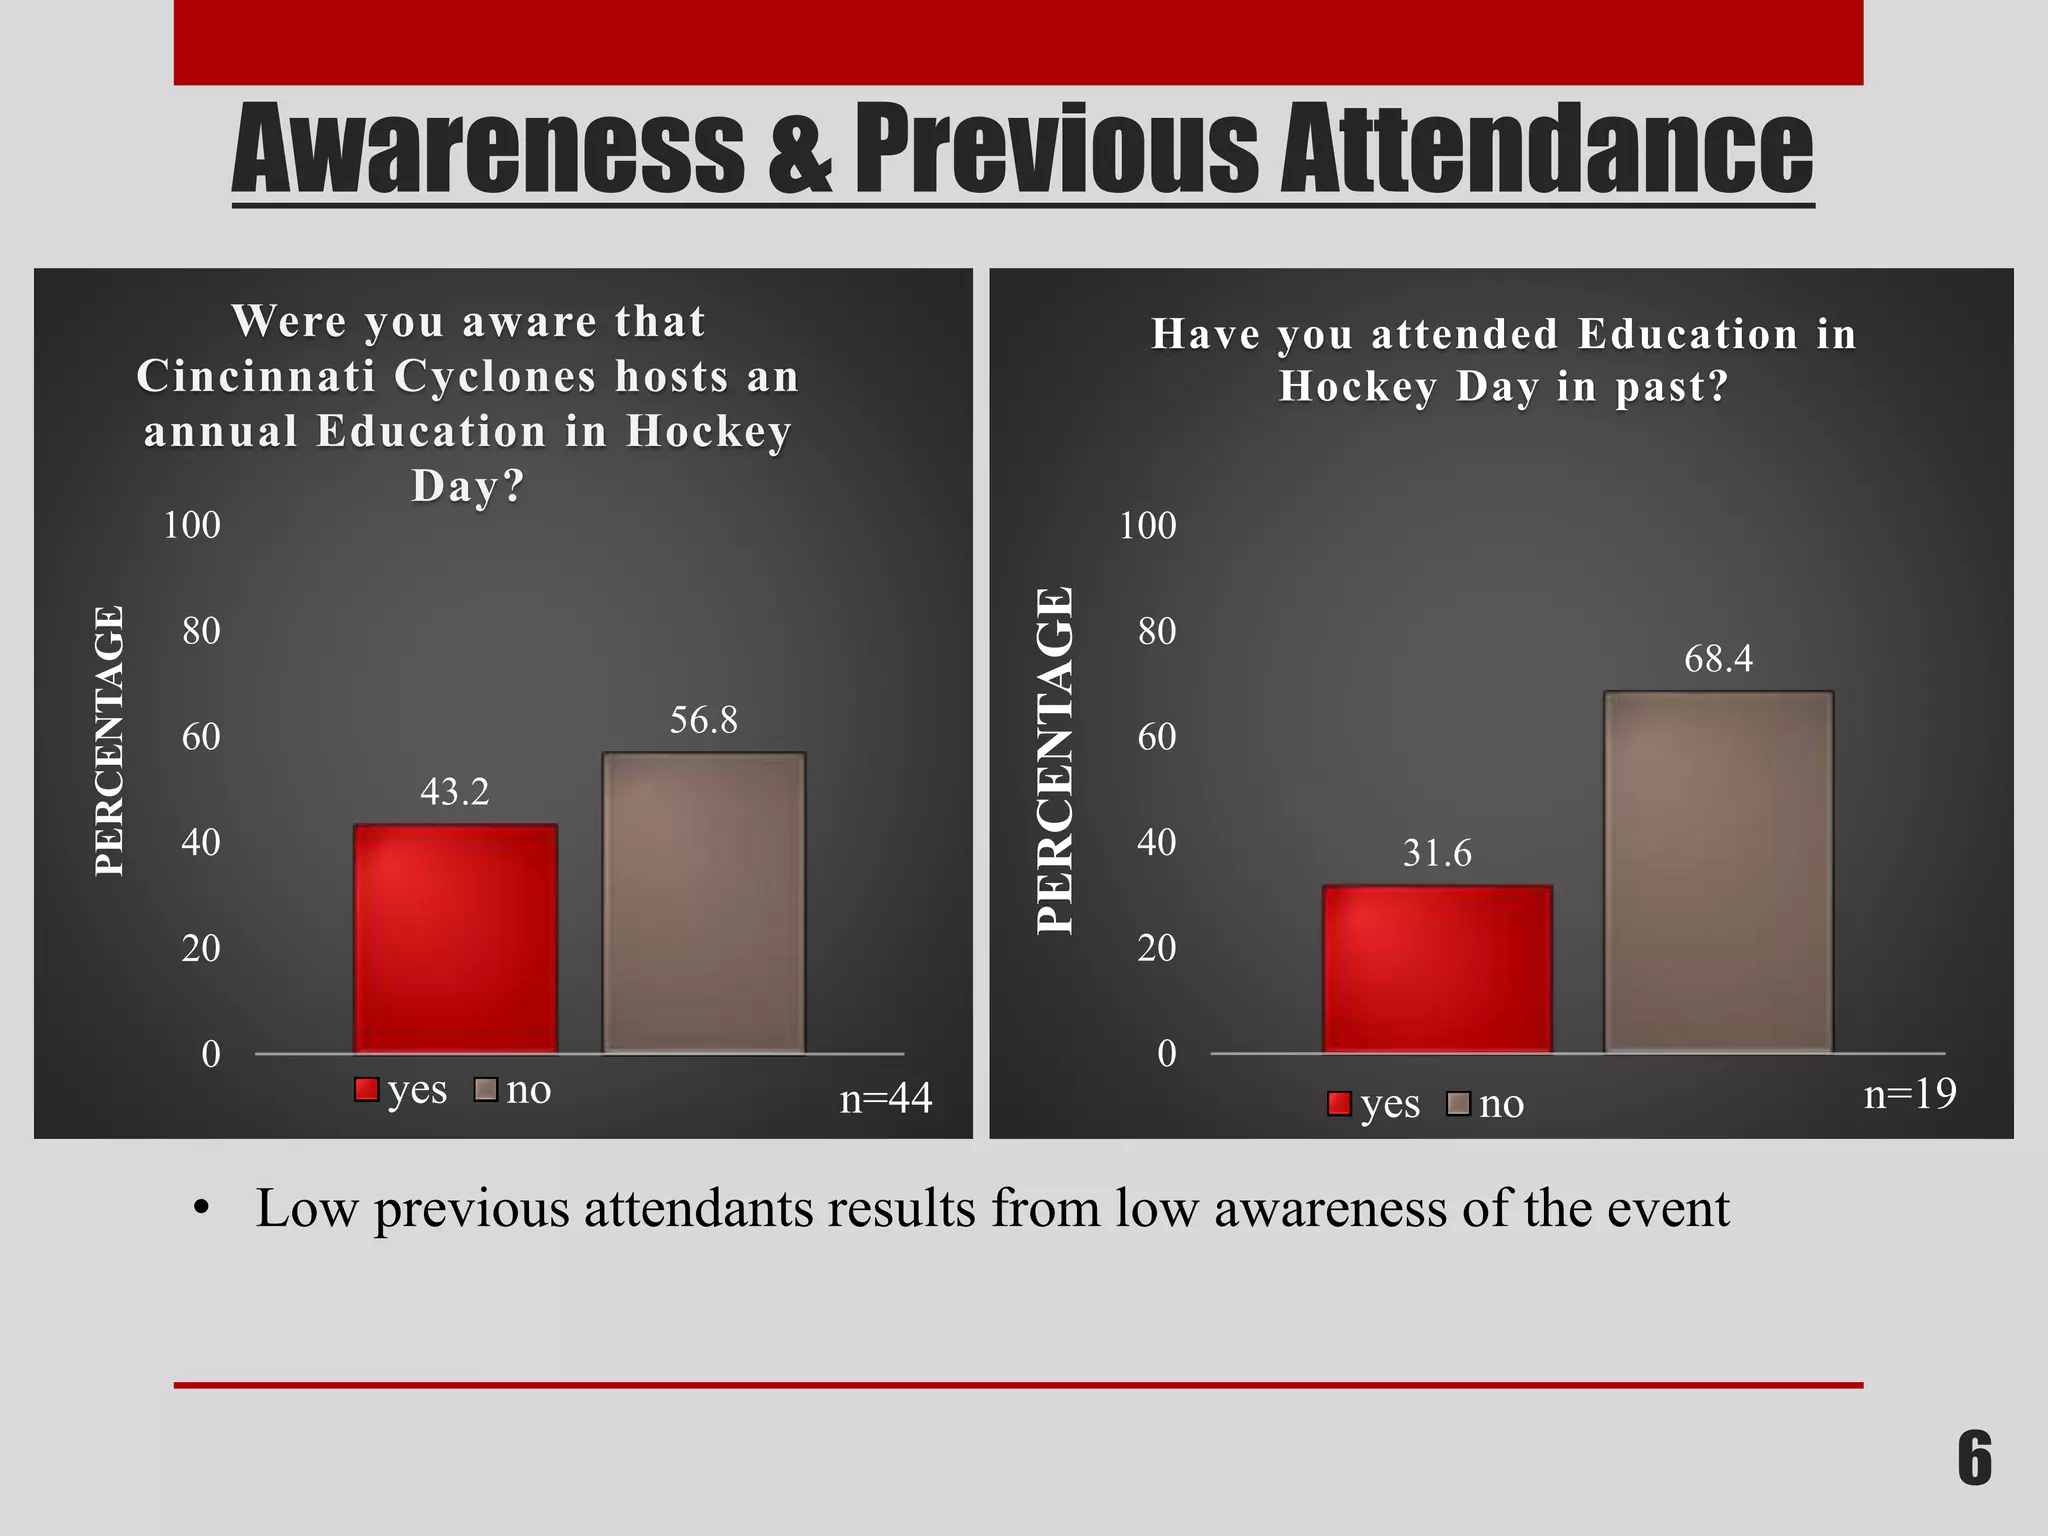
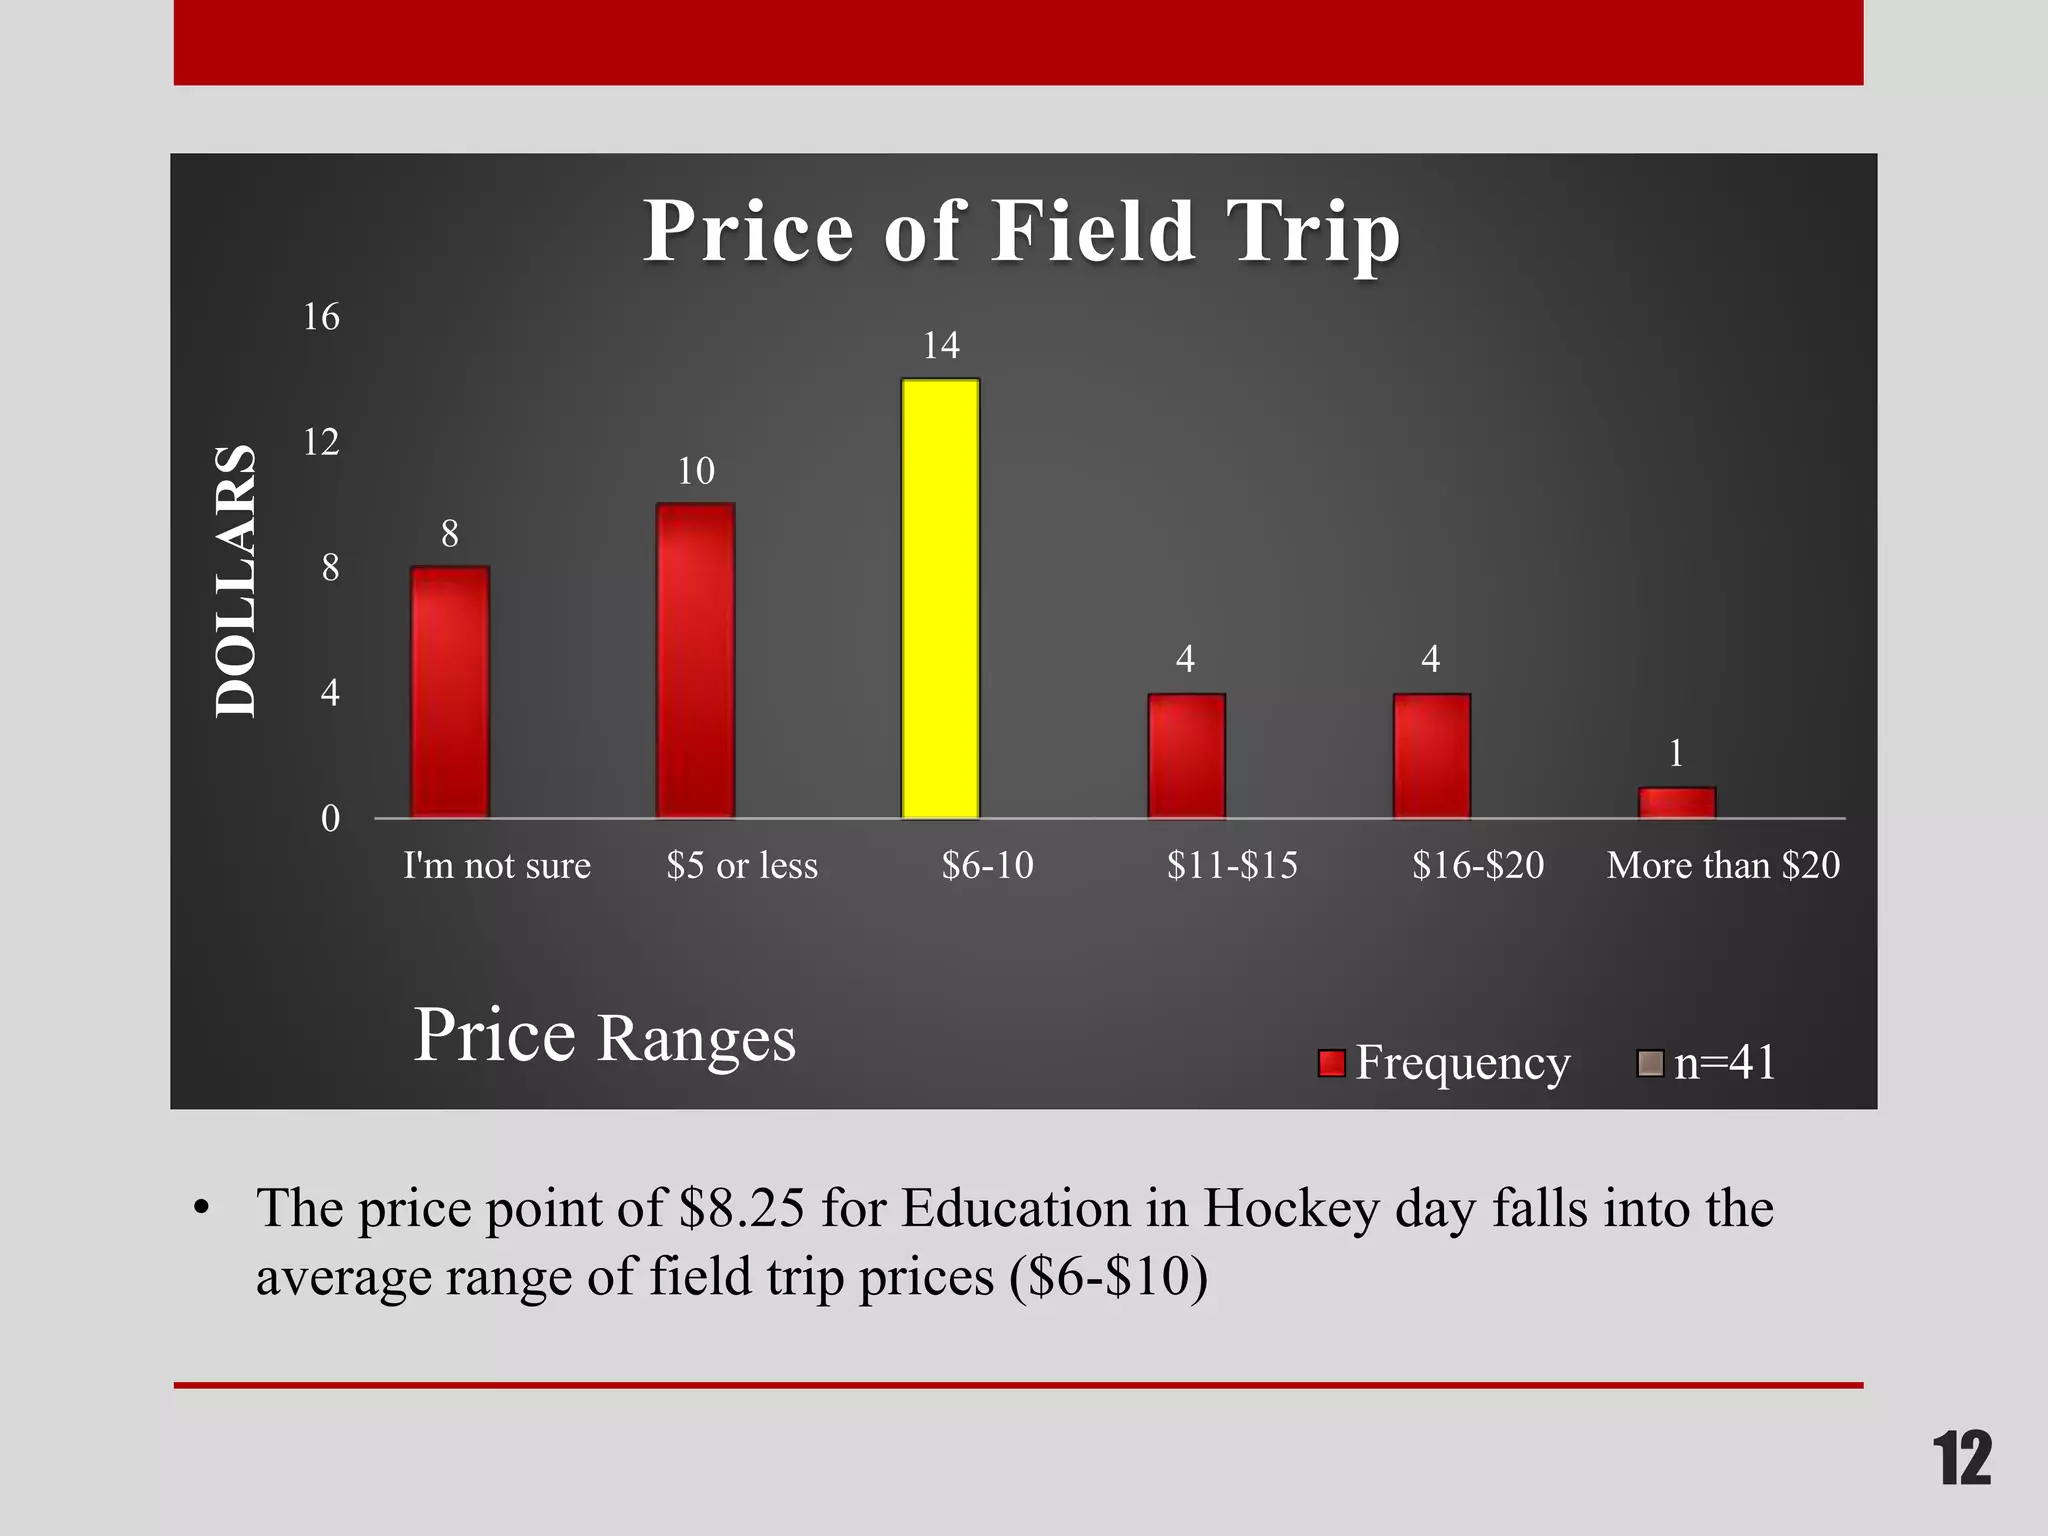
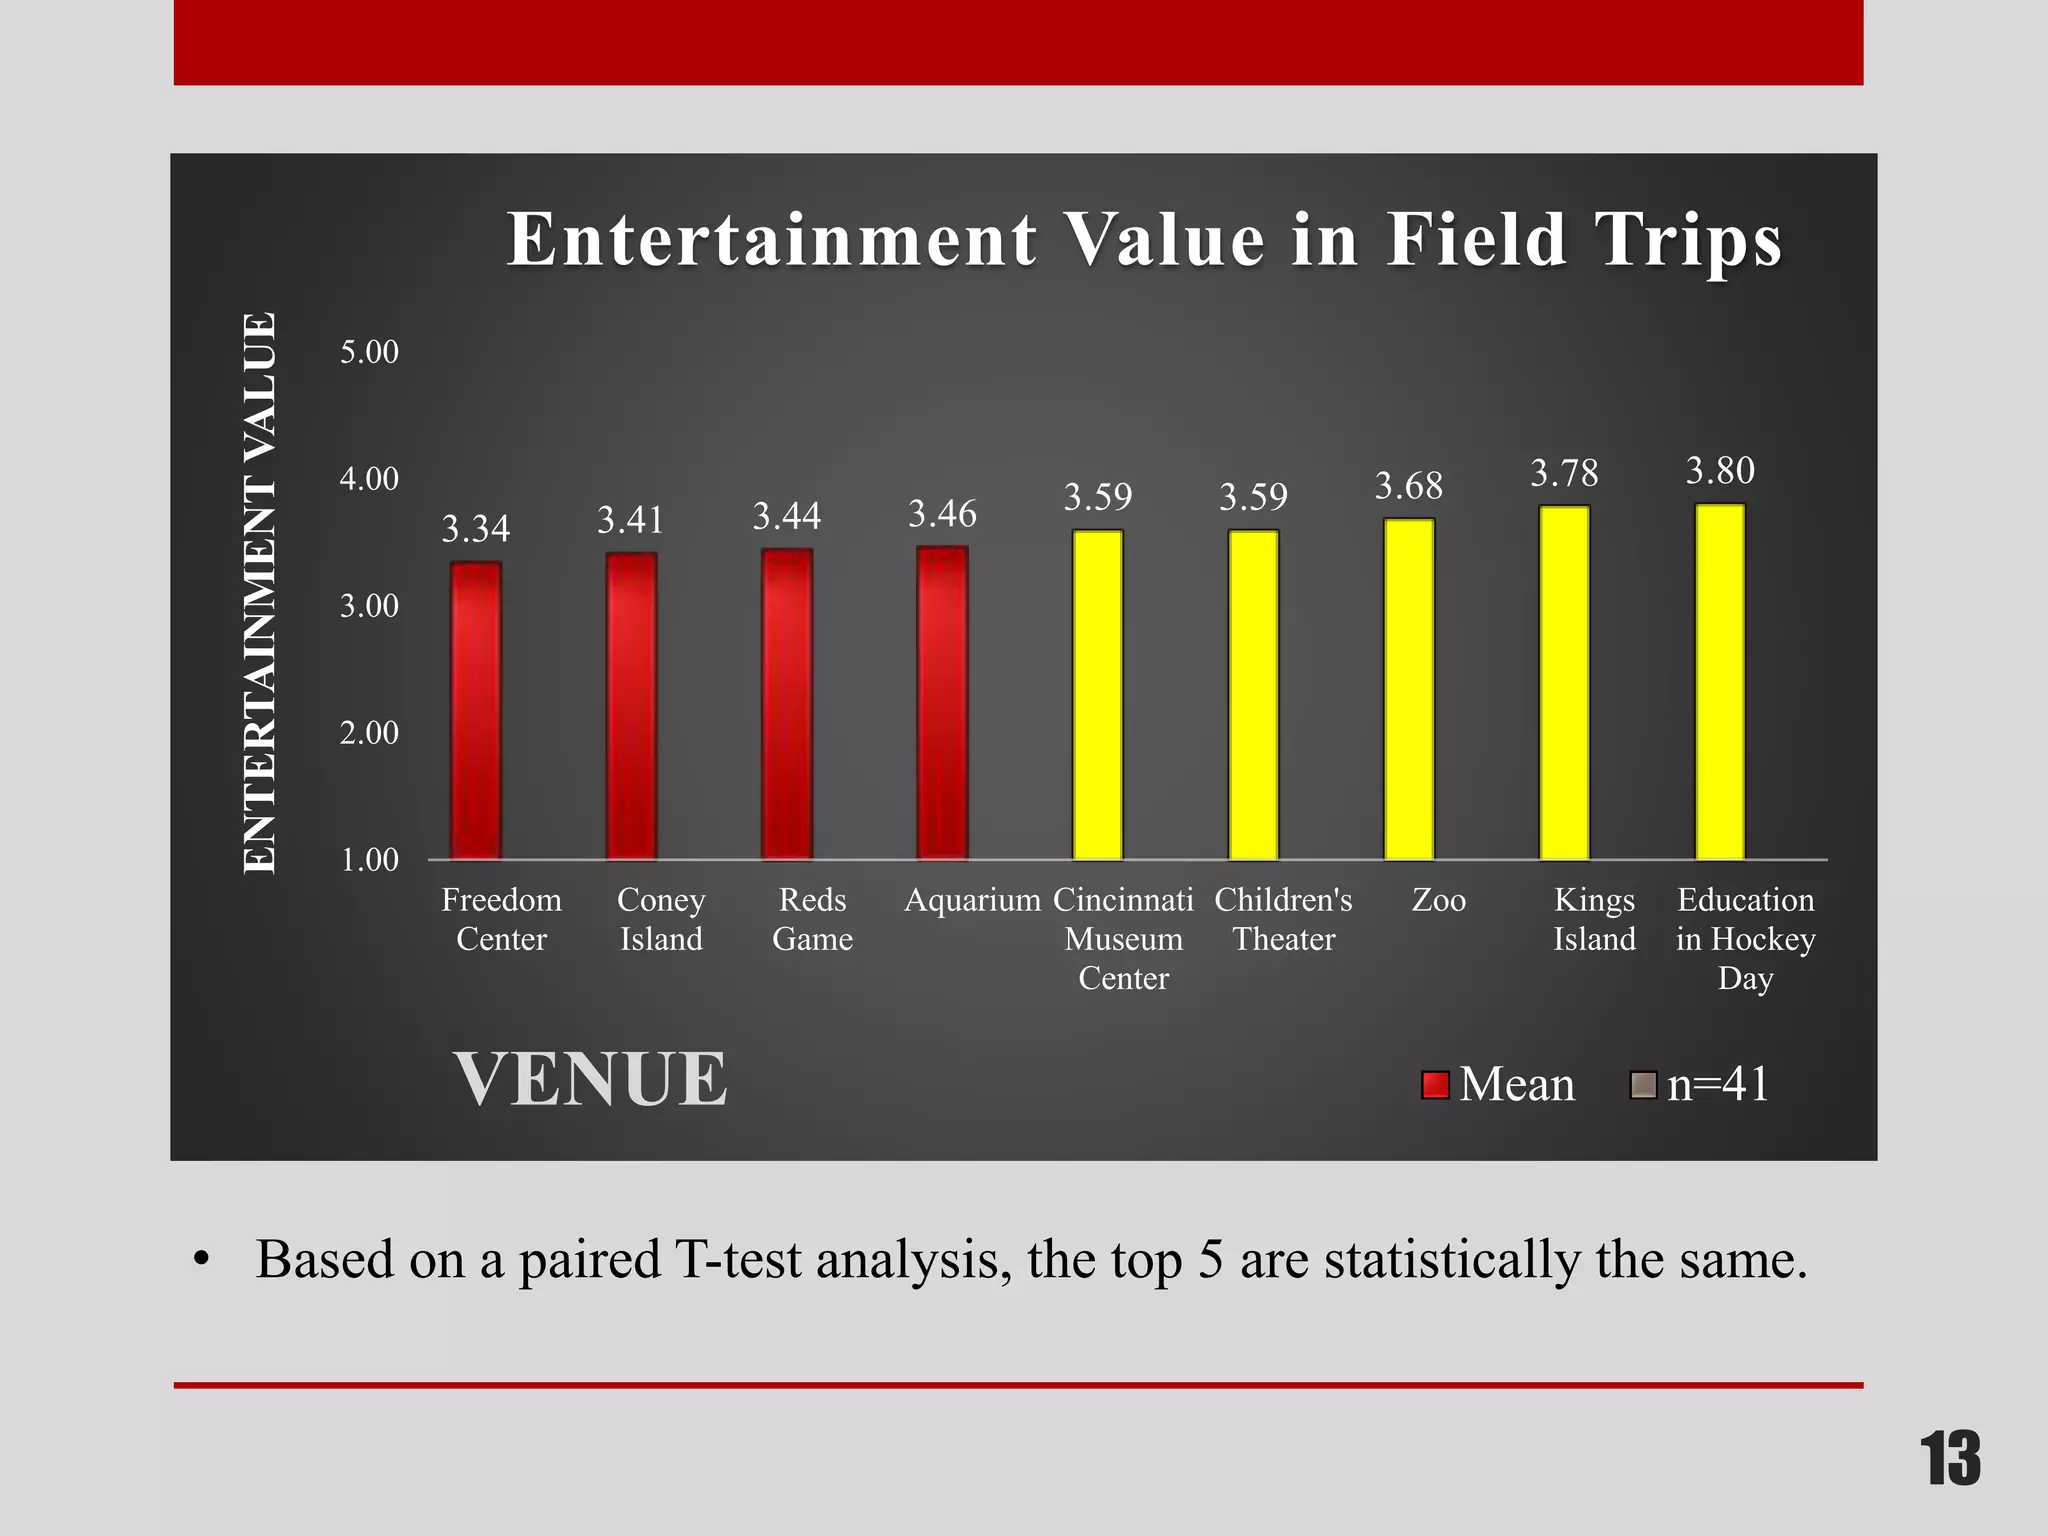
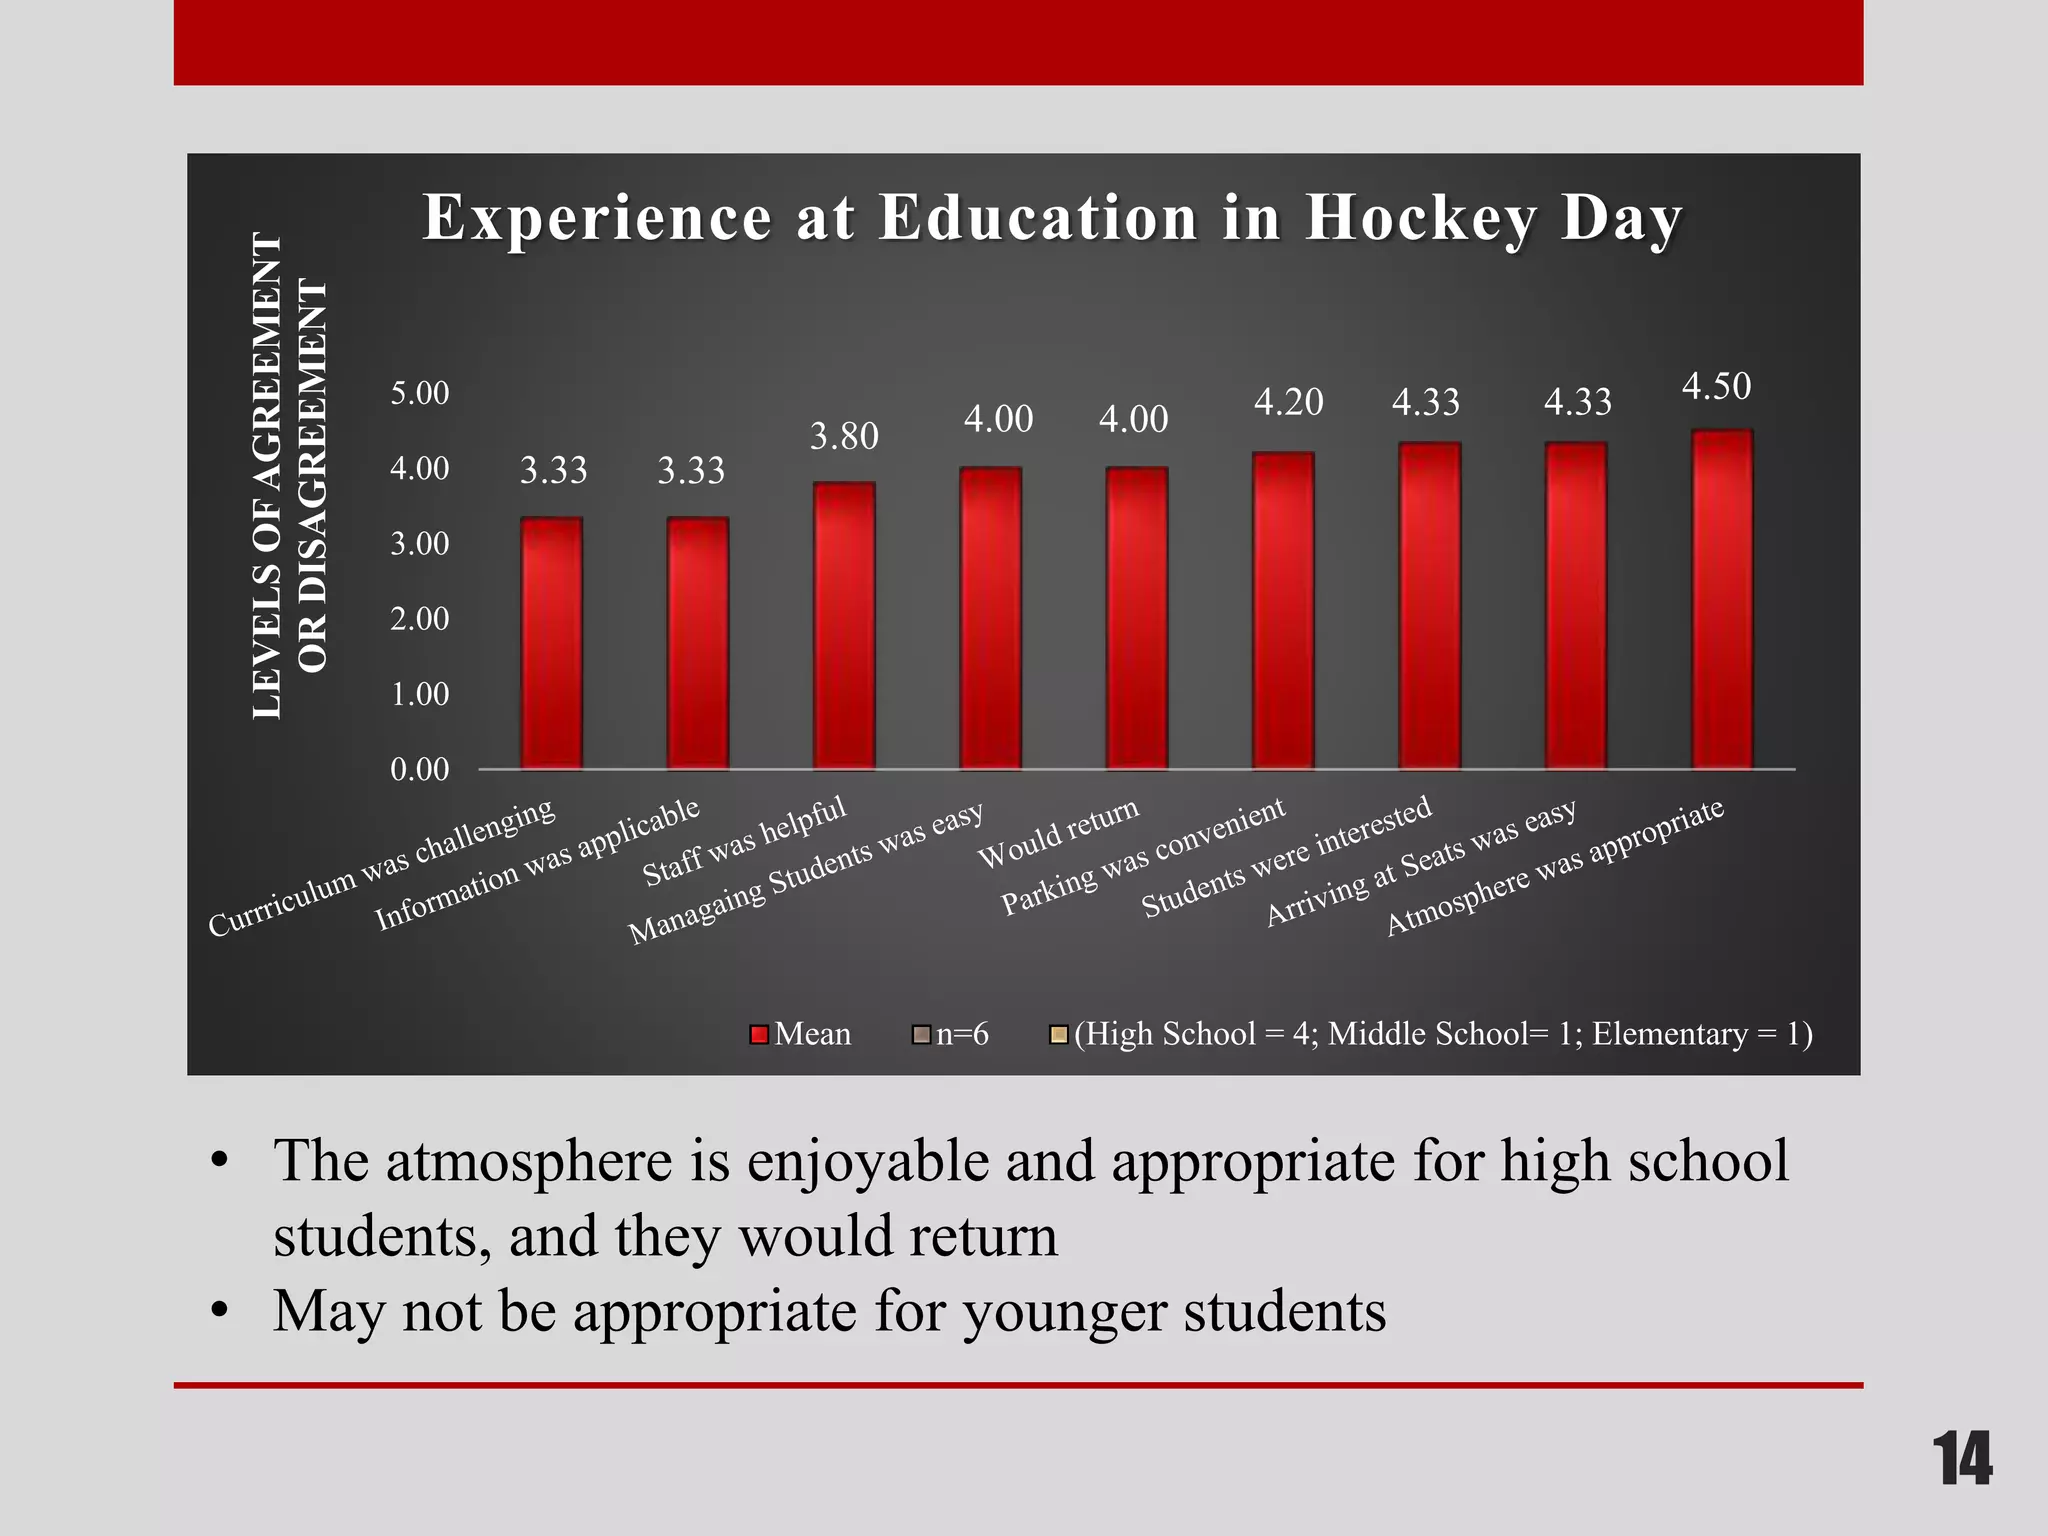
Education in Hockey
Marketing Plan
F.A.S.T Group Project
1
Matthew Bayer
Matthew Beck
Antwan Owens
Daniel Watkins
Rocky Worley
Mission Statement:
Increase fan affinity, utilizing the escalator concept, by raising
awareness and attendance of the “Education in Hockey Day”
2
Our Approach
• Develop student and teacher survey
• Distribute surveys to current/potential educators
• Collect and analyze data
• Make recommendations
3
Demographics of
Survey Respondents
• Teacher (40)
• Principal or Assistant Principle (1)
• Other School Administrator (1)
• Other (Please Specify) (6)
• None of the Above (3)
• Female (27) (67.5%)
• Male (13) (32.5%)
4
5
2
3
8
14
24
0
5
10
15
20
25
30
FREQUENCY
GRADE LEVEL
Type of School (n=51)
ElemNo Data
K-12
Middle High
• The majority of respondents came from high school educators
Awareness & Previous Attendance
6
43.2
56.8
0
20
40
60
80
100
PERCENTAGE
Were you aware that
Cincinnati Cyclones hosts an
annual Education in Hockey
Day?
yes no
31.6
68.4
0
20
40
60
80
100
PERCENTAGE
Have you attended Education in
Hockey Day in past?
yes no n=19n=44
• Low previous attendants results from low awareness of the event
Branding
Survey Question: If you were to guess, what do you think
would take place at the ‘Education in Hockey Day’?
Some respondents answered (n=51):
“ History of Hockey?”
“The history of how hockey began?”
“Hockey influence on the culture?”
“How hockey was invented, and cultural contributions”
7
8
33.3
20.8
4.2 2.1 4.2
20.8
12.5
2.1
0
20
40
60
80
100
1-2 3-4 5-8 9-12 Annual I don't
know
Don't take
trips
Other
PERCENTAGE
MONTHS IN ADVANCE
Field Trip Planning
• Most educators plan field trips 1-4 months in advance
• Plan to send correspondence prior to the 4 month window
n=44
9
2.3 2.3 2.3 2.3 2.3
6.8
29.5
56.8
0
20
40
60
80
100
PERCENTAGEOF
RESPONDENTS
FACTORS
Factors Influencing Field Trips
n=41
• Teachers value educational content and affordability when
planning field trips
10
2.10 2.26
2.64
3.26
3.50 3.55 3.62 3.74 3.79
0.00
1.00
2.00
3.00
4.00
5.00
EDUCATIONALVALUE
VENUE
Educational Value of Field Trips
Mean n=42
• Mathematically, the Aquarium, Children’s Theater, and the Education
in Hockey Day are different, but based on an analysis of paired T-
tests, they are statistically the same.
11
3.00
3.40
3.67
0.00
1.00
2.00
3.00
4.00
5.00
Take Hoime DVD Worksheet In-game Videos
EFFECTIVENESSOFMATERIAL
TYPE OF MATERIAL
Effectiveness of Materials at Education
in Hockey Day
mean n =6
• The in-game videos are the most effective educational material
• Develop grade-appropriate material for each level of student
(elementary, middle, high school)
12
8
10
14
4 4
1
0
4
8
12
16
I'm not sure $5 or less $6-10 $11-$15 $16-$20 More than $20
DOLLARS Price of Field Trip
Frequency n=41Price Ranges
• The price point of $8.25 for Education in Hockey day falls into the
average range of field trip prices ($6-$10)
13
3.34 3.41 3.44 3.46 3.59 3.59 3.68 3.78 3.80
1.00
2.00
3.00
4.00
5.00
Freedom
Center
Coney
Island
Reds
Game
Aquarium Cincinnati
Museum
Center
Children's
Theater
Zoo Kings
Island
Education
in Hockey
Day
ENTERTAINMENTVALUE
VENUE
Entertainment Value in Field Trips
Mean n=41
• Based on a paired T-test analysis, the top 5 are statistically the same.
14
3.33 3.33
3.80 4.00 4.00 4.20 4.33 4.33 4.50
0.00
1.00
2.00
3.00
4.00
5.00
LEVELSOFAGREEMENT
ORDISAGREEMENT
Experience at Education in Hockey Day
Mean n=6 (High School = 4; Middle School= 1; Elementary = 1)
• The atmosphere is enjoyable and appropriate for high school
students, and they would return
• May not be appropriate for younger students
Final Conclusions
• Branding: The ‘Education In Hockey Day’ is not clear to all
educators, we believe this is due to the title of the event.
• The preferred planning time for school field trips is 1-4 months prior
to events.
• Curriculum may not be appropriate for each grade level. (4 of the 6
respondents that had attended the event were high school educators)
• Price point of $8.25 is appropriate
• By building on the awareness and attendance generated in this
project, we hope to move these new student/fans from the first level
of the escalator concept, to the second, through the use of promotions
15
Final Recommendations
• We recommend renaming the event “Education
Through Hockey”
• Revise and further develop the contact database to
reach a broader audience
• Develop grade-appropriate material utilizing
sponsors and promotions to encourage future
attendance (See example workbook)
16
17
We would like to take this
time to thank you for the
opportunity to work with the
Cincinnati Cyclones!

Cyclone final group project presentation

  • 1.
    Education in Hockey MarketingPlan F.A.S.T Group Project 1 Matthew Bayer Matthew Beck Antwan Owens Daniel Watkins Rocky Worley
  • 2.
    Mission Statement: Increase fanaffinity, utilizing the escalator concept, by raising awareness and attendance of the “Education in Hockey Day” 2
  • 3.
    Our Approach • Developstudent and teacher survey • Distribute surveys to current/potential educators • Collect and analyze data • Make recommendations 3
  • 4.
    Demographics of Survey Respondents •Teacher (40) • Principal or Assistant Principle (1) • Other School Administrator (1) • Other (Please Specify) (6) • None of the Above (3) • Female (27) (67.5%) • Male (13) (32.5%) 4
  • 5.
    5 2 3 8 14 24 0 5 10 15 20 25 30 FREQUENCY GRADE LEVEL Type ofSchool (n=51) ElemNo Data K-12 Middle High • The majority of respondents came from high school educators
  • 6.
    Awareness & PreviousAttendance 6 43.2 56.8 0 20 40 60 80 100 PERCENTAGE Were you aware that Cincinnati Cyclones hosts an annual Education in Hockey Day? yes no 31.6 68.4 0 20 40 60 80 100 PERCENTAGE Have you attended Education in Hockey Day in past? yes no n=19n=44 • Low previous attendants results from low awareness of the event
  • 7.
    Branding Survey Question: Ifyou were to guess, what do you think would take place at the ‘Education in Hockey Day’? Some respondents answered (n=51): “ History of Hockey?” “The history of how hockey began?” “Hockey influence on the culture?” “How hockey was invented, and cultural contributions” 7
  • 8.
    8 33.3 20.8 4.2 2.1 4.2 20.8 12.5 2.1 0 20 40 60 80 100 1-23-4 5-8 9-12 Annual I don't know Don't take trips Other PERCENTAGE MONTHS IN ADVANCE Field Trip Planning • Most educators plan field trips 1-4 months in advance • Plan to send correspondence prior to the 4 month window n=44
  • 9.
    9 2.3 2.3 2.32.3 2.3 6.8 29.5 56.8 0 20 40 60 80 100 PERCENTAGEOF RESPONDENTS FACTORS Factors Influencing Field Trips n=41 • Teachers value educational content and affordability when planning field trips
  • 10.
    10 2.10 2.26 2.64 3.26 3.50 3.553.62 3.74 3.79 0.00 1.00 2.00 3.00 4.00 5.00 EDUCATIONALVALUE VENUE Educational Value of Field Trips Mean n=42 • Mathematically, the Aquarium, Children’s Theater, and the Education in Hockey Day are different, but based on an analysis of paired T- tests, they are statistically the same.
  • 11.
    11 3.00 3.40 3.67 0.00 1.00 2.00 3.00 4.00 5.00 Take Hoime DVDWorksheet In-game Videos EFFECTIVENESSOFMATERIAL TYPE OF MATERIAL Effectiveness of Materials at Education in Hockey Day mean n =6 • The in-game videos are the most effective educational material • Develop grade-appropriate material for each level of student (elementary, middle, high school)
  • 12.
    12 8 10 14 4 4 1 0 4 8 12 16 I'm notsure $5 or less $6-10 $11-$15 $16-$20 More than $20 DOLLARS Price of Field Trip Frequency n=41Price Ranges • The price point of $8.25 for Education in Hockey day falls into the average range of field trip prices ($6-$10)
  • 13.
    13 3.34 3.41 3.443.46 3.59 3.59 3.68 3.78 3.80 1.00 2.00 3.00 4.00 5.00 Freedom Center Coney Island Reds Game Aquarium Cincinnati Museum Center Children's Theater Zoo Kings Island Education in Hockey Day ENTERTAINMENTVALUE VENUE Entertainment Value in Field Trips Mean n=41 • Based on a paired T-test analysis, the top 5 are statistically the same.
  • 14.
    14 3.33 3.33 3.80 4.004.00 4.20 4.33 4.33 4.50 0.00 1.00 2.00 3.00 4.00 5.00 LEVELSOFAGREEMENT ORDISAGREEMENT Experience at Education in Hockey Day Mean n=6 (High School = 4; Middle School= 1; Elementary = 1) • The atmosphere is enjoyable and appropriate for high school students, and they would return • May not be appropriate for younger students
  • 15.
    Final Conclusions • Branding:The ‘Education In Hockey Day’ is not clear to all educators, we believe this is due to the title of the event. • The preferred planning time for school field trips is 1-4 months prior to events. • Curriculum may not be appropriate for each grade level. (4 of the 6 respondents that had attended the event were high school educators) • Price point of $8.25 is appropriate • By building on the awareness and attendance generated in this project, we hope to move these new student/fans from the first level of the escalator concept, to the second, through the use of promotions 15
  • 16.
    Final Recommendations • Werecommend renaming the event “Education Through Hockey” • Revise and further develop the contact database to reach a broader audience • Develop grade-appropriate material utilizing sponsors and promotions to encourage future attendance (See example workbook) 16
  • 17.
    17 We would liketo take this time to thank you for the opportunity to work with the Cincinnati Cyclones!

Editor's Notes

  • #6 Received the most responses from high school educators.
  • #11 Definition: A statistically significant t-test result is one in which a difference between two groups is unlikely to have occurred because the sample happened to be atypical. Statistical significance is determined by the size of the difference between the group averages, the sample size, and the standard deviations of the groups. For practical purposes statistical significance suggests that the two larger populations from which we sample are “actually” different.
  • #14 Definition: A statistically significant t-test result is one in which a difference between two groups is unlikely to have occurred because the sample happened to be atypical. Statistical significance is determined by the size of the difference between the group averages, the sample size, and the standard deviations of the groups. For practical purposes statistical significance suggests that the two larger populations from which we sample are “actually” different.
  • #18 Thank you slide