More Related Content
Similar to Michigan State Bridge Profile
Similar to Michigan State Bridge Profile (15)
Michigan State Bridge Profile
- 1. © 2014 The American Road & Transportation Builders Association (ARTBA). All rights reserved. No part of this document may be reproduced or
transmitted in any form or by any means, electronic, mechanical, photocopying, recording, or otherwise, without prior written permission of
ARTBA.
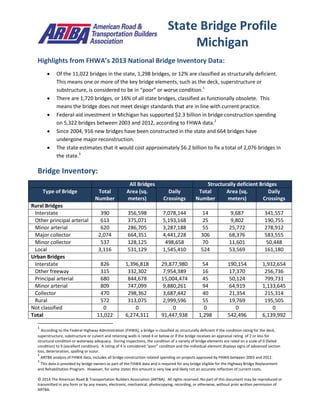
Highlights from FHWA’s 2013 National Bridge Inventory Data:
Of the 11,022 bridges in the state, 1,298 bridges, or 12% are classified as structurally deficient.
This means one or more of the key bridge elements, such as the deck, superstructure or
substructure, is considered to be in “poor” or worse condition.1
There are 1,720 bridges, or 16% of all state bridges, classified as functionally obsolete. This
means the bridge does not meet design standards that are in line with current practice.
Federal-aid investment in Michigan has supported $2.3 billion in bridge construction spending
on 5,322 bridges between 2003 and 2012, according to FHWA data.2
Since 2004, 916 new bridges have been constructed in the state and 664 bridges have
undergone major reconstruction.
The state estimates that it would cost approximately $6.2 billion to fix a total of 2,076 bridges in
the state.3
Bridge Inventory:
All Bridges Structurally deficient Bridges
Type of Bridge Total
Number
Area (sq.
meters)
Daily
Crossings
Total
Number
Area (sq.
meters)
Daily
Crossings
Rural Bridges
Interstate 390 356,598 7,078,144 14 9,687 341,557
Other principal arterial 613 375,071 5,193,168 25 9,802 190,755
Minor arterial 620 286,705 3,287,188 55 25,772 278,912
Major collector 2,074 664,351 4,441,228 306 68,376 583,555
Minor collector 537 128,125 498,658 70 11,601 50,448
Local 3,116 531,129 1,545,410 524 53,569 161,180
Urban Bridges
Interstate 826 1,396,818 29,877,980 54 190,154 1,932,654
Other freeway 315 332,302 7,954,389 16 17,370 256,736
Principal arterial 680 844,678 15,004,474 45 50,124 799,731
Minor arterial 809 747,099 9,880,261 94 64,919 1,133,645
Collector 470 298,362 3,687,442 40 21,354 215,314
Local 572 313,075 2,999,596 55 19,769 195,505
Not classified 0 0 0 0 0 0
Total 11,022 6,274,311 91,447,938 1,298 542,496 6,139,992
1
According to the Federal Highway Administration (FHWA), a bridge is classified as structurally deficient if the condition rating for the deck,
superstructure, substructure or culvert and retaining walls is rated 4 or below or if the bridge receives an appraisal rating of 2 or less for
structural condition or waterway adequacy. During inspections, the condition of a variety of bridge elements are rated on a scale of 0 (failed
condition) to 9 (excellent condition). A rating of 4 is considered “poor” condition and the individual element displays signs of advanced section
loss, deterioration, spalling or scour.
2
ARTBA analysis of FHWA data, includes all bridge construction related spending on projects approved by FHWA between 2003 and 2012.
3
This data is provided by bridge owners as part of the FHWA data and is required for any bridge eligible for the Highway Bridge Replacement
and Rehabilitation Program. However, for some states this amount is very low and likely not an accurate reflection of current costs.
State Bridge Profile
Michigan
- 2. © 2014 The American Road & Transportation Builders Association (ARTBA). All rights reserved. No part of this document may be reproduced or
transmitted in any form or by any means, electronic, mechanical, photocopying, recording, or otherwise, without prior written permission of
ARTBA.
Proposed bridge work:
Type of Work Number Cost (millions) Daily Crossings Area (sq. meters)
Bridge replacement 795 $4,383.8 2,072,555 156,017
Widening & rehabilitation 78 $35.9 1,296,269 44,497
Rehabilitation 178 $722.1 774,033 75,355
Deck rehabilitation/replacement 830 $949.9 10,456,793 837,554
Other work 195 $91.2 431,674 82,194
Top 10 Most Traveled Structurally Deficient Bridges in the State
County Year
Built
Daily
Crossings
Type of Bridge Location
(route/water under the bridge, traffic on the bridge and location)
Wayne 1954 146,000 Urban minor
arterial
I-94, SECOND BLVD, IN DETROIT
Wayne 1953 119,000 Urban Interstate OPEN AREA, I-94 TO W GR BLV R, IN DETROIT
Wayne 1967 100,492 Urban Interstate ROUGE R DEARBORN ST & RR, I-75, IN DETROIT
Genesee 1971 95,314 Urban Interstate M-54 (DORT HWY), I-69, IN FLINT
Macomb 1994 87,420 Urban other
principal arterial
M-53, M-59 WB, M-59 WB OV M-53
Genesee 1954 66,912 Urban Interstate SWARTZ CREEK, I-75, N OF I-69 @ INTERCHG
Oakland 1964 65,985 Urban Interstate M-150 (ROCHESTER RD.), I-75 SB, IN TROY
Wayne 1962 65,737 Urban Interstate ECORSE RD, I-94 WB, IN TAYLOR OVER ECORSE RD
Jackson 1949 64,800 Urban Interstate CONRAIL & GRAND RIVER, I-94, 0.4 MI W OF M-106
Genesee 1971 59,000 Urban Interstate ATHERTON RD, I-475, IN FLINT
Sources: All data is from the 2013 National Bridge Inventory, released by the Federal Highway Administration in March 2014.
Note that specific conditions on bridge may have changed as a result of recent work. Cost estimates of bridge work provided as
part of the data and have been adjusted to 2013$ for inflation and estimated project costs. Contract awards data is for state
and local government awards and comes from McGraw Hill. Note that additional bridge investment may be a part of other
contract awards if a smaller bridge project is included with a highway project, and that would not be accounted for in the total
in this profile.