More Related Content
Similar to North Dakota State Bridge Profile
Similar to North Dakota State Bridge Profile (16)
North Dakota State Bridge Profile
- 1. © 2014 The American Road & Transportation Builders Association (ARTBA). All rights reserved. No part of this document may be reproduced or
transmitted in any form or by any means, electronic, mechanical, photocopying, recording, or otherwise, without prior written permission of
ARTBA.
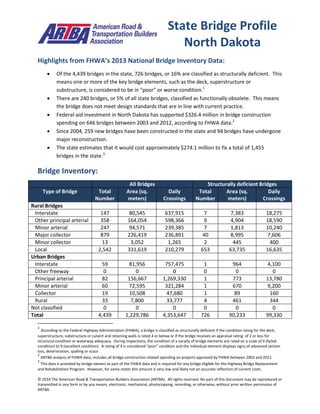
Highlights from FHWA’s 2013 National Bridge Inventory Data:
Of the 4,439 bridges in the state, 726 bridges, or 16% are classified as structurally deficient. This
means one or more of the key bridge elements, such as the deck, superstructure or
substructure, is considered to be in “poor” or worse condition.1
There are 240 bridges, or 5% of all state bridges, classified as functionally obsolete. This means
the bridge does not meet design standards that are in line with current practice.
Federal-aid investment in North Dakota has supported $326.4 million in bridge construction
spending on 646 bridges between 2003 and 2012, according to FHWA data.2
Since 2004, 259 new bridges have been constructed in the state and 94 bridges have undergone
major reconstruction.
The state estimates that it would cost approximately $274.1 million to fix a total of 1,455
bridges in the state.3
Bridge Inventory:
All Bridges Structurally deficient Bridges
Type of Bridge Total
Number
Area (sq.
meters)
Daily
Crossings
Total
Number
Area (sq.
meters)
Daily
Crossings
Rural Bridges
Interstate 147 80,545 637,915 7 7,383 18,275
Other principal arterial 358 164,054 598,366 9 4,904 18,590
Minor arterial 247 94,571 239,385 7 1,813 10,240
Major collector 879 226,419 236,891 40 8,995 7,606
Minor collector 13 3,052 1,265 2 445 400
Local 2,542 331,619 210,279 653 63,735 16,635
Urban Bridges
Interstate 59 81,956 757,475 1 964 4,100
Other freeway 0 0 0 0 0 0
Principal arterial 82 156,667 1,269,330 1 773 13,780
Minor arterial 60 72,595 321,284 1 670 9,200
Collector 19 10,508 47,680 1 89 160
Local 33 7,800 33,777 4 461 344
Not classified 0 0 0 0 0 0
Total 4,439 1,229,786 4,353,647 726 90,233 99,330
1
According to the Federal Highway Administration (FHWA), a bridge is classified as structurally deficient if the condition rating for the deck,
superstructure, substructure or culvert and retaining walls is rated 4 or below or if the bridge receives an appraisal rating of 2 or less for
structural condition or waterway adequacy. During inspections, the condition of a variety of bridge elements are rated on a scale of 0 (failed
condition) to 9 (excellent condition). A rating of 4 is considered “poor” condition and the individual element displays signs of advanced section
loss, deterioration, spalling or scour.
2
ARTBA analysis of FHWA data, includes all bridge construction related spending on projects approved by FHWA between 2003 and 2012.
3
This data is provided by bridge owners as part of the FHWA data and is required for any bridge eligible for the Highway Bridge Replacement
and Rehabilitation Program. However, for some states this amount is very low and likely not an accurate reflection of current costs.
State Bridge Profile
North Dakota
- 2. © 2014 The American Road & Transportation Builders Association (ARTBA). All rights reserved. No part of this document may be reproduced or
transmitted in any form or by any means, electronic, mechanical, photocopying, recording, or otherwise, without prior written permission of
ARTBA.
Proposed bridge work:
Type of Work Number Cost (millions) Daily Crossings Area (sq. meters)
Bridge replacement 645 $155.9 40,538 90,883
Widening & rehabilitation 443 $72.8 151,896 90,786
Rehabilitation 285 $25.7 235,533 65,838
Deck rehabilitation/replacement 23 $5.2 73,205 22,029
Other work 59 $14.5 93,501 31,626
Top 10 Most Traveled Structurally Deficient Bridges in the State
County Year
Built
Daily
Crossings
Type of Bridge Location
(route/water under the bridge, traffic on the bridge and location)
Cass 1938 13,780 Urban other
principal arterial
SHEYENNE RIVER, US HIGHWAY 10, IN WEST FARGO
Ward 1940 9,200 Urban minor
arterial
MOUSE RIVER, 4TH AVE N.W., 4TH AVE-16TH ST NW-MINOT
Grand
Forks
1928 5,400 Rural arterial SALTWATER COULEE, US HIGHWAY 2, 8 WEST OF I-29
Williams 1970 5,000 Rural minor
arterial
BEAVER CREEK, ND HIGHWAY 1804, 31 EAST OF WILLISTON
Traill 1969 4,550 Rural Interstate BNRR SEPARATION, INTERSTATE 29, 3 NORTH OF ND 200
Stutsman 1958 4,100 Urban Interstate BNRR & SE JAMESTOWN INT, INTERSTATE 94, SE JAMESTOWN
INTERCHANGE
Richland 1973 3,200 Rural arterial I-29/MOORETON INT, ND HIGHWAY 13, JUNCTION OF ND 13
Richland 1973 3,200 Rural arterial I-29/MOORETON INT, ND HIGHWAY 13, JUNCTION OF ND 13
Stark 1963 2,700 Rural Interstate GREEN RIVER, INTERSTATE 94, 9 EAST OF JCT. 22
Cass 1960 2,650 Rural minor
arterial
I-94/CASSELTON INT, ND HIGHWAY 18, JUNCTION OF ND 18
Sources: All data is from the 2013 National Bridge Inventory, released by the Federal Highway Administration in March 2014.
Note that specific conditions on bridge may have changed as a result of recent work. Cost estimates of bridge work provided as
part of the data and have been adjusted to 2013$ for inflation and estimated project costs. Contract awards data is for state
and local government awards and comes from McGraw Hill. Note that additional bridge investment may be a part of other
contract awards if a smaller bridge project is included with a highway project, and that would not be accounted for in the total
in this profile.