More Related Content
Similar to Idaho State Bridge Profile
Similar to Idaho State Bridge Profile (19)
Idaho State Bridge Profile
- 1. © 2014 The American Road & Transportation Builders Association (ARTBA). All rights reserved. No part of this document may be reproduced or
transmitted in any form or by any means, electronic, mechanical, photocopying, recording, or otherwise, without prior written permission of
ARTBA.
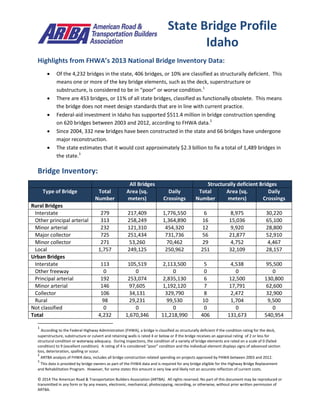
Highlights from FHWA’s 2013 National Bridge Inventory Data:
Of the 4,232 bridges in the state, 406 bridges, or 10% are classified as structurally deficient. This
means one or more of the key bridge elements, such as the deck, superstructure or
substructure, is considered to be in “poor” or worse condition.1
There are 453 bridges, or 11% of all state bridges, classified as functionally obsolete. This means
the bridge does not meet design standards that are in line with current practice.
Federal-aid investment in Idaho has supported $511.4 million in bridge construction spending
on 620 bridges between 2003 and 2012, according to FHWA data.2
Since 2004, 332 new bridges have been constructed in the state and 66 bridges have undergone
major reconstruction.
The state estimates that it would cost approximately $2.3 billion to fix a total of 1,489 bridges in
the state.3
Bridge Inventory:
All Bridges Structurally deficient Bridges
Type of Bridge Total
Number
Area (sq.
meters)
Daily
Crossings
Total
Number
Area (sq.
meters)
Daily
Crossings
Rural Bridges
Interstate 279 217,409 1,776,550 6 8,975 30,220
Other principal arterial 313 258,249 1,364,890 16 15,036 65,100
Minor arterial 232 121,310 454,320 12 9,920 28,800
Major collector 725 251,434 731,736 56 21,877 52,910
Minor collector 271 53,260 70,462 29 4,752 4,467
Local 1,757 249,125 250,962 251 32,109 28,157
Urban Bridges
Interstate 113 105,519 2,113,500 5 4,538 95,500
Other freeway 0 0 0 0 0 0
Principal arterial 192 253,074 2,835,130 6 12,500 130,800
Minor arterial 146 97,605 1,192,120 7 17,791 62,600
Collector 106 34,131 329,790 8 2,472 32,900
Local 98 29,231 99,530 10 1,704 9,500
Not classified 0 0 0 0 0 0
Total 4,232 1,670,346 11,218,990 406 131,673 540,954
1
According to the Federal Highway Administration (FHWA), a bridge is classified as structurally deficient if the condition rating for the deck,
superstructure, substructure or culvert and retaining walls is rated 4 or below or if the bridge receives an appraisal rating of 2 or less for
structural condition or waterway adequacy. During inspections, the condition of a variety of bridge elements are rated on a scale of 0 (failed
condition) to 9 (excellent condition). A rating of 4 is considered “poor” condition and the individual element displays signs of advanced section
loss, deterioration, spalling or scour.
2
ARTBA analysis of FHWA data, includes all bridge construction related spending on projects approved by FHWA between 2003 and 2012.
3
This data is provided by bridge owners as part of the FHWA data and is required for any bridge eligible for the Highway Bridge Replacement
and Rehabilitation Program. However, for some states this amount is very low and likely not an accurate reflection of current costs.
State Bridge Profile
Idaho
- 2. © 2014 The American Road & Transportation Builders Association (ARTBA). All rights reserved. No part of this document may be reproduced or
transmitted in any form or by any means, electronic, mechanical, photocopying, recording, or otherwise, without prior written permission of
ARTBA.
Proposed bridge work:
Type of Work Number Cost (millions) Daily Crossings Area (sq. meters)
Bridge replacement 1,380 $2,137.1 2,907,336 548,327
Widening & rehabilitation 69 $74.7 302,809 34,692
Rehabilitation 23 $28.7 61,920 21,283
Deck rehabilitation/replacement 10 $10.5 91,560 14,534
Other work 7 $5.2 54,950 3,874
Top 10 Most Traveled Structurally Deficient Bridges in the State
County Year
Built
Daily
Crossings
Type of Bridge Location
(route/water under the bridge, traffic on the bridge and location)
Ada 1965 39,000 Urban other
principal arterial
I 84;SH 69 MERIDIAN IC, SH 69, 1.0 S. MERIDIAN
Ada 1969 33,000 Urban other
principal arterial
I 84 EB-WB;BROADWAY IC, US 20, 0.7 SE. BOISE CITY LIMITS
Canyon 1966 30,500 Urban Interstate UPRR;EAST LATERAL CANAL, I 84 WBL, AT NAMPA WCL
Ada 1956 25,000 Urban other
principal arterial
BOISE RIVER(BROADWAY BR), US 20 ;I 84B, IN
BOISE;BROADWAY AVE
Bonneville 1957 23,000 Urban minor
arterial
SAND CREEK, SMA 7406;17TH ST, IN AMMON;17TH STREET
Nez Perce 1982 21,000 Urban minor
arterial
SNAKE RIVER;HIGH BRIDGE, BRYDEN CANYON ROAD, IN
LEWISTON;BRYDEN EXT
Ada 1969 18,500 Urban Interstate UPRR;GOWEN SPUR, I 84 EBL, 1.3 E. BOISE
Ada 1969 18,500 Urban Interstate UPRR;GOWEN SPUR, I 84 WBL, 1.3 E. BOISE
Bannock 1962 14,000 Urban Interstate I 86 EB RAMP, I 15 SBL, 2.9 N. POCATELLO
Bannock 1962 14,000 Urban Interstate I 86 WB RAMP, I 15 SBL, 2.7 N. POCATELLO
Sources: All data is from the 2013 National Bridge Inventory, released by the Federal Highway Administration in March 2014.
Note that specific conditions on bridge may have changed as a result of recent work. Cost estimates of bridge work provided as
part of the data and have been adjusted to 2013$ for inflation and estimated project costs. Contract awards data is for state
and local government awards and comes from McGraw Hill. Note that additional bridge investment may be a part of other
contract awards if a smaller bridge project is included with a highway project, and that would not be accounted for in the total
in this profile.