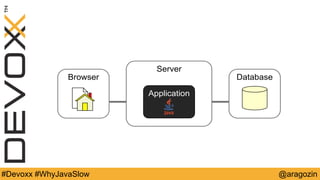
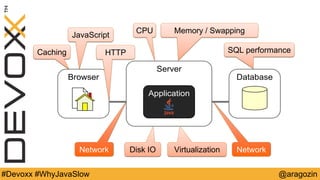
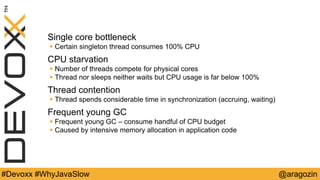
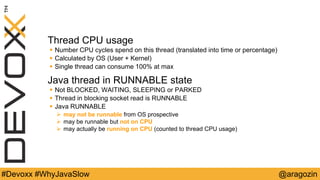
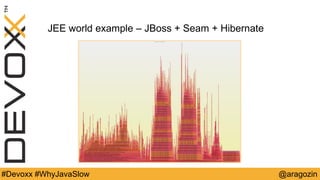
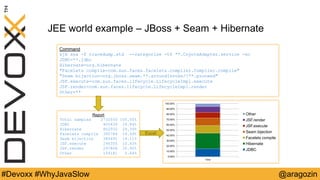
The document discusses performance issues that can arise in Java applications and strategies for identifying bottlenecks. It provides an overview of potential causes of slowness at the server, browser, application, and database levels. It also describes various profiling tools like JVisualVM, JProfiler, and SJK ttop that can help analyze thread CPU usage, memory usage, and garbage collection to diagnose specific problems like CPU hogs, thread contention, and full GC pauses. The document provides examples of how to profile applications built with JEE technologies like JBoss, Seam and Hibernate. It also lists JVM options for tuning garbage collection, particularly for the Concurrent Mark Sweep (CMS) and Garbage First (G1


![@aragozin#Devoxx #WhyJavaSlow
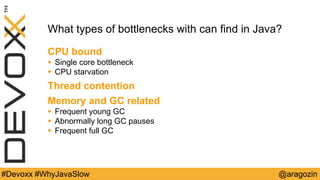
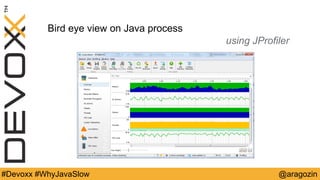
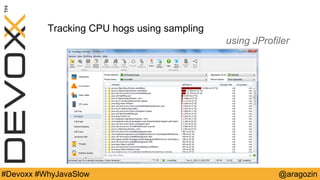
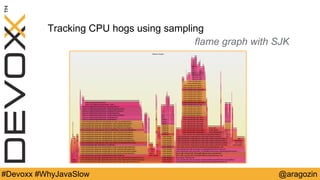
Bird eye view on Java process
using SJK ttop
> java –jar sjk.jar ttop -p 12345 -n 20 -o CPU
2016-11-07T00:09:50.091+0400 Process summary
process cpu=268.35%
application cpu=244.42% (user=222.50% sys=21.93%)
other: cpu=23.93%
GC cpu=6.28% (young=1.62%, old=4.66%)
heap allocation rate 1218mb/s
safe point rate: 1.5 (events/s) avg. safe point pause: 43.24ms
safe point sync time: 0.03% processing time: 6.39% (wallclock time)
[000056] user=17.45% sys= 0.62% alloc= 106mb/s - hz._hzInstance_2_dev.generic-operation.thread-0
[000094] user=17.76% sys= 0.31% alloc= 113mb/s - hz._hzInstance_3_dev.generic-operation.thread-1
[000093] user=16.83% sys= 0.00% alloc= 111mb/s - hz._hzInstance_3_dev.generic-operation.thread-0
[000020] user=16.06% sys= 0.15% alloc= 108mb/s - hz._hzInstance_1_dev.generic-operation.thread-0
[000021] user=15.44% sys= 0.15% alloc= 110mb/s - hz._hzInstance_1_dev.generic-operation.thread-1
[000057] user=14.36% sys= 0.00% alloc= 110mb/s - hz._hzInstance_2_dev.generic-operation.thread-1
[000105] user=13.59% sys= 0.00% alloc= 72mb/s - hz._hzInstance_3_dev.cached.thread-1
[000079] user=13.43% sys= 0.15% alloc= 67mb/s - hz._hzInstance_2_dev.cached.thread-3
[000042] user=10.96% sys= 0.62% alloc= 65mb/s - hz._hzInstance_1_dev.cached.thread-2
[000174] user=10.65% sys= 0.31% alloc= 66mb/s - hz._hzInstance_3_dev.cached.thread-7
[000123] user= 8.96% sys= 0.00% alloc= 55mb/s - hz._hzInstance_4_dev.response
[000129] user= 7.72% sys= 0.31% alloc= 21mb/s - hz._hzInstance_4_dev.generic-operation.thread-0
[000168] user= 6.95% sys= 0.62% alloc= 33mb/s - hz._hzInstance_1_dev.cached.thread-6
[000178] user= 7.57% sys= 0.00% alloc= 32mb/s - hz._hzInstance_2_dev.cached.thread-9
[000166] user= 6.48% sys= 0.46% alloc= 33mb/s - hz._hzInstance_1_dev.cached.thread-5
[000130] user= 6.02% sys= 0.62% alloc= 20mb/s - hz._hzInstance_4_dev.generic-operation.thread-1
[000181] user= 5.56% sys= 0.00% alloc= 34mb/s - hz._hzInstance_2_dev.cached.thread-12
[000014] user= 2.32% sys= 0.15% alloc= 7345kb/s - hz._hzInstance_1_dev.response
https://github.com/aragozin/jvm-tools](https://image.slidesharecdn.com/devox2016-whyjavaisslow-161107142635/85/I-know-why-your-Java-is-slow-12-320.jpg)


![Секреты сборки мусора в Java [DUMP-IT 2012]](https://cdn.slidesharecdn.com/ss_thumbnails/secretsofgarbagecollectioninjava-dump2012-120525130043-phpapp01-thumbnail.jpg?width=640&height=640&fit=bounds)


