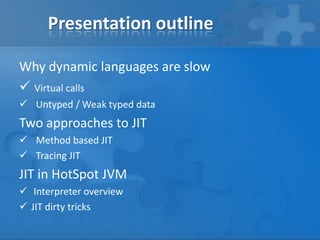
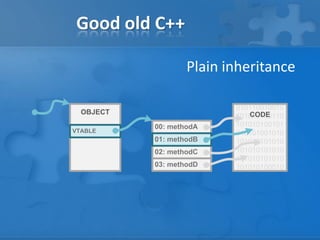
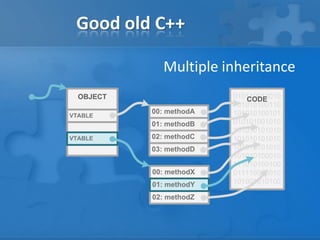
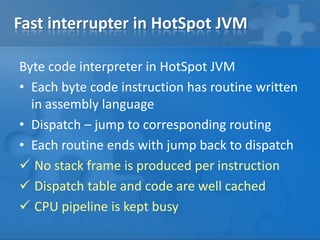
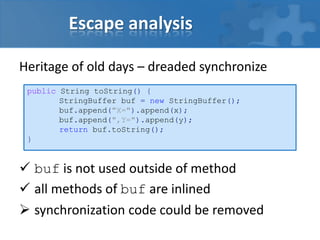
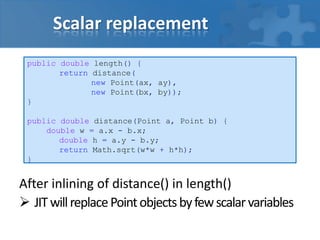
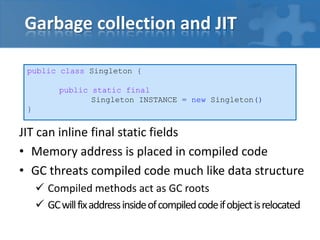
This document discusses just-in-time (JIT) compilation techniques in modern runtimes. It outlines two main approaches to JIT - method-based compilation and tracing JIT. It then describes specific techniques used in the HotSpot JVM, including its fast interpreter, two-tiered JIT compilation, runtime profiling, devirtualization, incremental compilation, on-stack replacement, escape analysis and scalar replacement. It also discusses how the garbage collector interacts with compiled code.


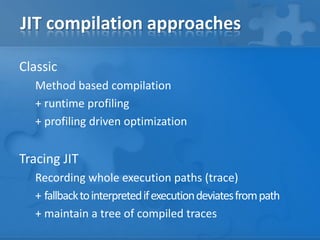

![Dynamic types problem
V8 – shadow classes
• Shadow classes are strongly typed
TraceMonkey – shape inference/property cache
• Inline caching in compiled code
LuaJIT – hash table access optimized trace
HREFK: if (hash[17].key != key) goto exit
HLOAD: x = hash[17].value
-or-
HSTORE: hash[17].value = x](https://image.slidesharecdn.com/openevent-jitandjvm-mar2014-140327154046-phpapp01/85/JIT-compilation-in-modern-platforms-challenges-and-solutions-15-320.jpg)


![Padding oracle [opkoko2011]](https://cdn.slidesharecdn.com/ss_thumbnails/paddingoraclepublic-130806071305-phpapp01-thumbnail.jpg?width=640&height=640&fit=bounds)
![[Sitcon2018] Analysis and Improvement of IOTA PoW Implementation](https://cdn.slidesharecdn.com/ss_thumbnails/sitcon2018analysisandimprovementofiotapowimplementation-180306085230-thumbnail.jpg?width=640&height=640&fit=bounds)