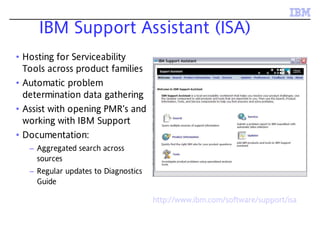
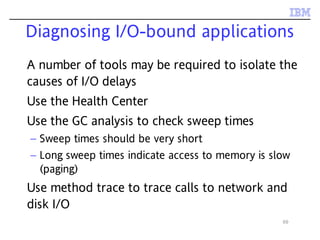
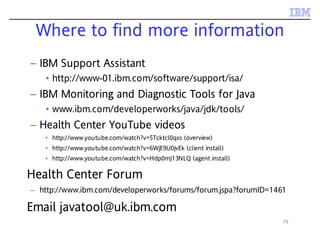
© 2009 IBM Corporation
Java performance - not so scary after all
Holly Cummins
IBM Hursley Labs
So ...
You have a performance problem.
What next?
4
Goals
After this talk you will:
– Not feel abject terror when confronted with a
performance problem
– Understand when and why to use performance tools
– Have a toolkit of performance tools and techniques
– Get to know your Java application better
5
Agenda
Performance – why it's actually cool and fun
Performance tuning techniques
Tools for identifying bottlenecks
– Memory
– CPU
– I/O
– Synchronization
6
Agenda
Performance – why it's actually cool and fun
Performance tuning techniques
Tools for identifying bottlenecks
– Memory
– CPU
– I/O
– Synchronization
Who cares about performance?
We all do
– Sluggish web pages
– Annoying programs
– Hangs
– Crashes
Bad performance costs
“Poor application performance costs 1 in 3
enterprises over £1 million per year”
» (http://www.morse.com/press_9.htm)
Bad performance is costing you ...
Electricity
Employee productivity
Lost business
– Example: unresponsive web pages
Hard cash
– Example: Arbitrage trading
• Delays in reacting to fluctuating prices can cost millions
Hardware and performance
Moore's law predicts exponential growth in
hardware speed
– Software development corollary:
• How to double application performance? Wait 18 months
before releasing it!
Hardware and performance
Moore's law predicts exponential growth in
hardware speed
– Software development corollary:
• How to double application performance? Wait 18 months
before releasing it!
Clock speeds aren't going up at the same rates
anymore
– Software development corollary:
• Uh oh.
12
Agenda
Performance – why it's actually cool and fun
Performance tuning techniques
Tools for identifying bottlenecks
– Memory
– CPU
– I/O
– Synchronization
13
Fixing performance problems
Where to start?
14
15
A general methodology
Performance problems are caused by limited
resources
Which resource is limited?
Finding the bottleneck
Resources to consider
Applications may be
– CPU bound
– I/O bound
– Space bound
– “Lock bound” (contended)
Which resource is limited?
CPU bound:
– CPU utilisation consistently high
I/O bound
– CPU utilisation not consistently high
Lock bound
– CPU utilisation not consistently high
Space bound
– Any of the above!
These heuristics aren't precise enough
What is the JVM doing?
Tools can help
Even better ... recommendations
Recommendations
provide
– Visual indicator of
status
– Explanation of
problems and
solutions
– Suggested
command line
A word of caution
Performance must be measured before
problems can be fixed
– Otherwise you risk making things worse with a
clever fix
Performance measurement must be based on
your application and your quality of service
requirements
Measurements must be made in a system as
similar as possible to the production one
– Fixing the wrong bottleneck doesn't help
anything
How well is your app performing?
Performance can be very variable, so
measurements must be repeated
Allow unmeasured warm-up period
– (If that's how the application will run)
– Allows caches to be populated and methods to
be compiled
26
Agenda
Performance – why it's actually cool and fun
Performance tuning techniques
Tools for identifying bottlenecks
– Memory
– CPU
– I/O
– Synchronization
IBM Performance Tools
IBM provides a number of tools to identify
and fix performance bottlenecks
The tools are all free
Most – but not all – are for IBM JVMs only
Tools available from IBM Support Assistant
IBM Support Assistant (ISA)
• Hosting for Serviceability
Tools across product families
• Automatic problem
determination data gathering
• Assist with opening PMR’s and
working with IBM Support
• Documentation:
– Aggregated search across
sources
– Regular updates to Diagnostics
Guide
hhhhhhttttttttttttp:p:p:p:p:p:////////////wwwwwwwwwwwwwwwwww......iiiiiibmbmbmbmbmbm......ccccccomomomomomom//////ssssssofofofofofofttttttwwwwwwaaaaaarrrrrreeeeee/s/s/s/s/s/suuuuuuppppppporporporporporportttttt/i/i/i/i/i/issssssaaaaaa
29
Agenda
Performance – why it's actually cool and fun
Performance tuning techniques
Tools for identifying bottlenecks
– Memory
– CPU
– I/O
– Synchronization
30
Space-bound applications
Memory is a crucial resource
Excessive memory usage can cause:
– Poor throughput
– Unresponsive applications
– Unpredictable program behavior
– Crashes in the application
Diagnosing space-bound applications
Space bound can be disguised as CPU bound
– Java has garbage collection
– If the GC is running excessively it will hog the CPU
Space-bound can also be disguised as I/O bound
– Excessive “in use” footprint can cause
• Paging
• Cache misses
Checking memory usage in Java
Two approaches
Verbose GC
– On IBM platforms, use -Xverbose:gc or -
Xverbosegclog:$file to write directly to a file
– Logs may be analyzed with a verbose gc analysis
tool
Live memory monitoring
– Requires specialized tools
34
IBM Monitoring and Diagnostic tools for Java – GC and Memory Visualizer
Handles verbose GC from all versions of IBM
JVMs
– 1.4.2 through 1.6.0
– zSeries
– iSeries
– WebSphere real time
… and Solaris platforms
… and HP-UX platforms
GCMV capabilities
Analyses
– heap usage
– heap size
– pause times
– many other properties
Provides tuning recommendations
Compares multiple logs in the same reports
36
Heap Visualization
Heap occupancy
Pause times
37
Comparison & Advice
Compare runs…
Performance advisor…
What does GC tell you?
High heap occupancy indicates an application
is likely space bound
– Increase heap size or lower application footprint
If GC is using more than 10% or 20% of the CPU
action may be required
– Alternate choice of policy
– GC tuning
39
IBM Monitoring and Diagnostic Tools
for Java - Health Center
Live monitoring tool with very low overhead
for IBM® Java™ 5.0 and 6.0
– 2.6% overhead against WebSphere benchmark (full
set of data being collected)
Measures wide range of 'bottlenecks'
Gives insight into how your application is
behaving
Delivers set-up and tuning recommendations
to help avoid application problems
40
How the Health Center works
Agent must be installed into
your JVM and enabled with
a command-line option
Client (installed in the IBM
Support Assistant) makes a
network connection to the
agent
Health Center GC monitoring
• Visualises heap usage
and garbage
collection pause
times over time.
• Identifies memory
leaks
• Suggests command-
lines and tuning
parameters
• Same
recommendation
logic as GCMV
42
DEMO
Using the Health Center to
check memory usage
Assessing Footprint
Is the footprint too big?
Assessing Footprint
Is the footprint too big?
Is the footprint growing?
– Bad bad news
Assessing Footprint
Is the footprint too big?
Is the footprint growing?
– Bad bad news
If left unchecked, a memory leak will eventually
cause a crash
Memory leaks in Java?
Memory leaks happen when objects which are
no longer required still use up memory
Two kinds of memory leak:
– Losing a reference to an object which is no longer
in use
– Holding on to a reference for an object which is no
longer in use
Garbage collection eliminates the first kind, but
not the second
Diagnosing footprint issues
You need to know what objects are on the
heap
Heap dumps are a record of every object on
the heap
– Automatically produced on OutOfMemoryErrors
– Can be triggered programatically
Extremely useful for problem solving, but
tooling support is essential
48
Memory Analyzer
• Open source heap dump analysis
tool
• Wide platform coverage
– HPROF dumps from HotSpot based
JVMs
– DTFJ system dumps from IBM JVMs
– Portable Heap Dumps (PHD) file
from IBM JVMs
• Available from
– www.eclipse.org
– IBM Support Assistant
49
Detailed view of heap contents
50
DEMO
Using the Memory Analyzer to
identify memory consumers
51
Optimizing footprint
Inspect the set of retained objects
– Use dominator tree
– Use histogram
Search for inefficiently used data structures
Look for redundant data
– Use “Group by Value”
Don't forget native memory
Java applications use – and may leak - native
memory
Low occupancy is no guarantee an application
is not space bound.
Native memory use is not logged in verbose GC
OutOfMemory errors may occur even though
there is lots of room in the heap
Tracking native memory usage
Use platform-specific tools
– Windows perfmon tool
– Linux ps
– AIX vmstat
GCMV and native memory
GCMV can
visualize native
memory
Provides
recommendations
55
Identifying native memory contents
What is in the non-heap memory?
– Internal JVM data
– Interned Strings (for some JVMs)
– Classes (for some JVMs)
– NIO direct byte buffers
– Thread data
Difficult to analyze native memory directly
– But ... some of these have wrapper objects in the Java
heap
56
Using Memory Analyzer
Heap dump analysis can be used to identify some
native memory issues
– Are there a lot of Thread objects?
– Are there a lot of NIO direct byte buffers?
57
Agenda
Performance – why it's actually cool and fun
Performance tuning techniques
Tools for identifying bottlenecks
– Memory
– CPU
– I/O
– Synchronization
CPU bound applications
Code is being invoked more than it needs to be
– Easily done with event-driven models
An algorithm is not the most efficient
– Easily done without algorithms research!
Diagnosing CPU bound applications
Fixing CPU bound applications requires
knowledge of what code is being run
– Identify methods which are suitable for optimisation
• Optimising methods which the application doesn't spend
time in is a waste of your time
– Identify methods where more time is being spent than
you expect
• “Why is so much of my profile in calls to this trivial little
method?”
Method trace and profiling
There are two ways to work out what code your
application is doing
– Trace
– Sampling profiling
Method trace
Tracing
– Does not require specialist tools (but is better
with them)
– Records every invocation of a subset of methods
– Gives insight into sequence of events
– In the simplest case, System.out.println
– Usually focussed on targeted packages or
methods
Method profiling
Profiling
– Requires specialist tools
– Samples all methods and provides statistics
– Can give a broad picture of application activity
IBM Java method trace
Not overhead-free, but
lower overhead than
equivalent function
implemented in Java
Entry and exit trace for any Java methods
Instrumentation-free, and no extra code required
No fancy GUI, but very very powerful
Controlling what is traced
Can select on package, class or method name:
– Package: methods={java/lang/*}
– Class: methods={java/lang/String.*}
– Method: methods={HelloWorld.main}
Also ! operator and combination allowed:
– methods={java/lang/*,!java/lang/String*}
Possible to create huge volume of output, so use
sensible method specifications!
Triggering events
Can request certain actions occur when chosen
methods are entered or exited
Actions such as coredump, javadump, etc.
Actions such as enabling more method trace!
Can cause action to occur on n’th instance of
trigger condition
Can specify how many times the action occurs
Method profiling with Health Center
• Always-on profiling offers
insight into application
activity
• Identifies the hottest
methods in an application
• Full call stacks to identify
where methods are being
called from and what
methods they call
• No bytecode
instrumentation, no
recompiling
67
DEMO
Using the Health Center
to optimise a code path
68
Agenda
Performance – why it's actually cool and fun
Performance tuning techniques
Tools for identifying bottlenecks
– Memory
– CPU
– I/O
– Synchronization
69
Diagnosing I/O-bound applications
A number of tools may be required to isolate the
causes of I/O delays
Use the Health Center
Use the GC analysis to check sweep times
– Sweep times should be very short
– Long sweep times indicate access to memory is slow
(paging)
Use method trace to trace calls to network and
disk I/O
70
Agenda
Performance – why it's actually cool and fun
Performance tuning techniques
Tools for identifying bottlenecks
– Memory
– CPU
– I/O
– Synchronization
Concurrency and performance
Hardware speed is being achieved by scaling out
instead of up
Getting performance gains from multicore
systems is hard
Concurrency is next great challenge in software
engineering
– Designing for concurrency is hard
– Threads need to synchronize with each other to have a
chance of application correctness
Concurrency and performance (ii)
Synchronization has a performance cost
– Effectively makes execution single-core
This cost goes up with the number of cores
– Synchronization needs to be a lot smarter on huge
systems
– At some point synchronization becomes the main
performance bottleneck
Even on two-core systems, locking can be a big
performance cost
73
Diagnosing lock bound applications
Poor synchronization can cause significant
application delays
IBM provides tooling to quickly diagnose and
identify contended locks
– Health Center provides information on locks used in
Java applications and the JVM
Lock analysis
– Always-on lock
monitoring
– Quickly allows the
usage of all of locks
to be profiled
– Identifies locks
which might be
preventing the
application from
scaling
75
Agenda
Performance – why it's actually cool and fun
Performance tuning techniques
Tools for identifying bottlenecks
– Memory
– CPU
– I/O
– Synchronization
So ...
You have a performance problem ...
You diagnose and fix it.
78
– IBM Support Assistant
• http://www-01.ibm.com/software/support/isa/
– IBM Monitoring and Diagnostic Tools for Java
• www.ibm.com/developerworks/java/jdk/tools/
– Health Center YouTube videos
• http://www.youtube.com/watch?v=5Tcktcl0qxs (overview)
• http://www.youtube.com/watch?v=6WjE9U0jvEk (client install)
• http://www.youtube.com/watch?v=Hdp0mJ13NLQ (agent install)
Health Center Forum
– http://www.ibm.com/developerworks/forums/forum.jspa?forumID=1461
Email javatool@uk.ibm.com
Where to find more information
79
Any Questions?

Java performance - not so scary after all

  • 1.
    © 2009 IBMCorporation Java performance - not so scary after all Holly Cummins IBM Hursley Labs
  • 2.
    So ... You havea performance problem. What next?
  • 4.
    4 Goals After this talkyou will: – Not feel abject terror when confronted with a performance problem – Understand when and why to use performance tools – Have a toolkit of performance tools and techniques – Get to know your Java application better
  • 5.
    5 Agenda Performance – whyit's actually cool and fun Performance tuning techniques Tools for identifying bottlenecks – Memory – CPU – I/O – Synchronization
  • 6.
    6 Agenda Performance – whyit's actually cool and fun Performance tuning techniques Tools for identifying bottlenecks – Memory – CPU – I/O – Synchronization
  • 7.
    Who cares aboutperformance? We all do – Sluggish web pages – Annoying programs – Hangs – Crashes
  • 8.
    Bad performance costs “Poorapplication performance costs 1 in 3 enterprises over £1 million per year” » (http://www.morse.com/press_9.htm)
  • 9.
    Bad performance iscosting you ... Electricity Employee productivity Lost business – Example: unresponsive web pages Hard cash – Example: Arbitrage trading • Delays in reacting to fluctuating prices can cost millions
  • 10.
    Hardware and performance Moore'slaw predicts exponential growth in hardware speed – Software development corollary: • How to double application performance? Wait 18 months before releasing it!
  • 11.
    Hardware and performance Moore'slaw predicts exponential growth in hardware speed – Software development corollary: • How to double application performance? Wait 18 months before releasing it! Clock speeds aren't going up at the same rates anymore – Software development corollary: • Uh oh.
  • 12.
    12 Agenda Performance – whyit's actually cool and fun Performance tuning techniques Tools for identifying bottlenecks – Memory – CPU – I/O – Synchronization
  • 13.
  • 14.
  • 15.
  • 16.
    A general methodology Performanceproblems are caused by limited resources Which resource is limited?
  • 17.
  • 18.
  • 19.
    Resources to consider Applicationsmay be – CPU bound – I/O bound – Space bound – “Lock bound” (contended)
  • 20.
    Which resource islimited? CPU bound: – CPU utilisation consistently high I/O bound – CPU utilisation not consistently high Lock bound – CPU utilisation not consistently high Space bound – Any of the above! These heuristics aren't precise enough
  • 21.
    What is theJVM doing?
  • 22.
  • 23.
    Even better ...recommendations Recommendations provide – Visual indicator of status – Explanation of problems and solutions – Suggested command line
  • 24.
    A word ofcaution Performance must be measured before problems can be fixed – Otherwise you risk making things worse with a clever fix Performance measurement must be based on your application and your quality of service requirements Measurements must be made in a system as similar as possible to the production one – Fixing the wrong bottleneck doesn't help anything
  • 25.
    How well isyour app performing? Performance can be very variable, so measurements must be repeated Allow unmeasured warm-up period – (If that's how the application will run) – Allows caches to be populated and methods to be compiled
  • 26.
    26 Agenda Performance – whyit's actually cool and fun Performance tuning techniques Tools for identifying bottlenecks – Memory – CPU – I/O – Synchronization
  • 27.
    IBM Performance Tools IBMprovides a number of tools to identify and fix performance bottlenecks The tools are all free Most – but not all – are for IBM JVMs only Tools available from IBM Support Assistant
  • 28.
    IBM Support Assistant(ISA) • Hosting for Serviceability Tools across product families • Automatic problem determination data gathering • Assist with opening PMR’s and working with IBM Support • Documentation: – Aggregated search across sources – Regular updates to Diagnostics Guide hhhhhhttttttttttttp:p:p:p:p:p:////////////wwwwwwwwwwwwwwwwww......iiiiiibmbmbmbmbmbm......ccccccomomomomomom//////ssssssofofofofofofttttttwwwwwwaaaaaarrrrrreeeeee/s/s/s/s/s/suuuuuuppppppporporporporporportttttt/i/i/i/i/i/issssssaaaaaa
  • 29.
    29 Agenda Performance – whyit's actually cool and fun Performance tuning techniques Tools for identifying bottlenecks – Memory – CPU – I/O – Synchronization
  • 30.
    30 Space-bound applications Memory isa crucial resource Excessive memory usage can cause: – Poor throughput – Unresponsive applications – Unpredictable program behavior – Crashes in the application
  • 31.
    Diagnosing space-bound applications Spacebound can be disguised as CPU bound – Java has garbage collection – If the GC is running excessively it will hog the CPU Space-bound can also be disguised as I/O bound – Excessive “in use” footprint can cause • Paging • Cache misses
  • 32.
  • 33.
    Two approaches Verbose GC –On IBM platforms, use -Xverbose:gc or - Xverbosegclog:$file to write directly to a file – Logs may be analyzed with a verbose gc analysis tool Live memory monitoring – Requires specialized tools
  • 34.
    34 IBM Monitoring andDiagnostic tools for Java – GC and Memory Visualizer Handles verbose GC from all versions of IBM JVMs – 1.4.2 through 1.6.0 – zSeries – iSeries – WebSphere real time … and Solaris platforms … and HP-UX platforms
  • 35.
    GCMV capabilities Analyses – heapusage – heap size – pause times – many other properties Provides tuning recommendations Compares multiple logs in the same reports
  • 36.
  • 37.
    37 Comparison & Advice Compareruns… Performance advisor…
  • 38.
    What does GCtell you? High heap occupancy indicates an application is likely space bound – Increase heap size or lower application footprint If GC is using more than 10% or 20% of the CPU action may be required – Alternate choice of policy – GC tuning
  • 39.
    39 IBM Monitoring andDiagnostic Tools for Java - Health Center Live monitoring tool with very low overhead for IBM® Java™ 5.0 and 6.0 – 2.6% overhead against WebSphere benchmark (full set of data being collected) Measures wide range of 'bottlenecks' Gives insight into how your application is behaving Delivers set-up and tuning recommendations to help avoid application problems
  • 40.
    40 How the HealthCenter works Agent must be installed into your JVM and enabled with a command-line option Client (installed in the IBM Support Assistant) makes a network connection to the agent
  • 41.
    Health Center GCmonitoring • Visualises heap usage and garbage collection pause times over time. • Identifies memory leaks • Suggests command- lines and tuning parameters • Same recommendation logic as GCMV
  • 42.
    42 DEMO Using the HealthCenter to check memory usage
  • 43.
    Assessing Footprint Is thefootprint too big?
  • 44.
    Assessing Footprint Is thefootprint too big? Is the footprint growing? – Bad bad news
  • 45.
    Assessing Footprint Is thefootprint too big? Is the footprint growing? – Bad bad news If left unchecked, a memory leak will eventually cause a crash
  • 46.
    Memory leaks inJava? Memory leaks happen when objects which are no longer required still use up memory Two kinds of memory leak: – Losing a reference to an object which is no longer in use – Holding on to a reference for an object which is no longer in use Garbage collection eliminates the first kind, but not the second
  • 47.
    Diagnosing footprint issues Youneed to know what objects are on the heap Heap dumps are a record of every object on the heap – Automatically produced on OutOfMemoryErrors – Can be triggered programatically Extremely useful for problem solving, but tooling support is essential
  • 48.
    48 Memory Analyzer • Opensource heap dump analysis tool • Wide platform coverage – HPROF dumps from HotSpot based JVMs – DTFJ system dumps from IBM JVMs – Portable Heap Dumps (PHD) file from IBM JVMs • Available from – www.eclipse.org – IBM Support Assistant
  • 49.
    49 Detailed view ofheap contents
  • 50.
    50 DEMO Using the MemoryAnalyzer to identify memory consumers
  • 51.
    51 Optimizing footprint Inspect theset of retained objects – Use dominator tree – Use histogram Search for inefficiently used data structures Look for redundant data – Use “Group by Value”
  • 52.
    Don't forget nativememory Java applications use – and may leak - native memory Low occupancy is no guarantee an application is not space bound. Native memory use is not logged in verbose GC OutOfMemory errors may occur even though there is lots of room in the heap
  • 53.
    Tracking native memoryusage Use platform-specific tools – Windows perfmon tool – Linux ps – AIX vmstat
  • 54.
    GCMV and nativememory GCMV can visualize native memory Provides recommendations
  • 55.
    55 Identifying native memorycontents What is in the non-heap memory? – Internal JVM data – Interned Strings (for some JVMs) – Classes (for some JVMs) – NIO direct byte buffers – Thread data Difficult to analyze native memory directly – But ... some of these have wrapper objects in the Java heap
  • 56.
    56 Using Memory Analyzer Heapdump analysis can be used to identify some native memory issues – Are there a lot of Thread objects? – Are there a lot of NIO direct byte buffers?
  • 57.
    57 Agenda Performance – whyit's actually cool and fun Performance tuning techniques Tools for identifying bottlenecks – Memory – CPU – I/O – Synchronization
  • 58.
    CPU bound applications Codeis being invoked more than it needs to be – Easily done with event-driven models An algorithm is not the most efficient – Easily done without algorithms research!
  • 59.
    Diagnosing CPU boundapplications Fixing CPU bound applications requires knowledge of what code is being run – Identify methods which are suitable for optimisation • Optimising methods which the application doesn't spend time in is a waste of your time – Identify methods where more time is being spent than you expect • “Why is so much of my profile in calls to this trivial little method?”
  • 60.
    Method trace andprofiling There are two ways to work out what code your application is doing – Trace – Sampling profiling
  • 61.
    Method trace Tracing – Doesnot require specialist tools (but is better with them) – Records every invocation of a subset of methods – Gives insight into sequence of events – In the simplest case, System.out.println – Usually focussed on targeted packages or methods
  • 62.
    Method profiling Profiling – Requiresspecialist tools – Samples all methods and provides statistics – Can give a broad picture of application activity
  • 63.
    IBM Java methodtrace Not overhead-free, but lower overhead than equivalent function implemented in Java Entry and exit trace for any Java methods Instrumentation-free, and no extra code required No fancy GUI, but very very powerful
  • 64.
    Controlling what istraced Can select on package, class or method name: – Package: methods={java/lang/*} – Class: methods={java/lang/String.*} – Method: methods={HelloWorld.main} Also ! operator and combination allowed: – methods={java/lang/*,!java/lang/String*} Possible to create huge volume of output, so use sensible method specifications!
  • 65.
    Triggering events Can requestcertain actions occur when chosen methods are entered or exited Actions such as coredump, javadump, etc. Actions such as enabling more method trace! Can cause action to occur on n’th instance of trigger condition Can specify how many times the action occurs
  • 66.
    Method profiling withHealth Center • Always-on profiling offers insight into application activity • Identifies the hottest methods in an application • Full call stacks to identify where methods are being called from and what methods they call • No bytecode instrumentation, no recompiling
  • 67.
    67 DEMO Using the HealthCenter to optimise a code path
  • 68.
    68 Agenda Performance – whyit's actually cool and fun Performance tuning techniques Tools for identifying bottlenecks – Memory – CPU – I/O – Synchronization
  • 69.
    69 Diagnosing I/O-bound applications Anumber of tools may be required to isolate the causes of I/O delays Use the Health Center Use the GC analysis to check sweep times – Sweep times should be very short – Long sweep times indicate access to memory is slow (paging) Use method trace to trace calls to network and disk I/O
  • 70.
    70 Agenda Performance – whyit's actually cool and fun Performance tuning techniques Tools for identifying bottlenecks – Memory – CPU – I/O – Synchronization
  • 71.
    Concurrency and performance Hardwarespeed is being achieved by scaling out instead of up Getting performance gains from multicore systems is hard Concurrency is next great challenge in software engineering – Designing for concurrency is hard – Threads need to synchronize with each other to have a chance of application correctness
  • 72.
    Concurrency and performance(ii) Synchronization has a performance cost – Effectively makes execution single-core This cost goes up with the number of cores – Synchronization needs to be a lot smarter on huge systems – At some point synchronization becomes the main performance bottleneck Even on two-core systems, locking can be a big performance cost
  • 73.
    73 Diagnosing lock boundapplications Poor synchronization can cause significant application delays IBM provides tooling to quickly diagnose and identify contended locks – Health Center provides information on locks used in Java applications and the JVM
  • 74.
    Lock analysis – Always-onlock monitoring – Quickly allows the usage of all of locks to be profiled – Identifies locks which might be preventing the application from scaling
  • 75.
    75 Agenda Performance – whyit's actually cool and fun Performance tuning techniques Tools for identifying bottlenecks – Memory – CPU – I/O – Synchronization
  • 76.
    So ... You havea performance problem ... You diagnose and fix it.
  • 78.
    78 – IBM SupportAssistant • http://www-01.ibm.com/software/support/isa/ – IBM Monitoring and Diagnostic Tools for Java • www.ibm.com/developerworks/java/jdk/tools/ – Health Center YouTube videos • http://www.youtube.com/watch?v=5Tcktcl0qxs (overview) • http://www.youtube.com/watch?v=6WjE9U0jvEk (client install) • http://www.youtube.com/watch?v=Hdp0mJ13NLQ (agent install) Health Center Forum – http://www.ibm.com/developerworks/forums/forum.jspa?forumID=1461 Email javatool@uk.ibm.com Where to find more information
  • 79.