Download as PDF, PPTX
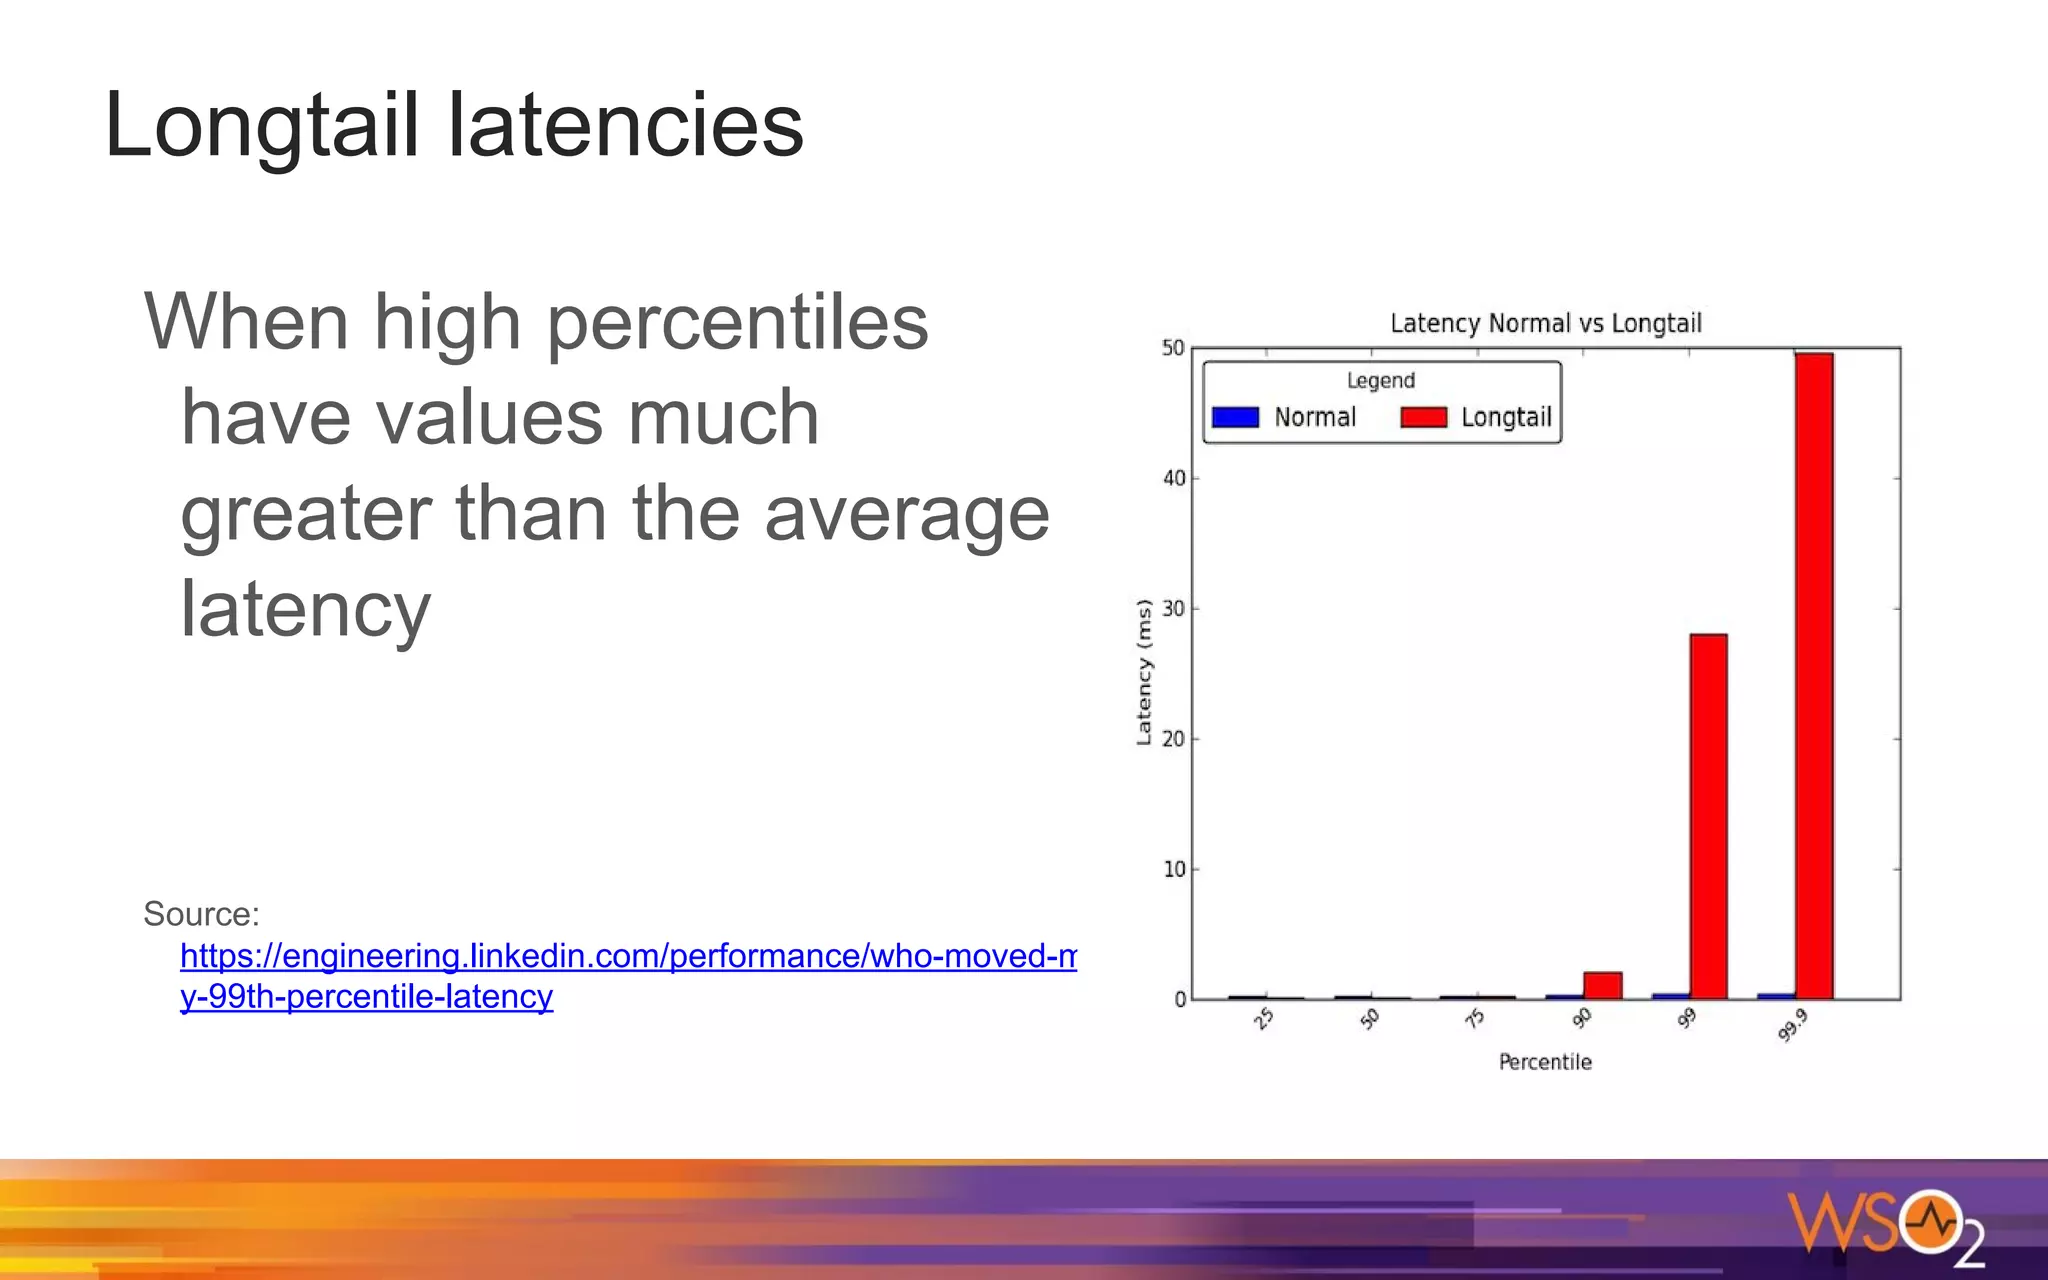


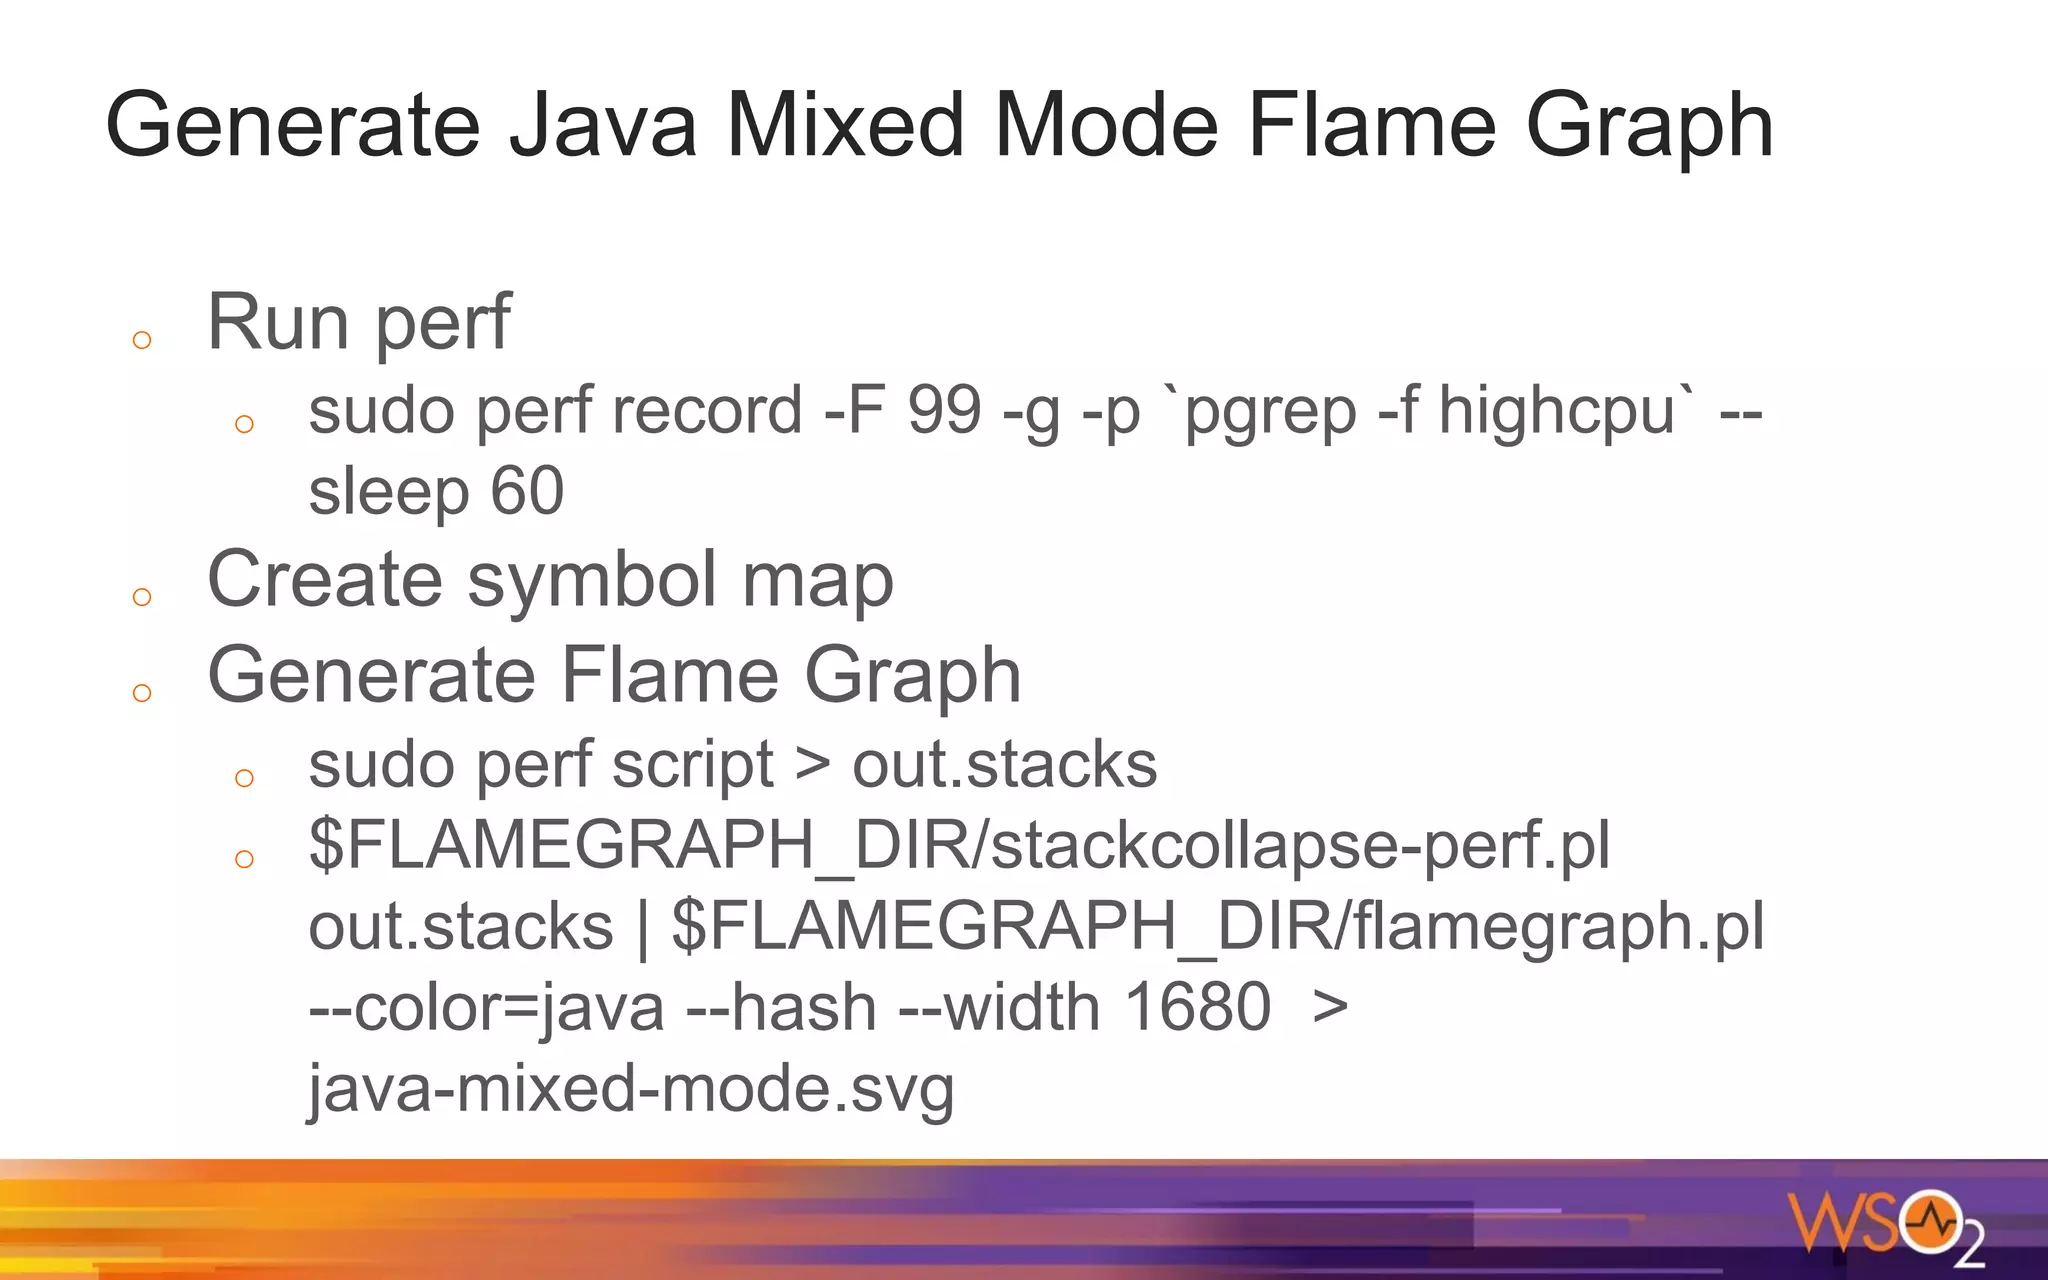
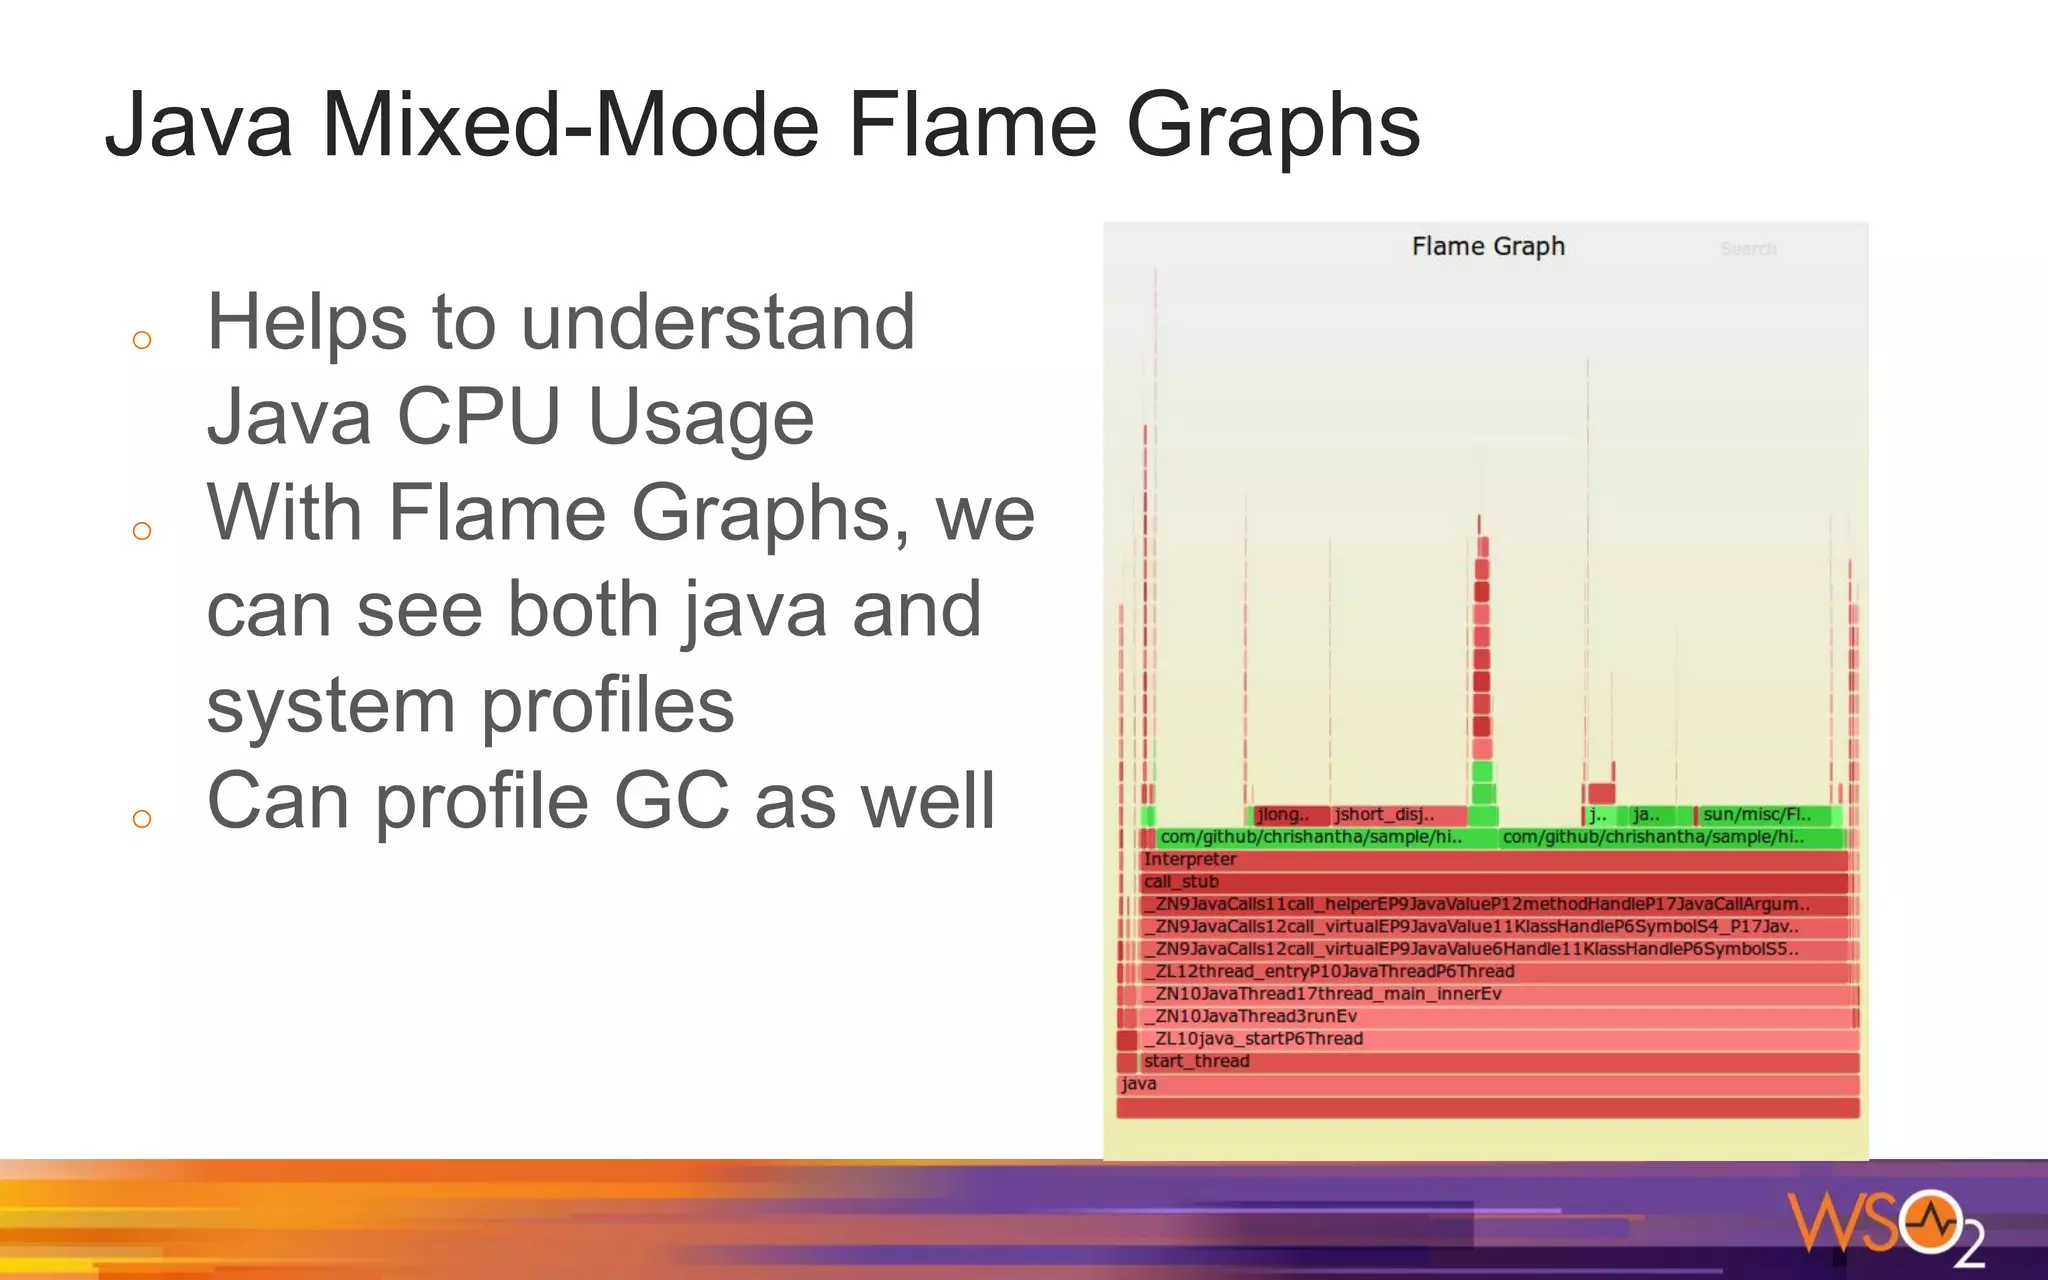


The document provides a comprehensive overview of Java performance and profiling techniques, emphasizing the importance of measuring latency and throughput to optimize application performance. It discusses key concepts such as garbage collection, Java heap structure, and various tools for monitoring and profiling Java applications, including Java VisualVM and Java Flight Recorder. Additionally, it highlights the use of Just-In-Time (JIT) compilation and profiling methodologies to enhance application efficiency.


![[Roundtable] Choreo - The AI-Native Internal Developer Platform as a Service](https://cdn.slidesharecdn.com/ss_thumbnails/choreo-deck-250328074645-511dded7-thumbnail.jpg?width=640&height=640&fit=bounds)


