Download as PDF, PPTX
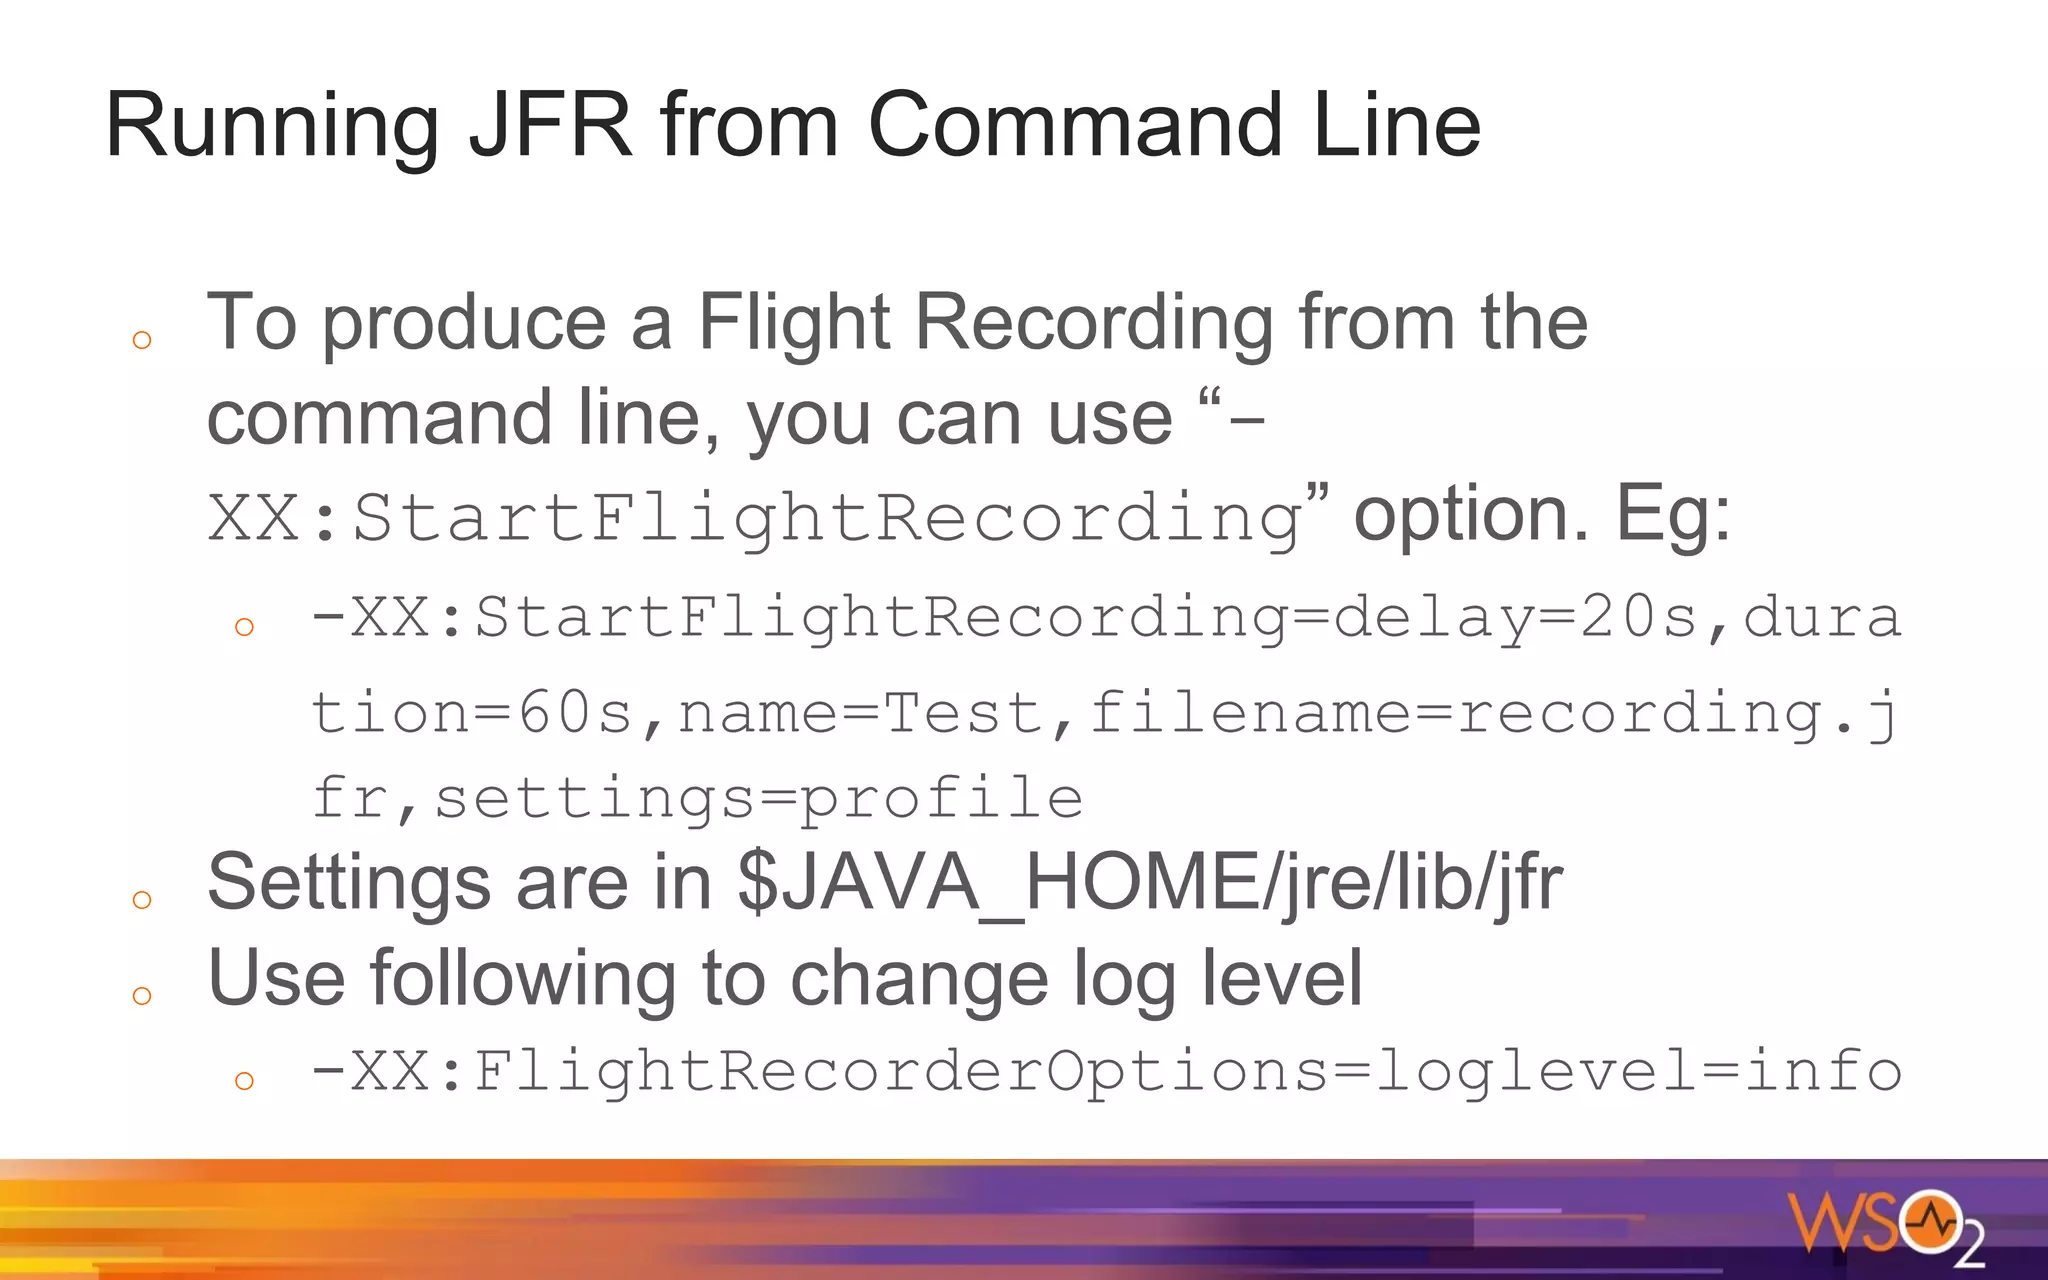
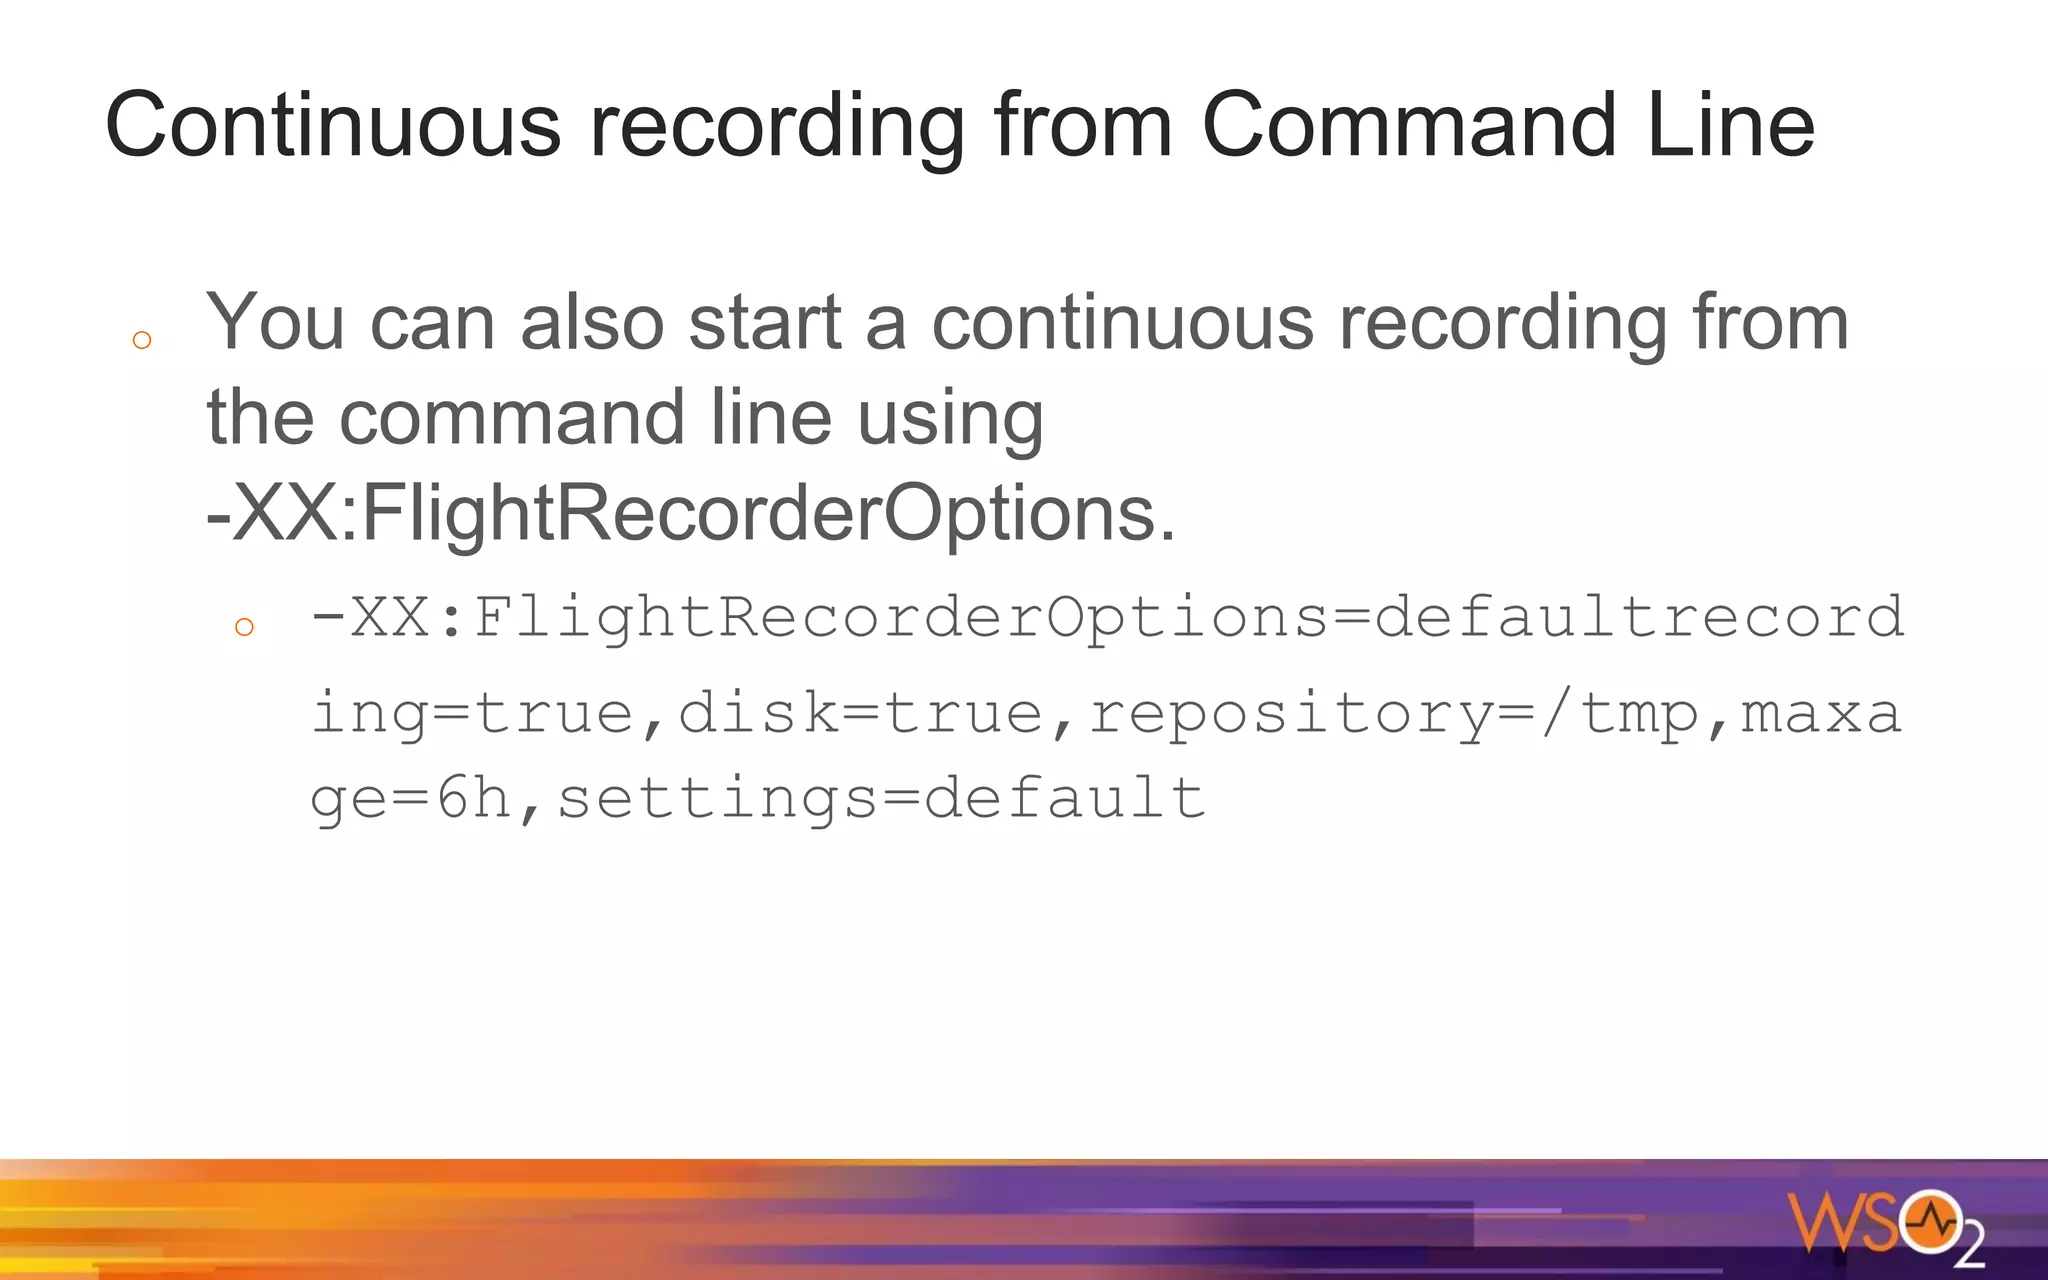
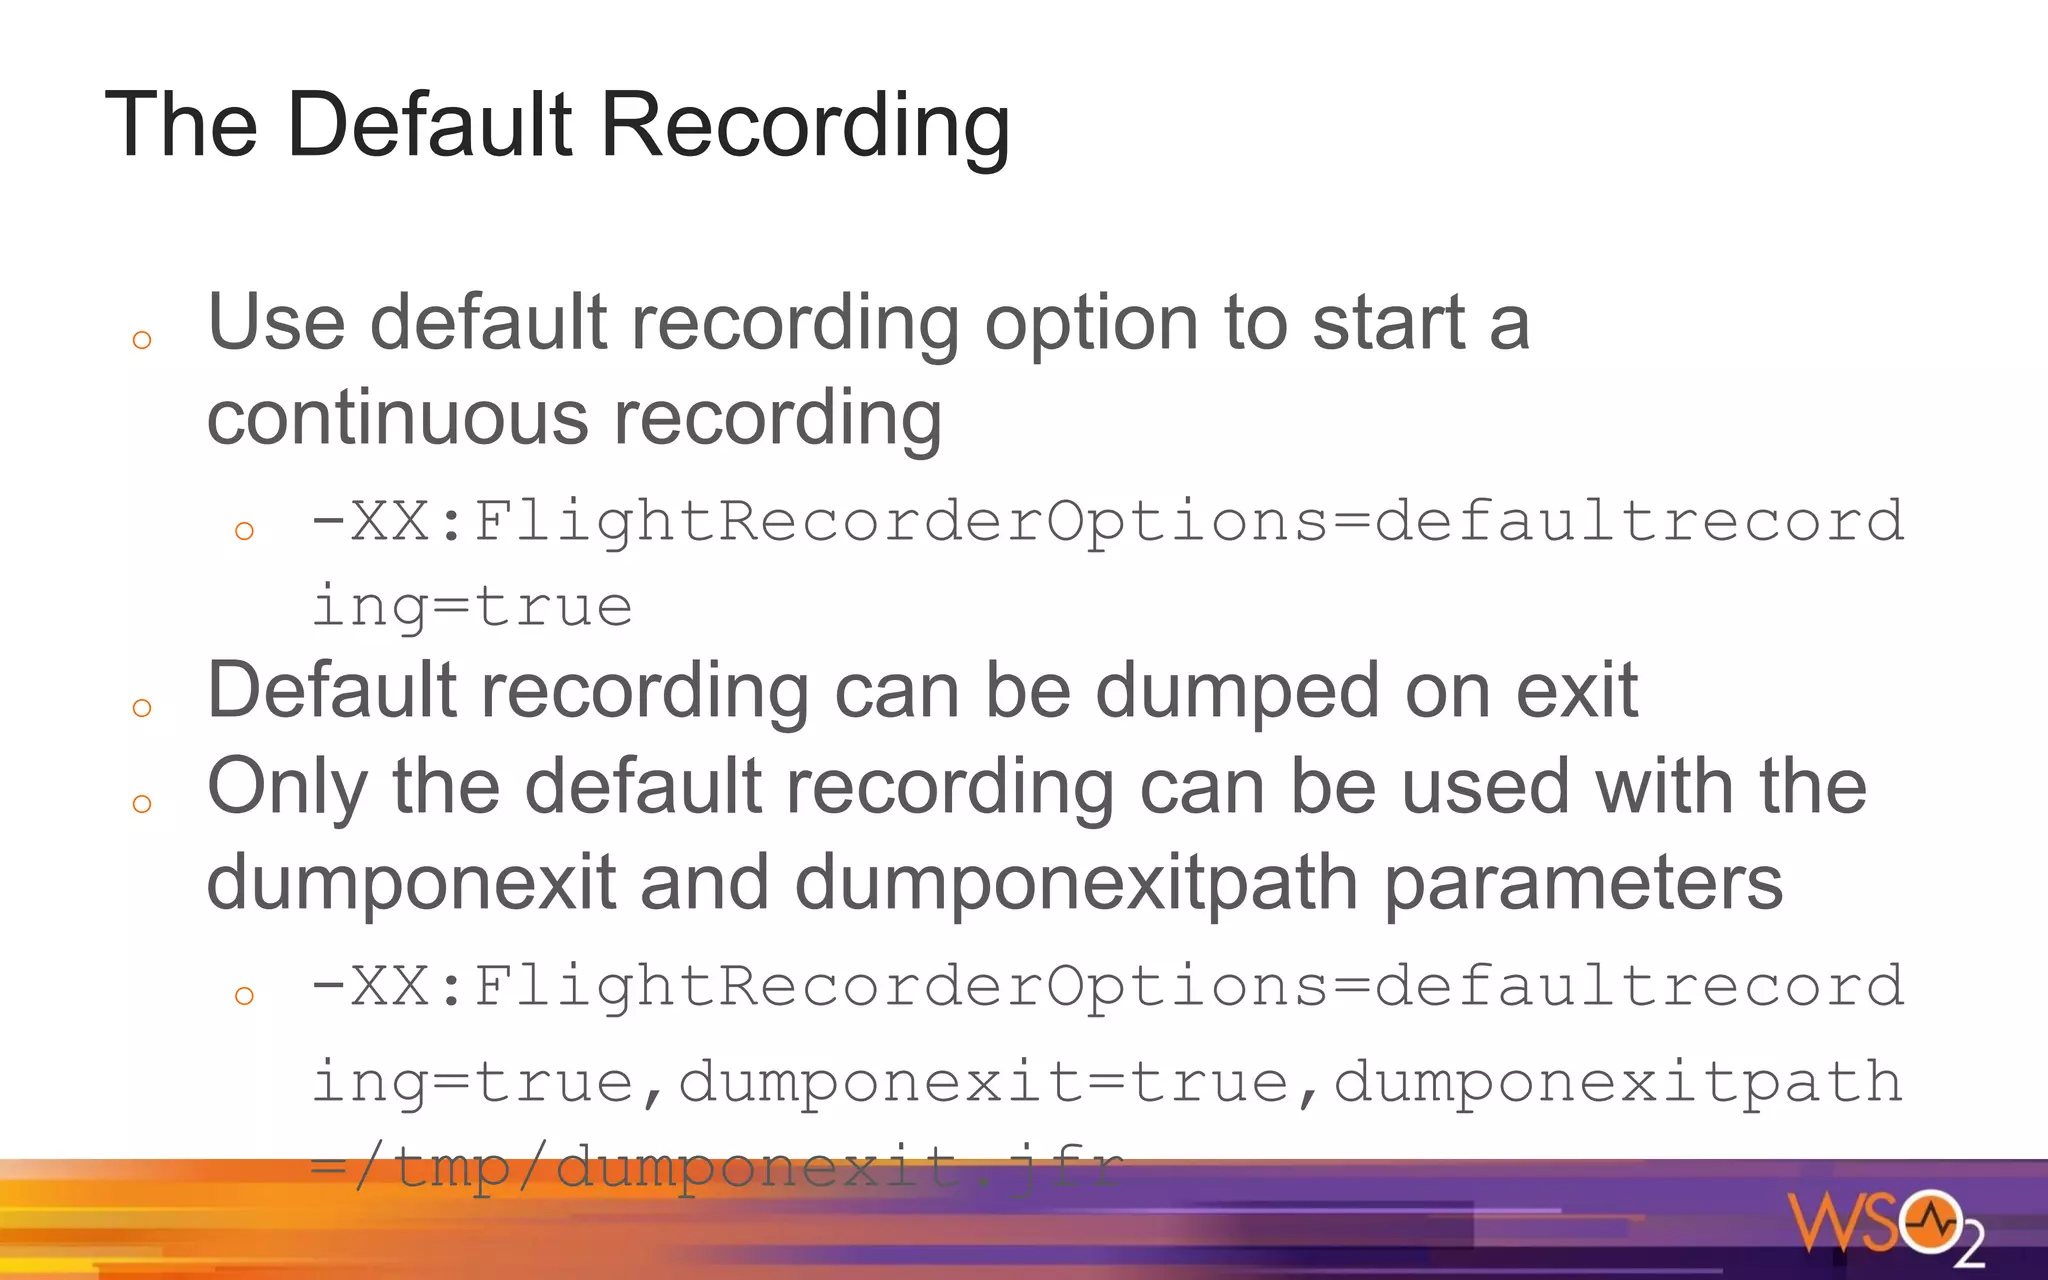
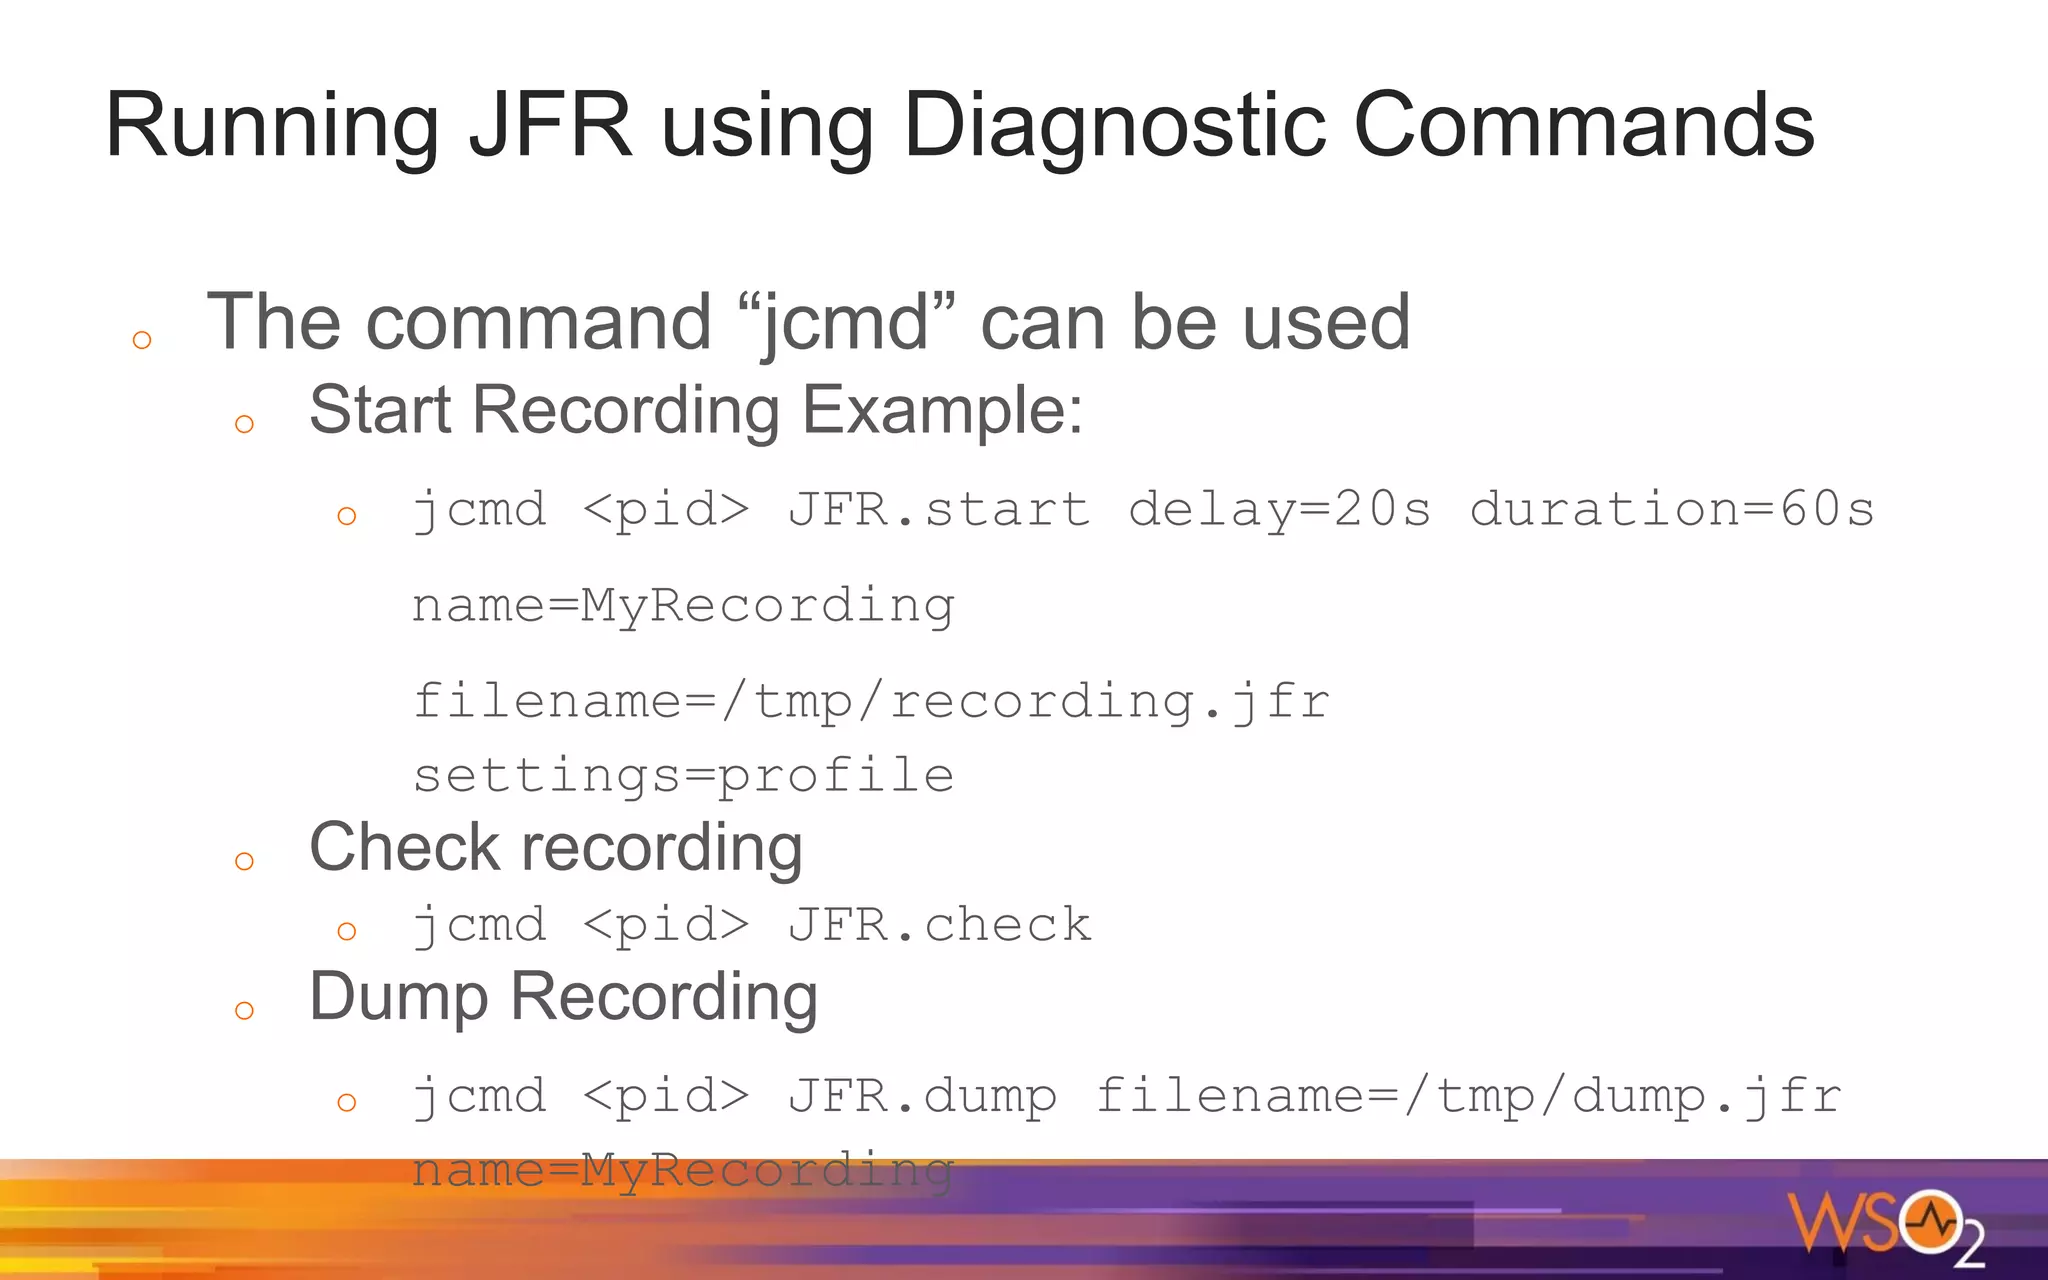


The document discusses Java performance measurement using metrics like latency and throughput, highlighting the importance of tuning Java applications for optimal performance. It covers Java garbage collection, memory management, and features like Java Flight Recorder (JFR) for profiling applications with minimal overhead. Additionally, it delves into JIT compilation, profiling techniques, and tools available for monitoring and enhancing Java application performance.