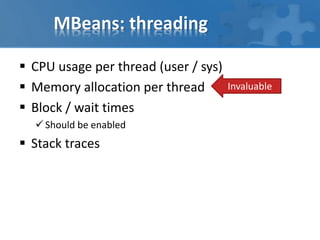
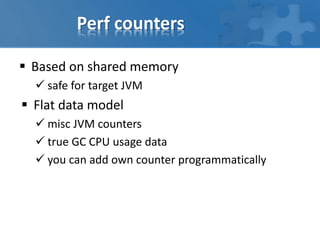
This document summarizes tools and techniques for Java profiling and diagnostics. It discusses using JMX, JVMTI, and the Attach API to gather information on threading, memory usage, garbage collection, and perform actions like heap dumps. It also introduces the SJK toolkit which provides commands for profiling tasks and the Sigar and BTrace tools. Real-world uses of profiling techniques are presented, like benchmarking and diagnosing production systems. Future ideas proposed include a visual thread analyzer and scripting-based heap dump exploration.


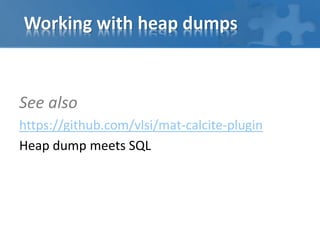
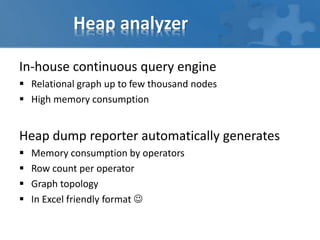
![SJK: ttop
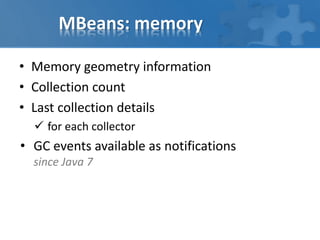
2014-10-01T19:27:22.825+0400 Process summary
process cpu=101.80%
application cpu=100.50% (user=86.21% sys=14.29%)
other: cpu=1.30%
GC cpu=0.00% (young=0.00%, old=0.00%)
heap allocation rate 123mb/s
[000037] user=83.66% sys=14.02% alloc= 121mb/s - Proxy:ExtendTcpProxyService1:TcpAcceptor:TcpProcessor
[000075] user= 0.97% sys= 0.08% alloc= 411kb/s - RMI TCP Connection(35)-10.139.200.51
[000029] user= 0.61% sys=-0.00% alloc= 697kb/s - Invocation:Management
[000073] user= 0.49% sys=-0.01% alloc= 343kb/s - RMI TCP Connection(33)-10.128.46.114
[000023] user= 0.24% sys=-0.01% alloc= 10kb/s - PacketPublisher
[000022] user= 0.00% sys= 0.10% alloc= 11kb/s - PacketReceiver
[000072] user= 0.00% sys= 0.07% alloc= 22kb/s - RMI TCP Connection(31)-10.139.207.76
[000056] user= 0.00% sys= 0.05% alloc= 20kb/s - RMI TCP Connection(25)-10.139.207.76
[000026] user= 0.12% sys=-0.07% alloc= 2217b/s - Cluster|Member(Id=18, Timestamp=2014-10-01 15:58:3...
[000076] user= 0.00% sys= 0.04% alloc= 6657b/s - JMX server connection timeout 76
[000021] user= 0.00% sys= 0.03% alloc= 526b/s - PacketListener1P
[000034] user= 0.00% sys= 0.02% alloc= 1537b/s - Proxy:ExtendTcpProxyService1
[000049] user= 0.00% sys= 0.02% alloc= 6011b/s - JMX server connection timeout 49
[000032] user= 0.00% sys= 0.01% alloc= 0b/s - DistributedCache
https://github.com/aragozin/jvm-tools/blob/master/sjk-core/COMMANDS.md#ttop-command
Available via PerfCounters](https://image.slidesharecdn.com/javaprofilingdiy-jug2015-150530050257-lva1-app6891/85/Java-profiling-Do-It-Yourself-4-320.jpg)
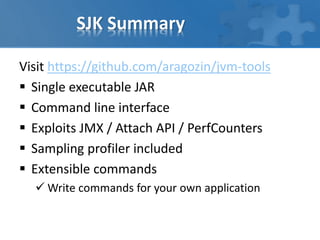
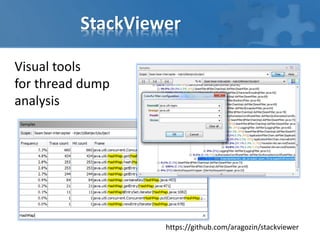
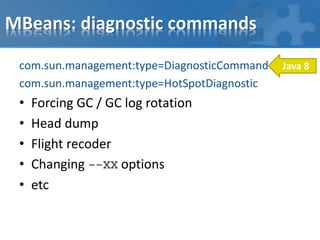
![SJK: GC
[GC: Copy#1806 time: 7ms interval: 332ms mem: Eden Space: 108032k-108032k->0k[max:191168k,rate:-325397.59kb/s] Tenured
Gen: 162185k+14k->162199k[max:477888k,rate:42.22kb/s] Survivor Space: 235k-13k->222k[max:23872k,rate:-41.93kb/s]]
[GC: Copy#1807 time: 8ms interval: 338ms mem: Eden Space: 108032k-108032k->0k[max:191168k,rate:-319621.30kb/s] Tenured
Gen: 162199k+219k->162418k[max:477888k,rate:648.30kb/s] Survivor Space: 222k-217k->4k[max:23872k,rate:-644.90kb/s]]
[GC: Copy#1808 time: 7ms interval: 321ms mem: Eden Space: 108032k-108032k->0k[max:191168k,rate:-336548.29kb/s] Tenured
Gen: 162418k+0k->162418k[max:477888k,rate:0.00kb/s] Survivor Space: 4k-2k->1k[max:23872k,rate:-7.64kb/s]]
[GC: Copy#1809 time: 7ms interval: 321ms mem: Eden Space: 108032k-108032k->0k[max:191168k,rate:-336548.29kb/s] Tenured
Gen: 162418k+0k->162418k[max:477888k,rate:0.00kb/s] Survivor Space: 1k+0k->1k[max:23872k,rate:0.24kb/s]]
[GC: Copy#1810 time: 4ms interval: 700ms mem: Eden Space: 108032k-108032k->0k[max:191168k,rate:-154331.43kb/s] Tenured
Gen: 162418k+0k->162418k[max:477888k,rate:0.00kb/s] Survivor Space: 1k+288k->290k[max:23872k,rate:412.00kb/s]]
[GC: Copy#1811 time: 5ms interval: 311ms mem: Eden Space: 108032k-108032k->0k[max:191168k,rate:-347369.77kb/s] Tenured
Gen: 162418k+0k->162418k[max:477888k,rate:0.00kb/s] Survivor Space: 290k-155k->135k[max:23872k,rate:-498.52kb/s]]
[GC: Copy#1812 time: 3ms interval: 340ms mem: Eden Space: 108032k-108032k->0k[max:191168k,rate:-317741.18kb/s] Tenured
Gen: 162418k+0k->162418k[max:477888k,rate:0.00kb/s] Survivor Space: 135k-2k->132k[max:23872k,rate:-6.14kb/s]]
[GC: Copy#1813 time: 6ms interval: 325ms mem: Eden Space: 108032k-108032k->0k[max:191168k,rate:-332406.15kb/s] Tenured
Gen: 162418k+0k->162418k[max:477888k,rate:0.00kb/s] Survivor Space: 132k+0k->133k[max:23872k,rate:0.65kb/s]]
Total
Copy[ collections: 28 | avg: 0.0065 secs | total: 0.2 secs ]
MarkSweepCompact[ collections: 0 | avg: NaN secs | total: 0.0 secs ]
https://github.com/aragozin/jvm-tools/blob/master/sjk-core/COMMANDS.md#gc-command](https://image.slidesharecdn.com/javaprofilingdiy-jug2015-150530050257-lva1-app6891/85/Java-profiling-Do-It-Yourself-6-320.jpg)
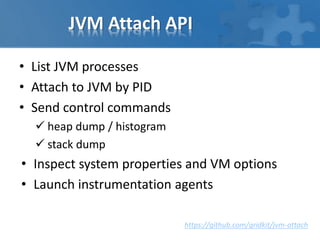
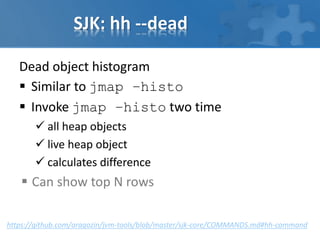
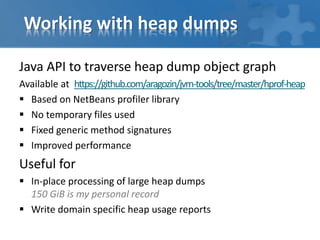
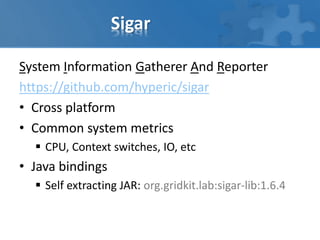
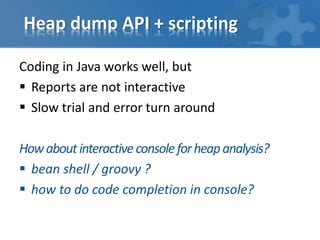
![Working with heap dumps
HeapPath
Convenient way to extract value from dump
Error proof
Handles String, primitives/boxed and arrays
myfield1.myfield2.myfield3
myarrayfield[0].myfield
myarrayfield[*].myfield
myarrayfield[*][*]
myfield1.*.myfield3
[*].value(MyClass)
myhashmap?entrySet[key=description].value](https://image.slidesharecdn.com/javaprofilingdiy-jug2015-150530050257-lva1-app6891/85/Java-profiling-Do-It-Yourself-17-320.jpg)