The document covers key concepts in Java, focusing on concurrency, memory management, and performance profiling tools like NetBeans Profiler, JProfiler, and Eclipse TPTP. It outlines strategies for diagnosing and resolving performance issues in development and production environments, emphasizing the importance of relying on tool outputs rather than personal experience. Additionally, it includes best practices for memory management, garbage collection, and the efficient use of resources in Java applications.


![ Using the Interface or extending the Class :
public class HelloRunnable implements Runnable {
public void run() {
System.out.println("Hello!");
}
public static void main(String args[]) {
(new Thread(new HelloRunnable())).start();
}
}](https://image.slidesharecdn.com/profiler-guidedjavaperformancetuning-140615143119-phpapp01/75/Profiler-Guided-Java-Performance-Tuning-18-2048.jpg)
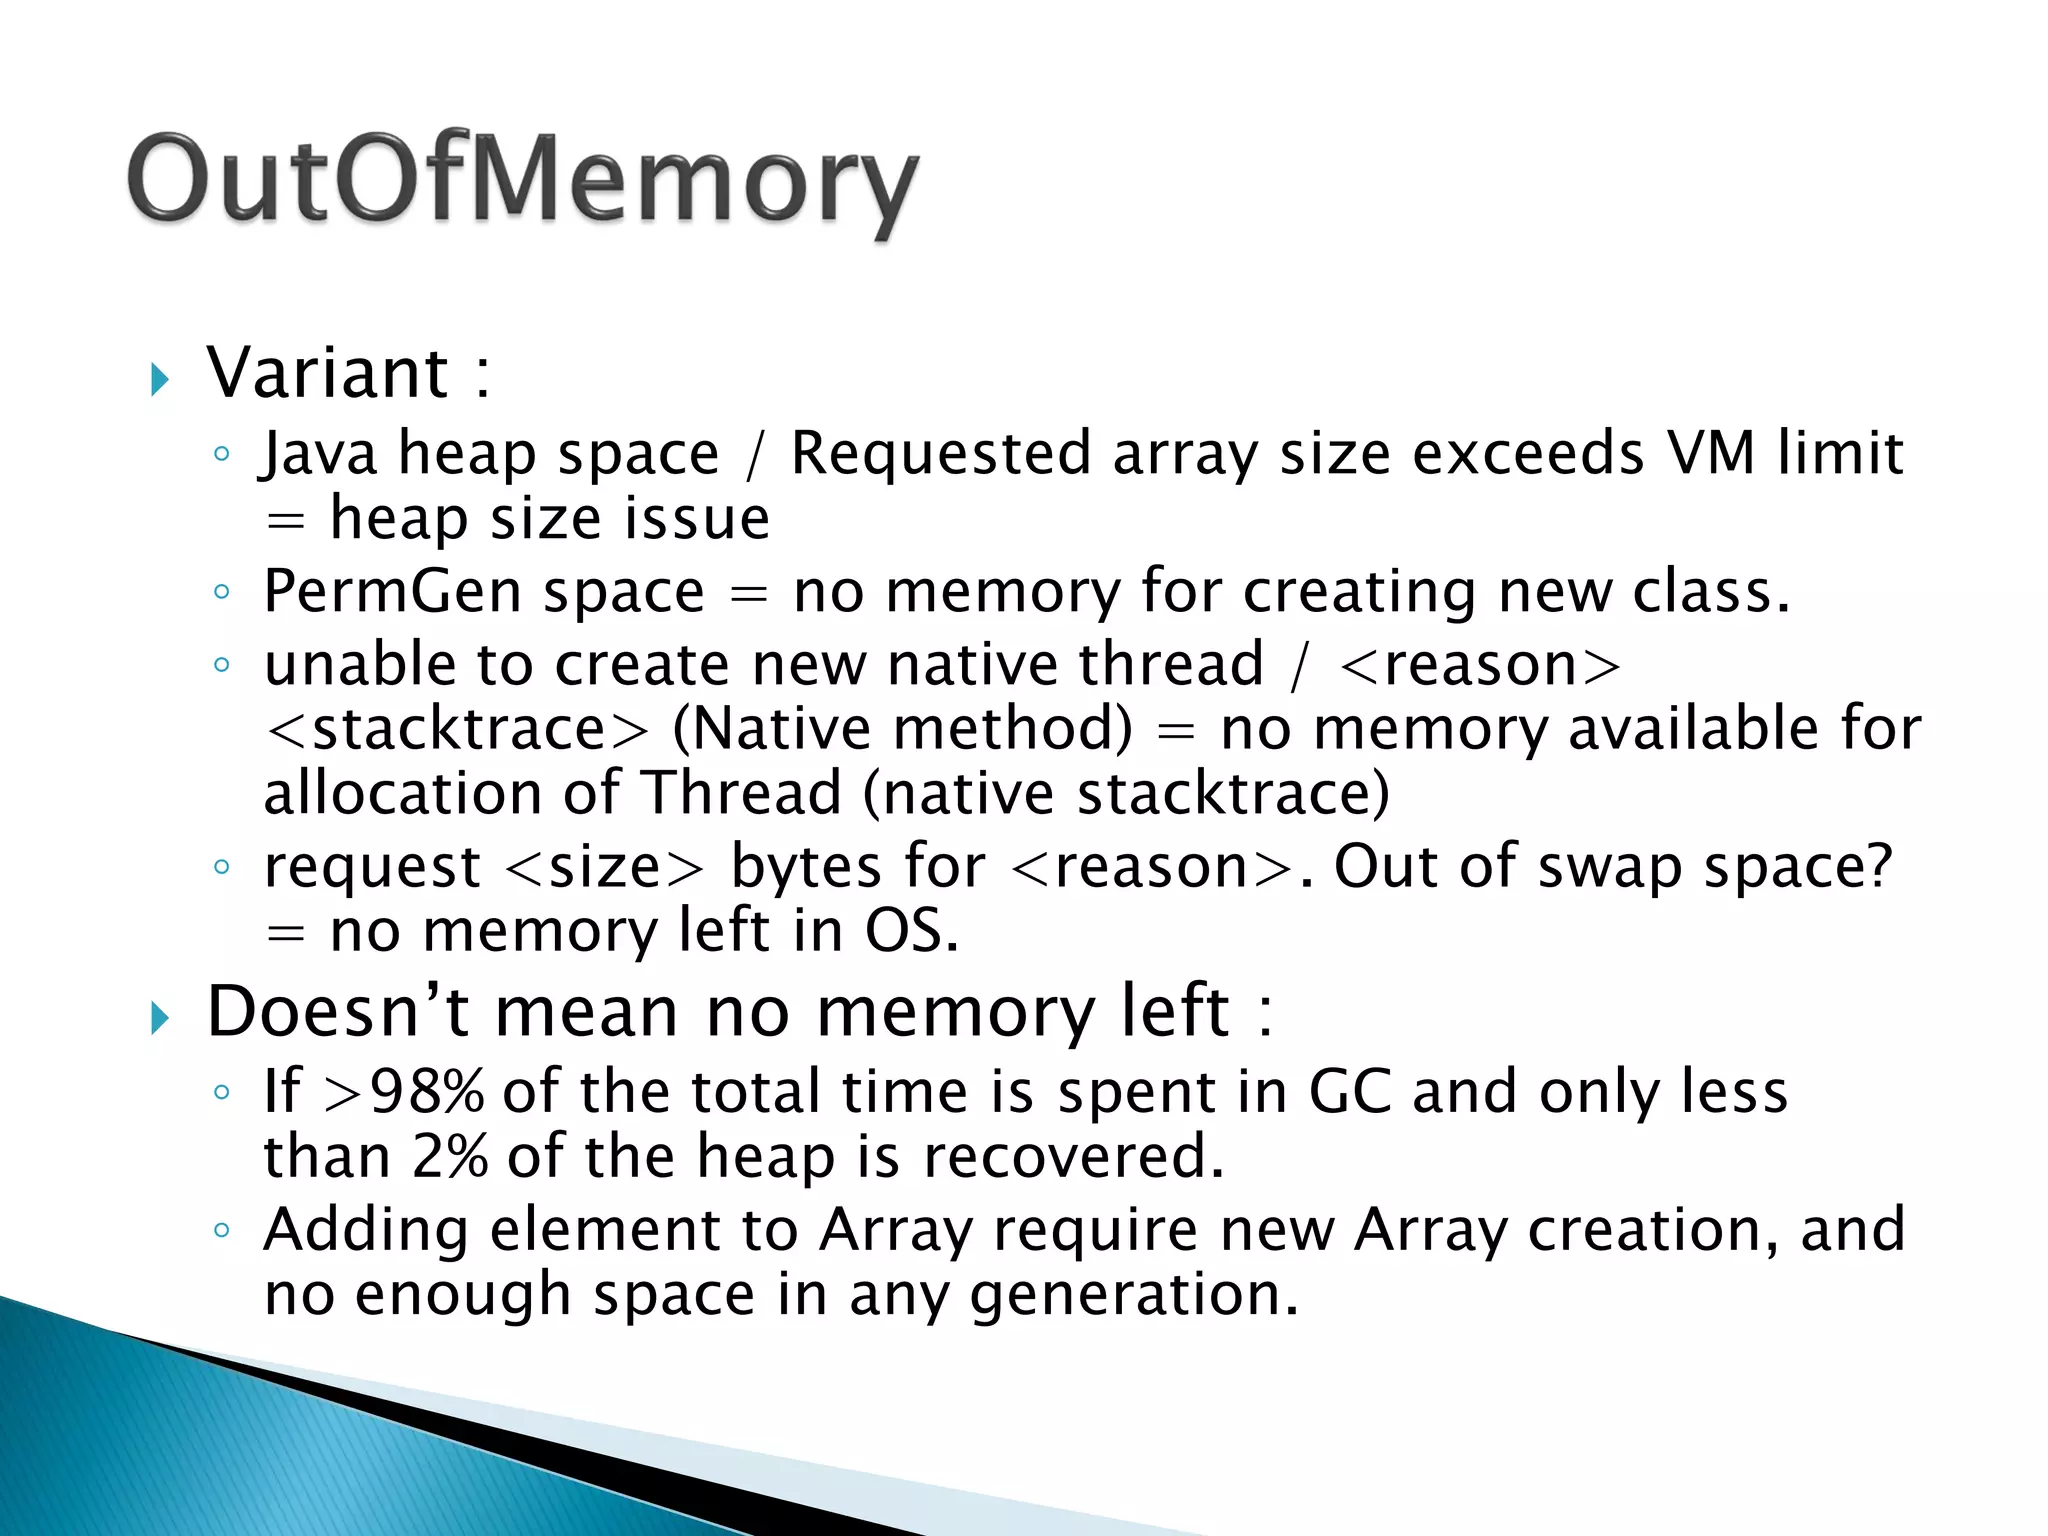
![ -verbose:gc
[GC 325816K->83372K(776768K), 0.2454258 secs]
[Full GC 267628K->83769K(776768K), 1.8479984 secs]
[GC (1)->(2)(3), (4) secs]
(1->2) Combined size of live objects before and
after garbage collection.
(3) Amount of space usable for java objects
without requesting more memory from the
operating system.
(4) time taken to perform GC.
-XX:+PrintGCDetails : print more details
-XX:+PrintGCTimeStamps : print timestamp](https://image.slidesharecdn.com/profiler-guidedjavaperformancetuning-140615143119-phpapp01/75/Profiler-Guided-Java-Performance-Tuning-35-2048.jpg)