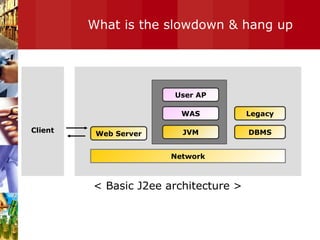
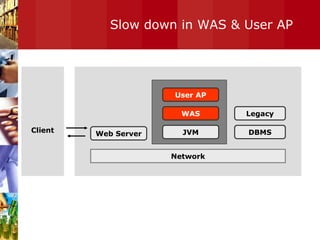
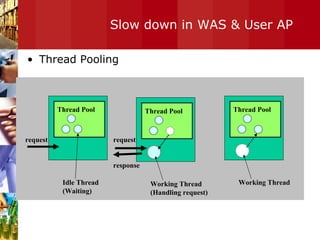
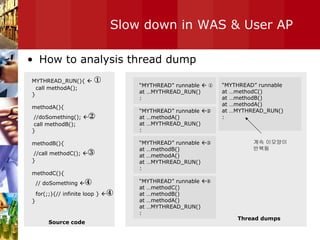
The document discusses the issues of 'slowdown' and 'hang up' in WebLogic and other J2EE applications, detailing their definitions, common causes, and methods for diagnosis and resolution. Key points include thread management, understanding thread dumps, identifying lock contention and deadlocks, and optimizing resource usage such as memory and database response times. It emphasizes the importance of proactive measures like memory tuning and clustering to prevent performance issues.

![Slow down in WAS & User AP Thread dump It displays all of thread state by “THREAD STACK” "ExecuteThread: '42' for queue: 'default'" daemon prio=5 tid=0x3504b0 nid=0x34 runnable [0x9607e000..0x9607fc68] Thread name Thread id (signature) Thread State Program stack of this thread Sun JVM at java.net.SocketInputStream.read(SocketInputStream.java:85) at oracle.net.ns.Packet.receive(Unknown Source) at oracle.net.ns.NetInputStream.getNextPacket(Unknown Source) at oracle.net.ns.NetInputStream.read(Unknown Source) at oracle.net.ns.NetInputStream.read(Unknown Source) at oracle.net.ns.NetInputStream.read(Unknown Source) at oracle.jdbc.ttc7.MAREngine.unmarshalUB1(MAREngine.java:730) at oracle.jdbc.ttc7.MAREngine.unmarshalSB1(MAREngine.java:702) at oracle.jdbc.ttc7.Oall7.receive(Oall7.java:373) at oracle.jdbc.ttc7.TTC7Protocol.doOall7(TTC7Protocol.java:1427) at oracle.jdbc.ttc7.TTC7Protocol.fetch(TTC7Protocol.java:911) at oracle.jdbc.driver.OracleStatement.doExecuteQuery(OracleStatement.java:1948) at oracle.jdbc.driver.OracleStatement.doExecuteWithTimeout(OracleStatement.java:2137) at oracle.jdbc.driver.OraclePreparedStatement.executeUpdate(OraclePreparedStatement.java:404) at oracle.jdbc.driver.OraclePreparedStatement.executeQuery(OraclePreparedStatement.java:344) at weblogic.jdbc.pool.PreparedStatement.executeQuery(PreparedStatement.java:51) at weblogic.jdbc.rmi.internal.PreparedStatementImpl.executeQuery(PreparedStatementImpl.java:56)](https://image.slidesharecdn.com/bea-analysisslowdownandhangupinj2eeapplication-090316211333-phpapp02/85/Find-bottleneck-and-tuning-in-Java-Application-13-320.jpg)
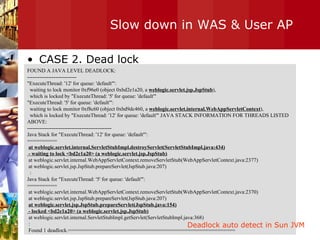
![Slow down in WAS & User AP CASE 1. Lock contention : Thread dump example "ExecuteThread: '12' for queue: 'weblogic.kernel.Default'" daemon prio=10 tid=0x0055ae20 nid=23 lwp_id=3722788 waiting for monitor entry [0x2fb6e000..0x2fb6d530] : at java.lang.ClassLoader.loadClass(ClassLoader.java:255) : at org.apache.xerces.jaxp.SAXParserFactoryImpl.newSAXParser(Unknown Source) at org.apache.axis.utils.XMLUtils.getSAXParser(XMLUtils.java:252) - locked < 0x329fcf50 > (a java.lang.Class) "ExecuteThread: '13' for queue: 'weblogic.kernel.Default'" daemon prio=10 tid=0x0055bde0 nid=24 lwp_id=3722789 waiting for monitor entry [0x2faec000..0x2faec530] at org.apache.axis.utils.XMLUtils.getSAXParser(XMLUtils.java:247) - waiting to lock < 0x329fcf50 > (a java.lang.Class) : "ExecuteThread: '15' for queue: 'weblogic.kernel.Default'" daemon prio=10 tid=0x0061dc20 nid=26 lwp_id=3722791 waiting for monitor entry [0x2f9ea000..0x2f9ea530] at org.apache.axis.utils.XMLUtils.releaseSAXParser(XMLUtils.java:283) - waiting to lock < 0x329fcf50 > (a java.lang.Class) at](https://image.slidesharecdn.com/bea-analysisslowdownandhangupinj2eeapplication-090316211333-phpapp02/85/Find-bottleneck-and-tuning-in-Java-Application-17-320.jpg)
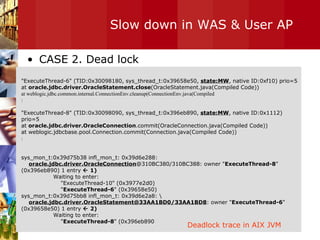
![Slow down in WAS & User AP CASE 3. Wait for IO Response "ExecuteThread: '42' for queue: 'default'" daemon prio=5 tid=0x3504b0 nid=0x34 runnable [0x9607e000..0x9607fc68] at java.net.SocketInputStream.socketRead(Native Method) at java.net.SocketInputStream.read(SocketInputStream.java:85) at oracle.net.ns.Packet.receive(Unknown Source) at oracle.net.ns.NetInputStream.getNextPacket(Unknown Source) at oracle.net.ns.NetInputStream.read(Unknown Source) at oracle.net.ns.NetInputStream.read(Unknown Source) at oracle.net.ns.NetInputStream.read(Unknown Source) at oracle.jdbc.ttc7.MAREngine.unmarshalUB1(MAREngine.java:730) at oracle.jdbc.ttc7.MAREngine.unmarshalSB1(MAREngine.java:702) at oracle.jdbc.ttc7.Oall7.receive(Oall7.java:373) at oracle.jdbc.ttc7.TTC7Protocol.doOall7(TTC7Protocol.java:1427) at oracle.jdbc.ttc7.TTC7Protocol.fetch(TTC7Protocol.java:911) at oracle.jdbc.driver.OracleStatement.doExecuteQuery(OracleStatement.java:1948) at oracle.jdbc.driver.OracleStatement.doExecuteWithTimeout(OracleStatement.java:2137) at oracle.jdbc.driver.OraclePreparedStatement.executeUpdate(OraclePreparedStatement.java:404) at oracle.jdbc.driver.OraclePreparedStatement.executeQuery(OraclePreparedStatement.java:344) at weblogic.jdbc.pool.PreparedStatement.executeQuery(PreparedStatement.java:51) at weblogic.jdbc.rmi.internal.PreparedStatementImpl.executeQuery(PreparedStatementImpl.java:56) at weblogic.jdbc.rmi.SerialPreparedStatement.executeQuery(SerialPreparedStatement.java:42) at com.XXXX 생략 at ……..](https://image.slidesharecdn.com/bea-analysisslowdownandhangupinj2eeapplication-090316211333-phpapp02/85/Find-bottleneck-and-tuning-in-Java-Application-23-320.jpg)

![Thanx [email_address]](https://image.slidesharecdn.com/bea-analysisslowdownandhangupinj2eeapplication-090316211333-phpapp02/85/Find-bottleneck-and-tuning-in-Java-Application-41-320.jpg)