


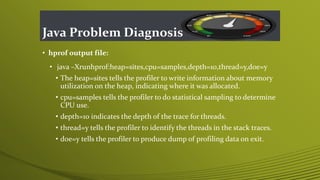
![Java Problem Diagnosis
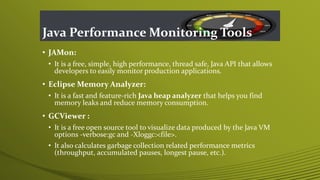
• Some of the diagnosis commands for GC and heap size issues…
• GC outputs:
• -verbose:gc , This flag starts printing additional lines to the console,
like given below
• [GC 65620K -> 50747K(138432K), 0.0279446 secs]
[Full GC 46577K -> 18794K(126848K), 0.2040139 secs]
Combined size of live objects before(young+tenured) GC -> Combined size of live
objects(young+tenured) after GC (Total heap size, not counting the space in the
permanent generation
-XX:+PrintHeapAtGC : More details -XX:+PrintGCTimeStamps will additionally
print a time stamp at the start of each collection.
111.042: [GC 111.042: [DefNew: 8128K->8128K(8128K), 0.0000505 secs]](https://image.slidesharecdn.com/javaperformancetuning-170328103419/85/Java-performance-tuning-13-320.jpg)

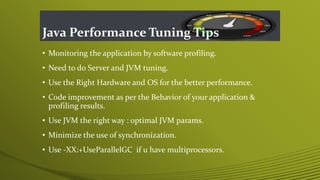
![Java Performance Tuning Tips
• GC parameters:
• -Xminf [0-1], -XX:MinHeapFreeRatio[0-100], sets the percentage of
minimum free heap space - controls heap expansion rate.
• -Xmaxf [0-1], -XX:MaxHeapFreeRatio[0-100], sets the percentage of
maximum free heap space - controls when the VM will return unused
heap memory to the OS.
• -XX:NewRatio, sets the ratio of the old and new generations in the
heap. A NewRatio of 5 sets the ratio of new to old at 1:5, making the
new generation occupy 1/6th of the overall heap.
• -XX:SurvivorRatio, sets the ratio of the survivor space to the eden in
the new object area. A SurvivorRatio of 6 sets the ratio of the three
spaces to 1:1:6, making each survivor space 1/8th of the new object
region.](https://image.slidesharecdn.com/javaperformancetuning-170328103419/85/Java-performance-tuning-16-320.jpg)


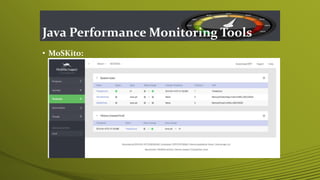


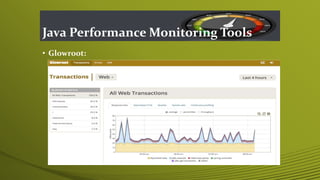


Java performance tuning involves diagnosing and addressing issues like slow application performance and out of memory errors. The document discusses Java performance problems and their solutions, tuning tips, and monitoring tools. Some tips include tuning JVM parameters like heap size, garbage collection settings, and enabling parallel garbage collection for multi-processor systems. Tools mentioned include JConsole, VisualVM, JProfiler, and others for monitoring memory usage, thread activity, and garbage collection.


![[Final] ReactJS presentation](https://cdn.slidesharecdn.com/ss_thumbnails/65cfd4f9-740f-4f41-b769-b496b6e60802-170119143904-thumbnail.jpg?width=640&height=640&fit=bounds)


![[Defcon Russia #29] Михаил Клементьев - Обнаружение руткитов в GNU/Linux](https://cdn.slidesharecdn.com/ss_thumbnails/revealingrootkitsv5-170328122611-thumbnail.jpg?width=640&height=640&fit=bounds)