Download as PDF, PPTX


![Java Flags
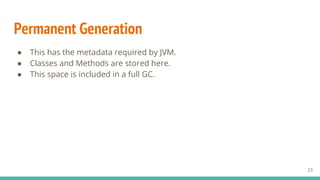
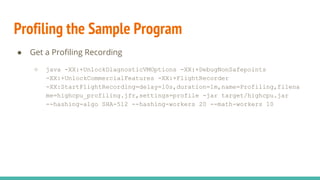
Java has a lot of tuning options:
$ java -XX:+UnlockCommercialFeatures -XX:+UnlockDiagnosticVMOptions -XX:+UnlockExperimentalVMOptions
-XX:+PrintFlagsFinal -version | head -n 10
[Global flags]
uintx AdaptiveSizeDecrementScaleFactor = 4 {product}
uintx AdaptiveSizeMajorGCDecayTimeScale = 10 {product}
uintx AdaptiveSizePausePolicy = 0 {product}
uintx AdaptiveSizePolicyCollectionCostMargin = 50 {product}
uintx AdaptiveSizePolicyInitializingSteps = 20 {product}
uintx AdaptiveSizePolicyOutputInterval = 0 {product}
uintx AdaptiveSizePolicyWeight = 10 {product}
uintx AdaptiveSizeThroughPutPolicy = 0 {product}
uintx AdaptiveTimeWeight = 25 {product}
java version "1.8.0_172"
Java(TM) SE Runtime Environment (build 1.8.0_172-b11)
Java HotSpot(TM) 64-Bit Server VM (build 25.172-b11, mixed mode)
36](https://image.slidesharecdn.com/softwareprofiling-20180530lecture-180606062037/85/Software-Profiling-Java-Performance-Profiling-and-Flamegraphs-36-320.jpg)


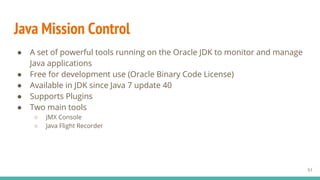


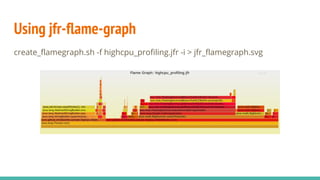


The document discusses software profiling, particularly in the context of Java applications, and emphasizes the importance of analyzing performance through profiling tools to identify and optimize bottlenecks. It covers various metrics like response time and throughput, different profiling techniques, Java garbage collection processes, and tools available for monitoring and managing Java applications. Additionally, it highlights Java Flight Recorder (JFR) for continuous event collection, providing insights into application performance with minimal overhead.


![Lect 1 Number systems and base conversions. [Autosaved].pptx](https://cdn.slidesharecdn.com/ss_thumbnails/lect1numbersystemsandbaseconversions-260111134109-67c2d865-thumbnail.jpg?width=640&height=640&fit=bounds)


