Download as PDF, PPTX


![47
action state
: CertificateOfOccupancy
[completed]
object flow
Select site
Commission
architect
Develop plan
Bid plan
Do site work( ) Do trade work( )
Finish
construction
initial state
sequential branch/decision
[not accepted]
[else]
final state
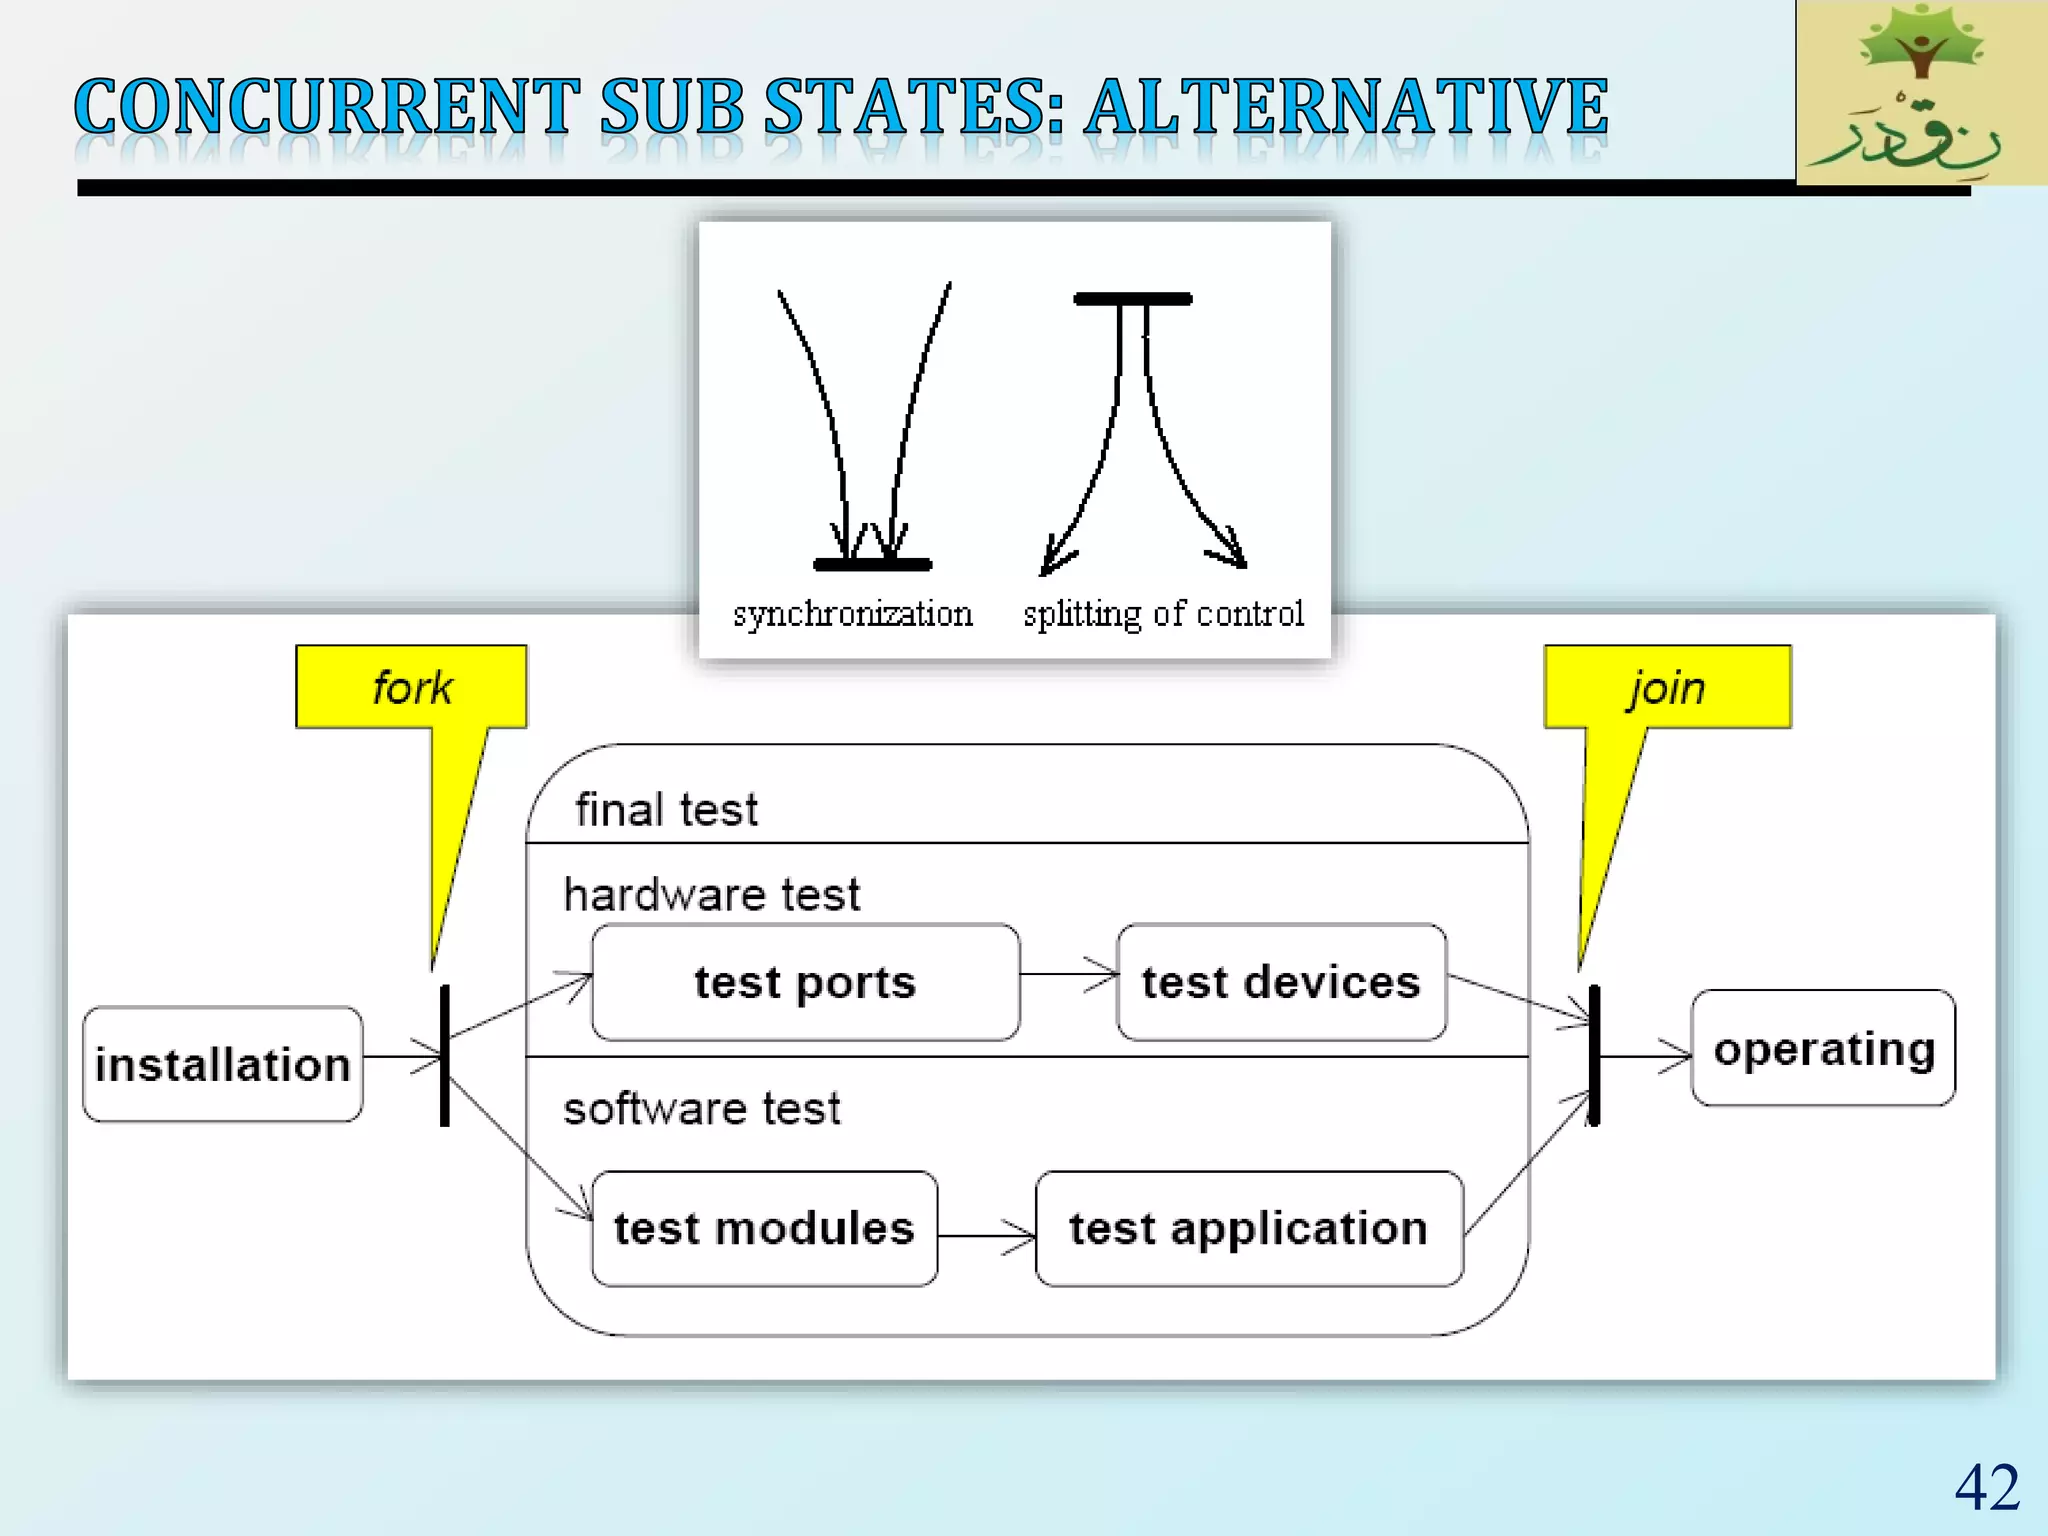
concurrent fork
activity state with submachine
concurrent join
triggerless transition
guard expression
optional
0..*
AND
one incoming, several outgoing](https://image.slidesharecdn.com/selec09umlbehaviourdiagrams-161111190019/75/SE_Lec-09_-UML-Behaviour-Diagrams-47-2048.jpg)


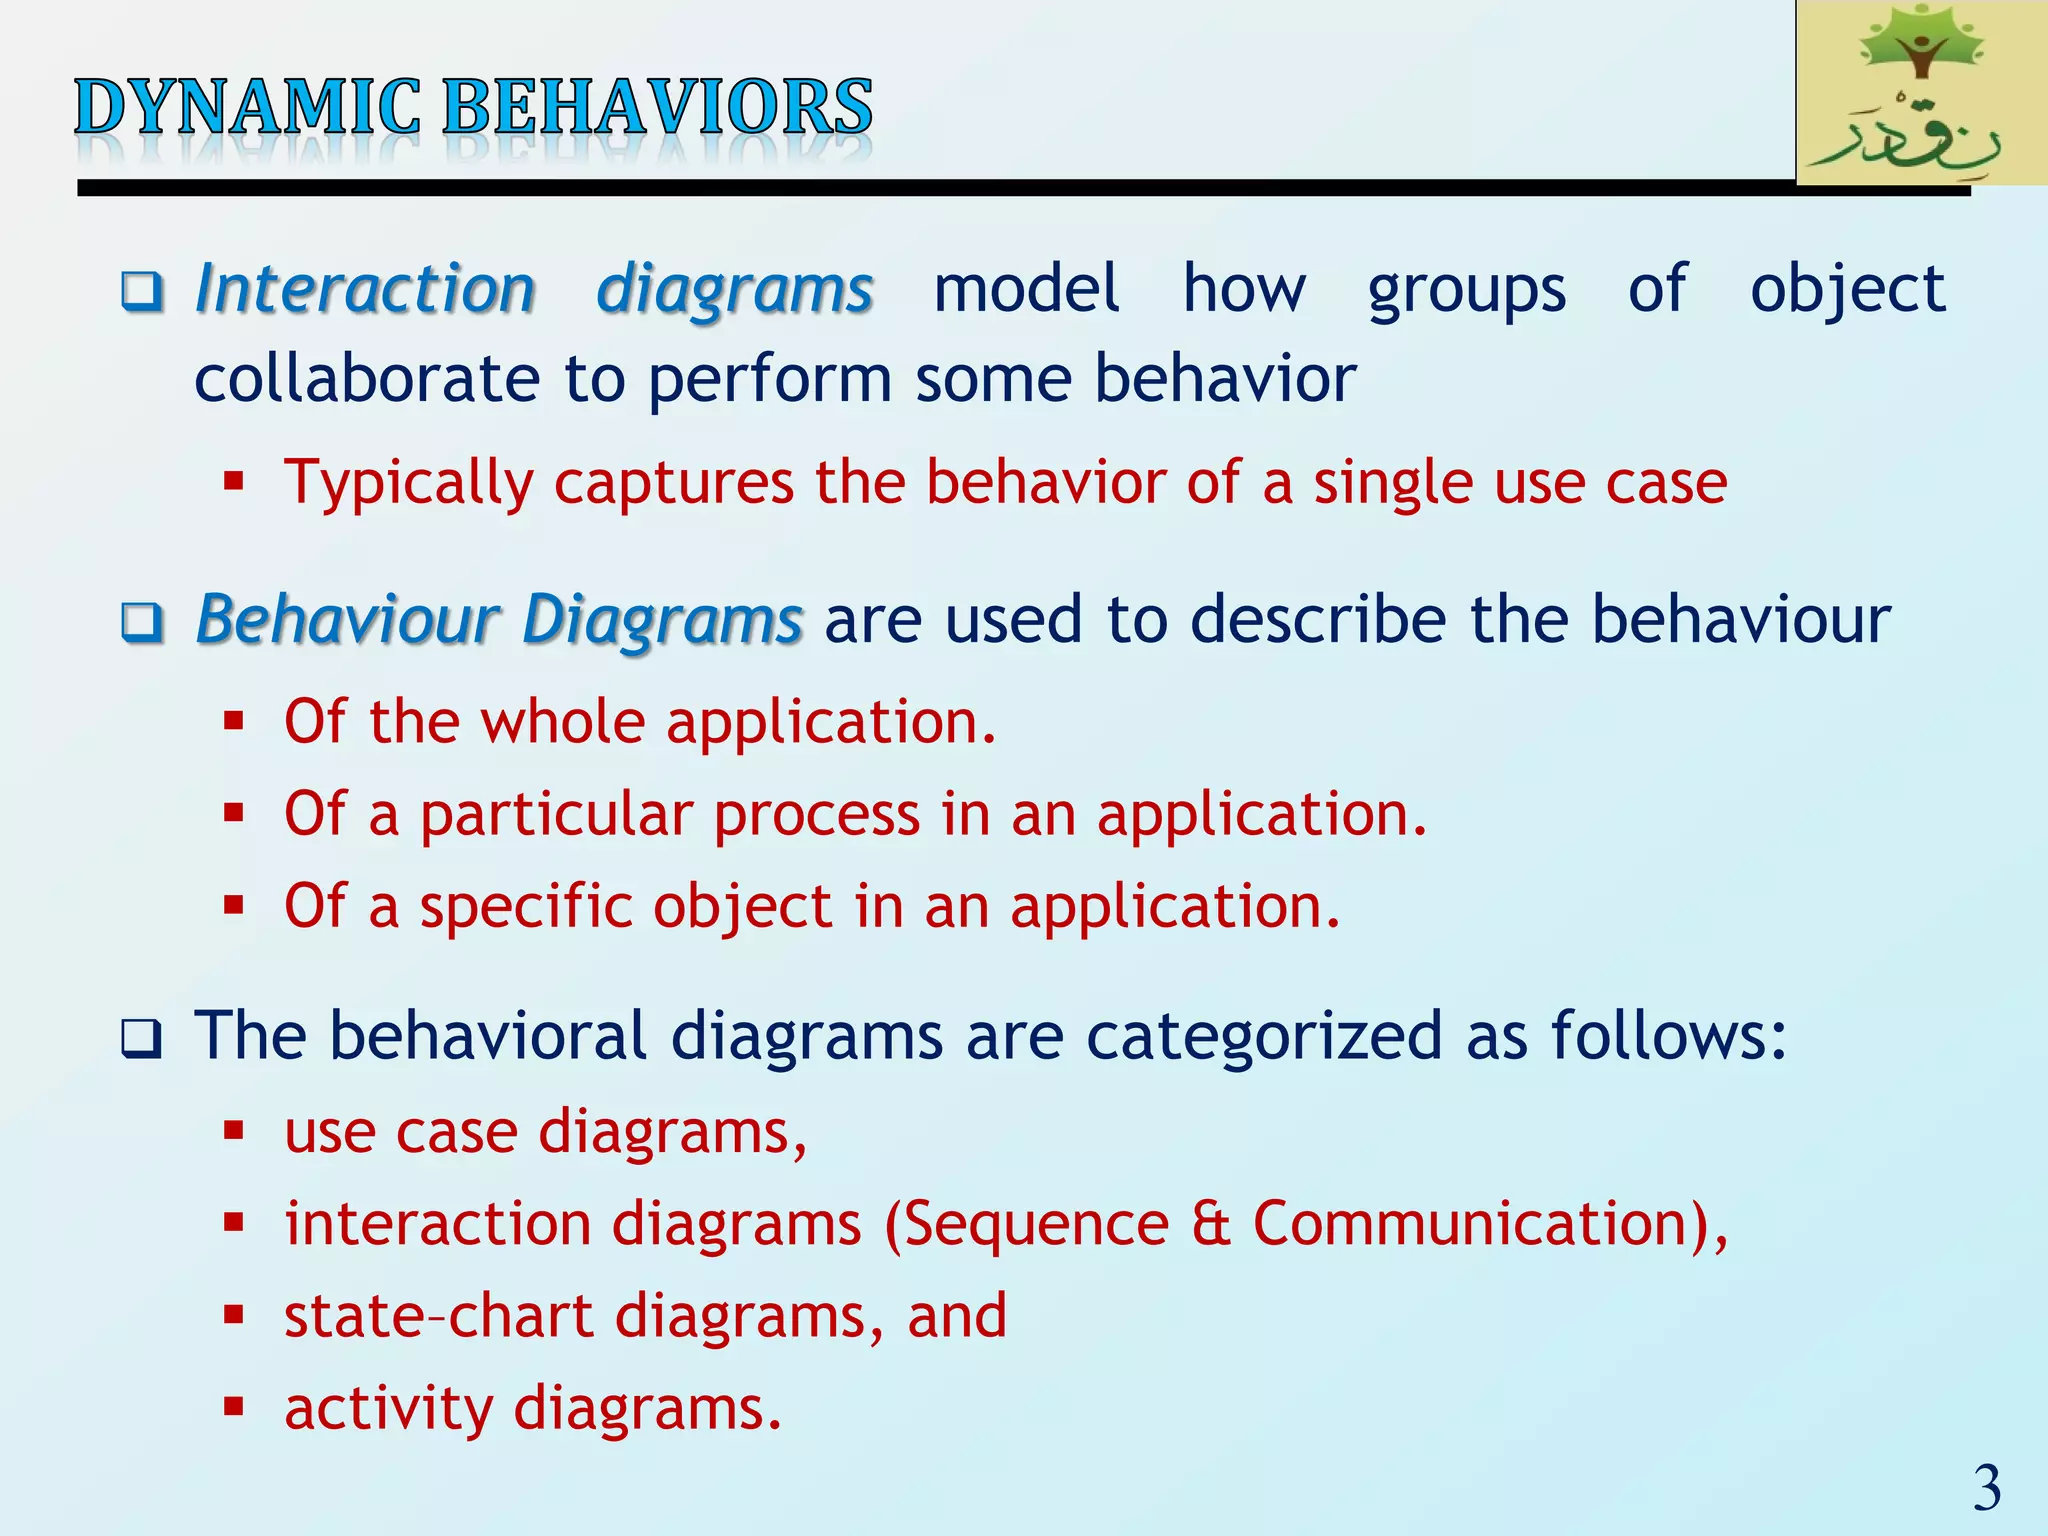
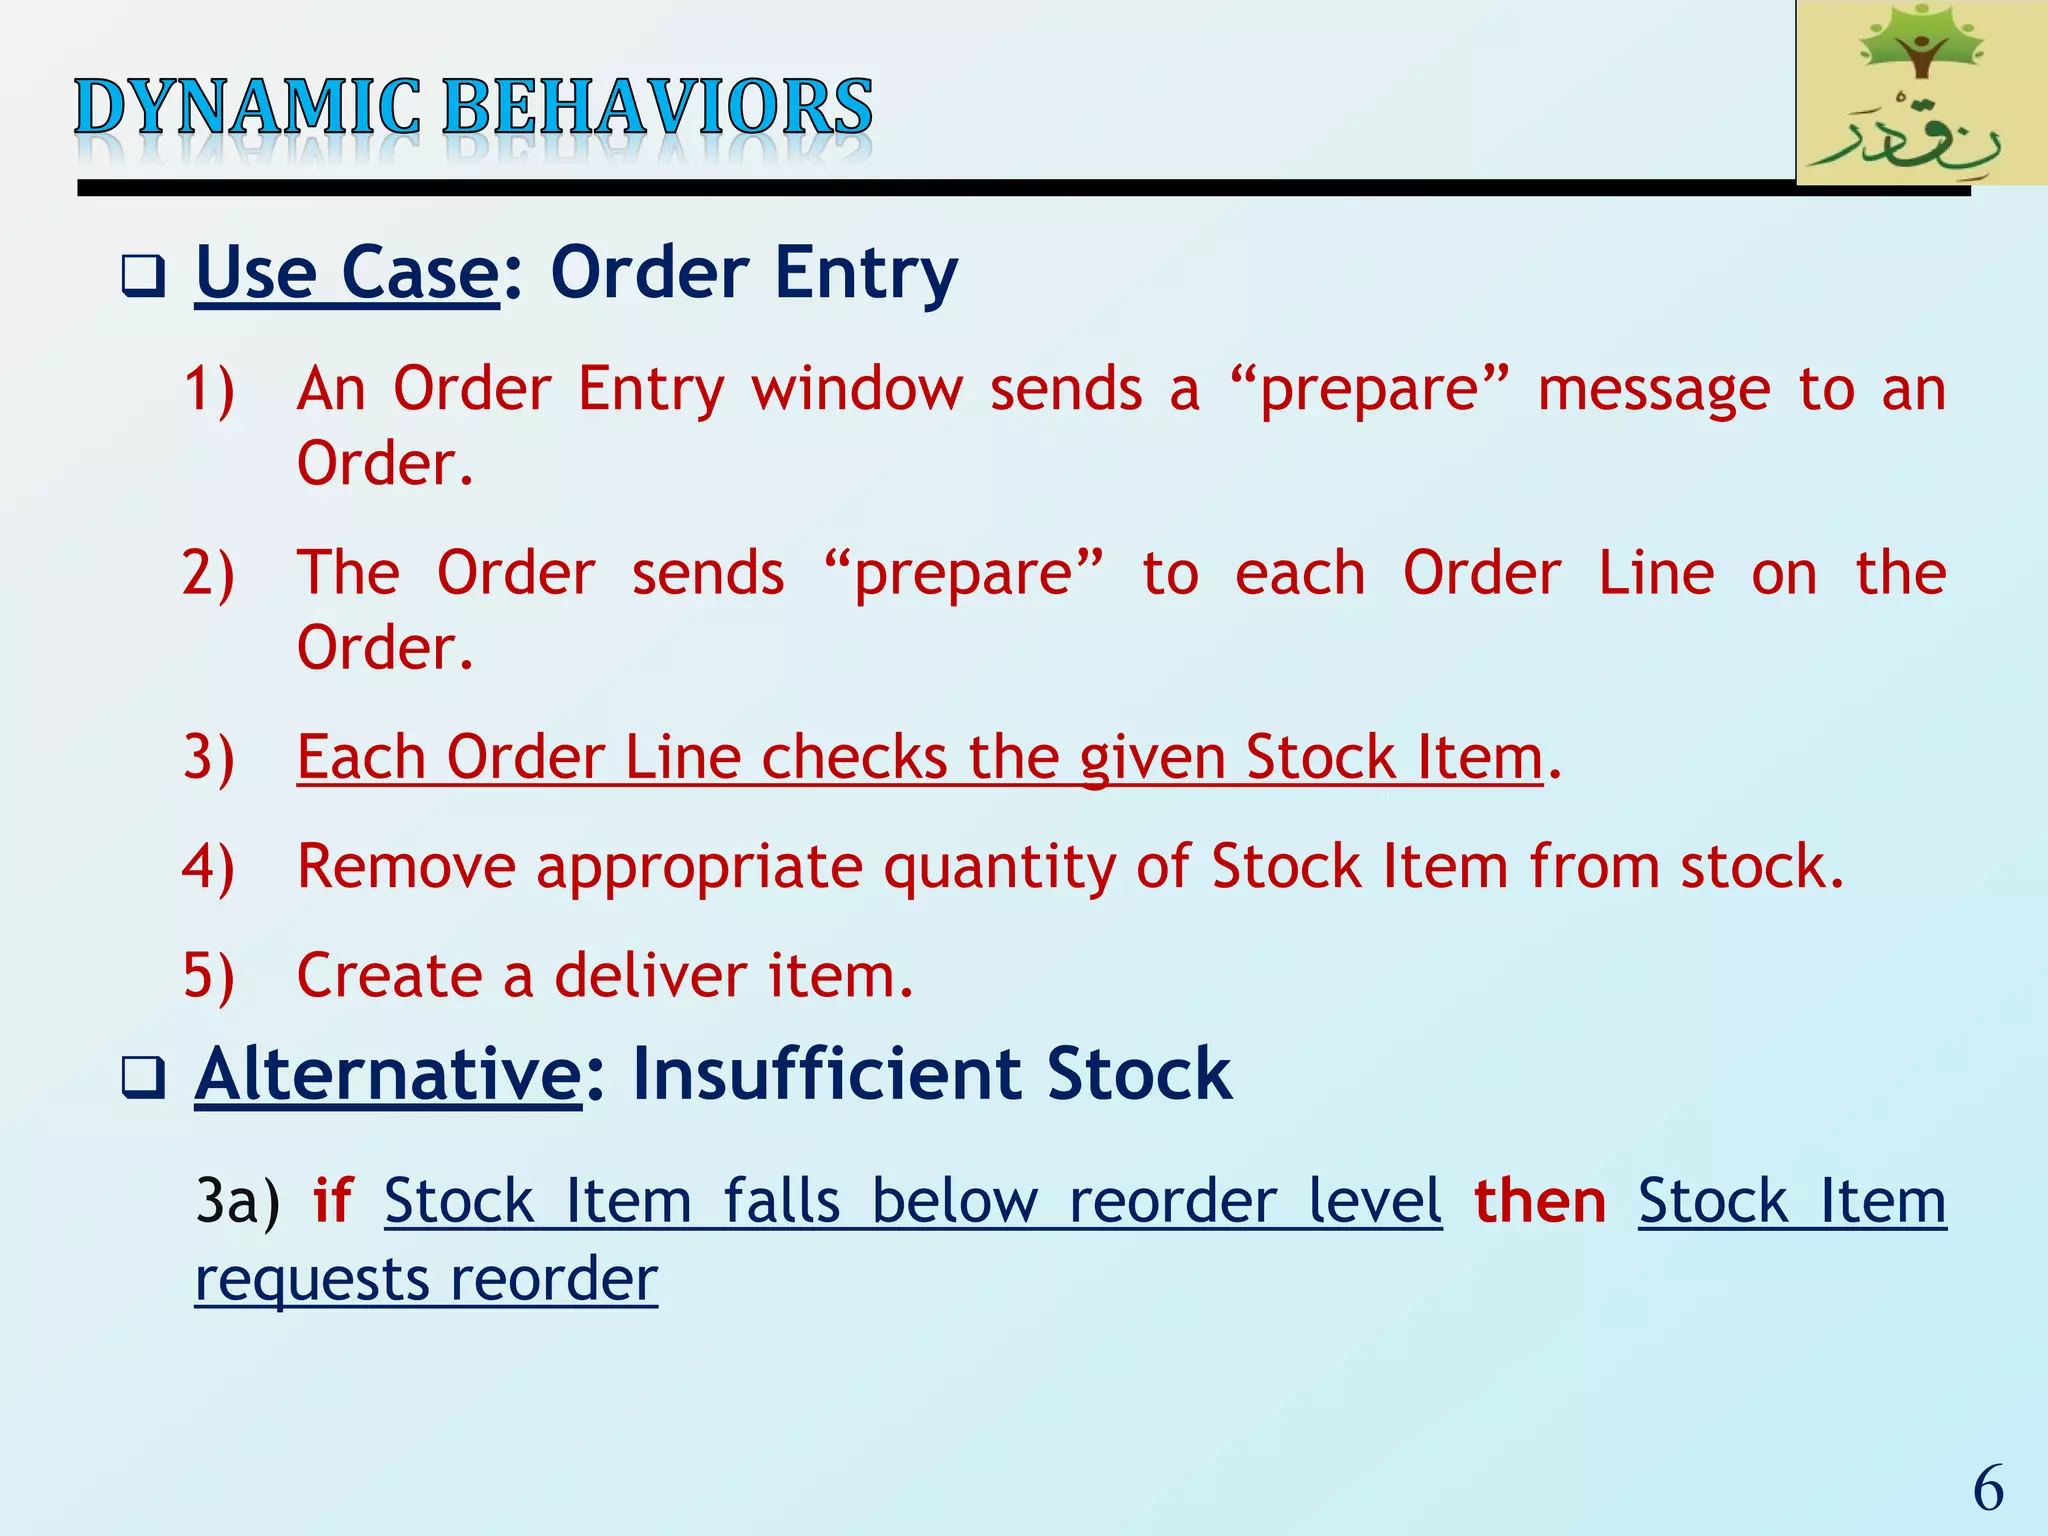
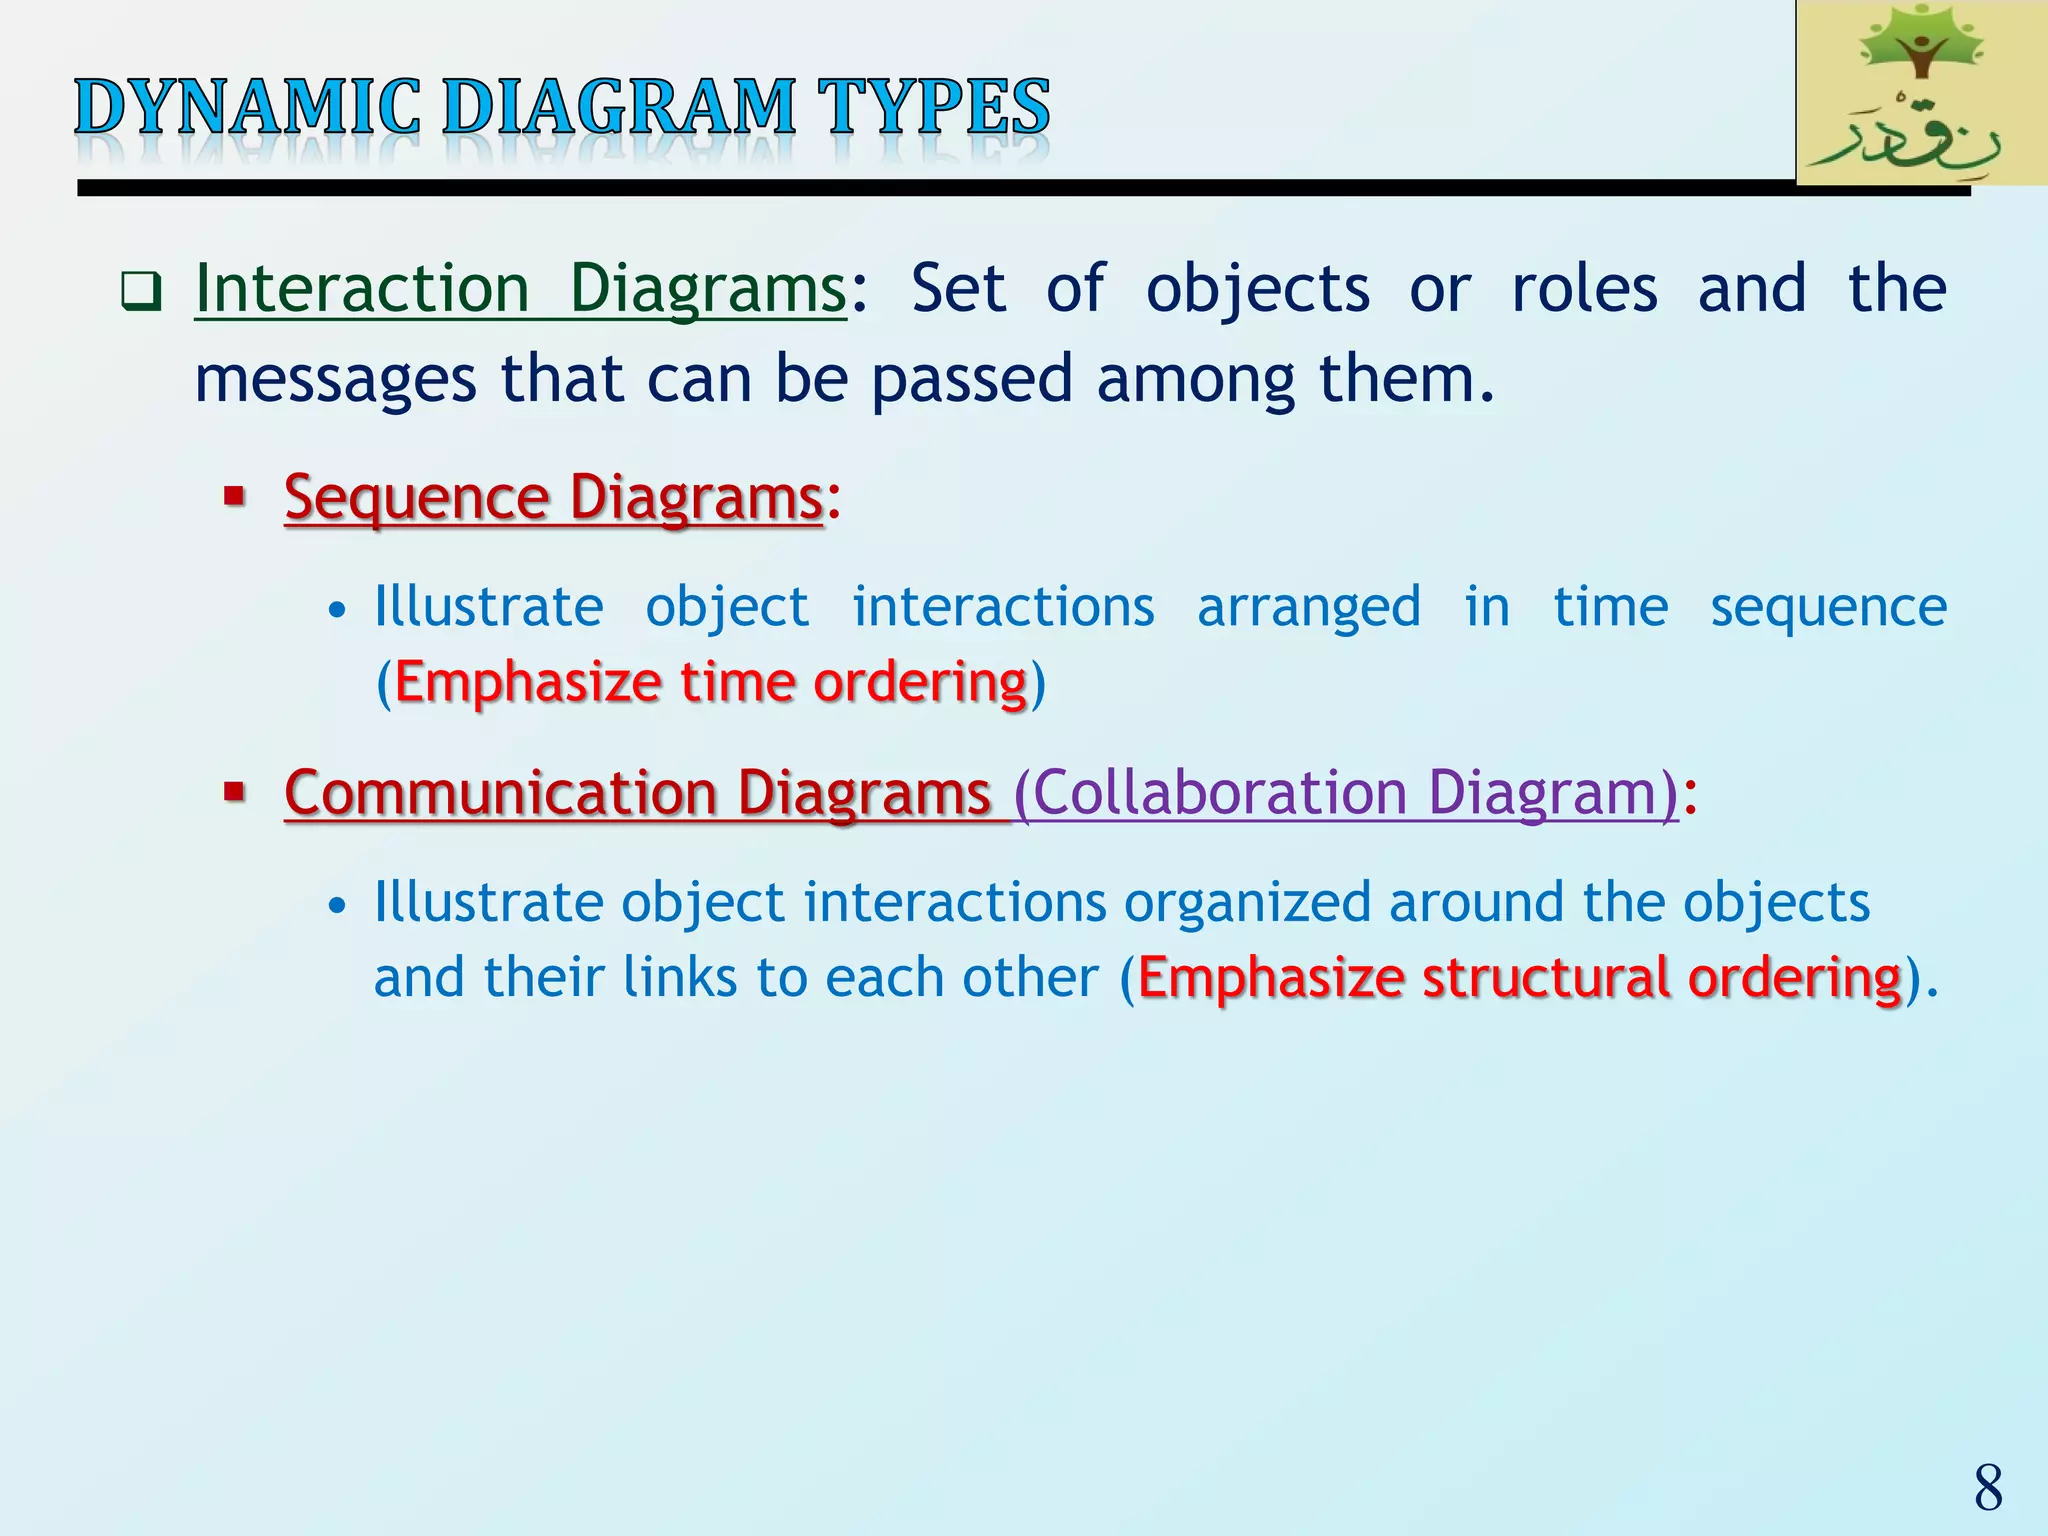
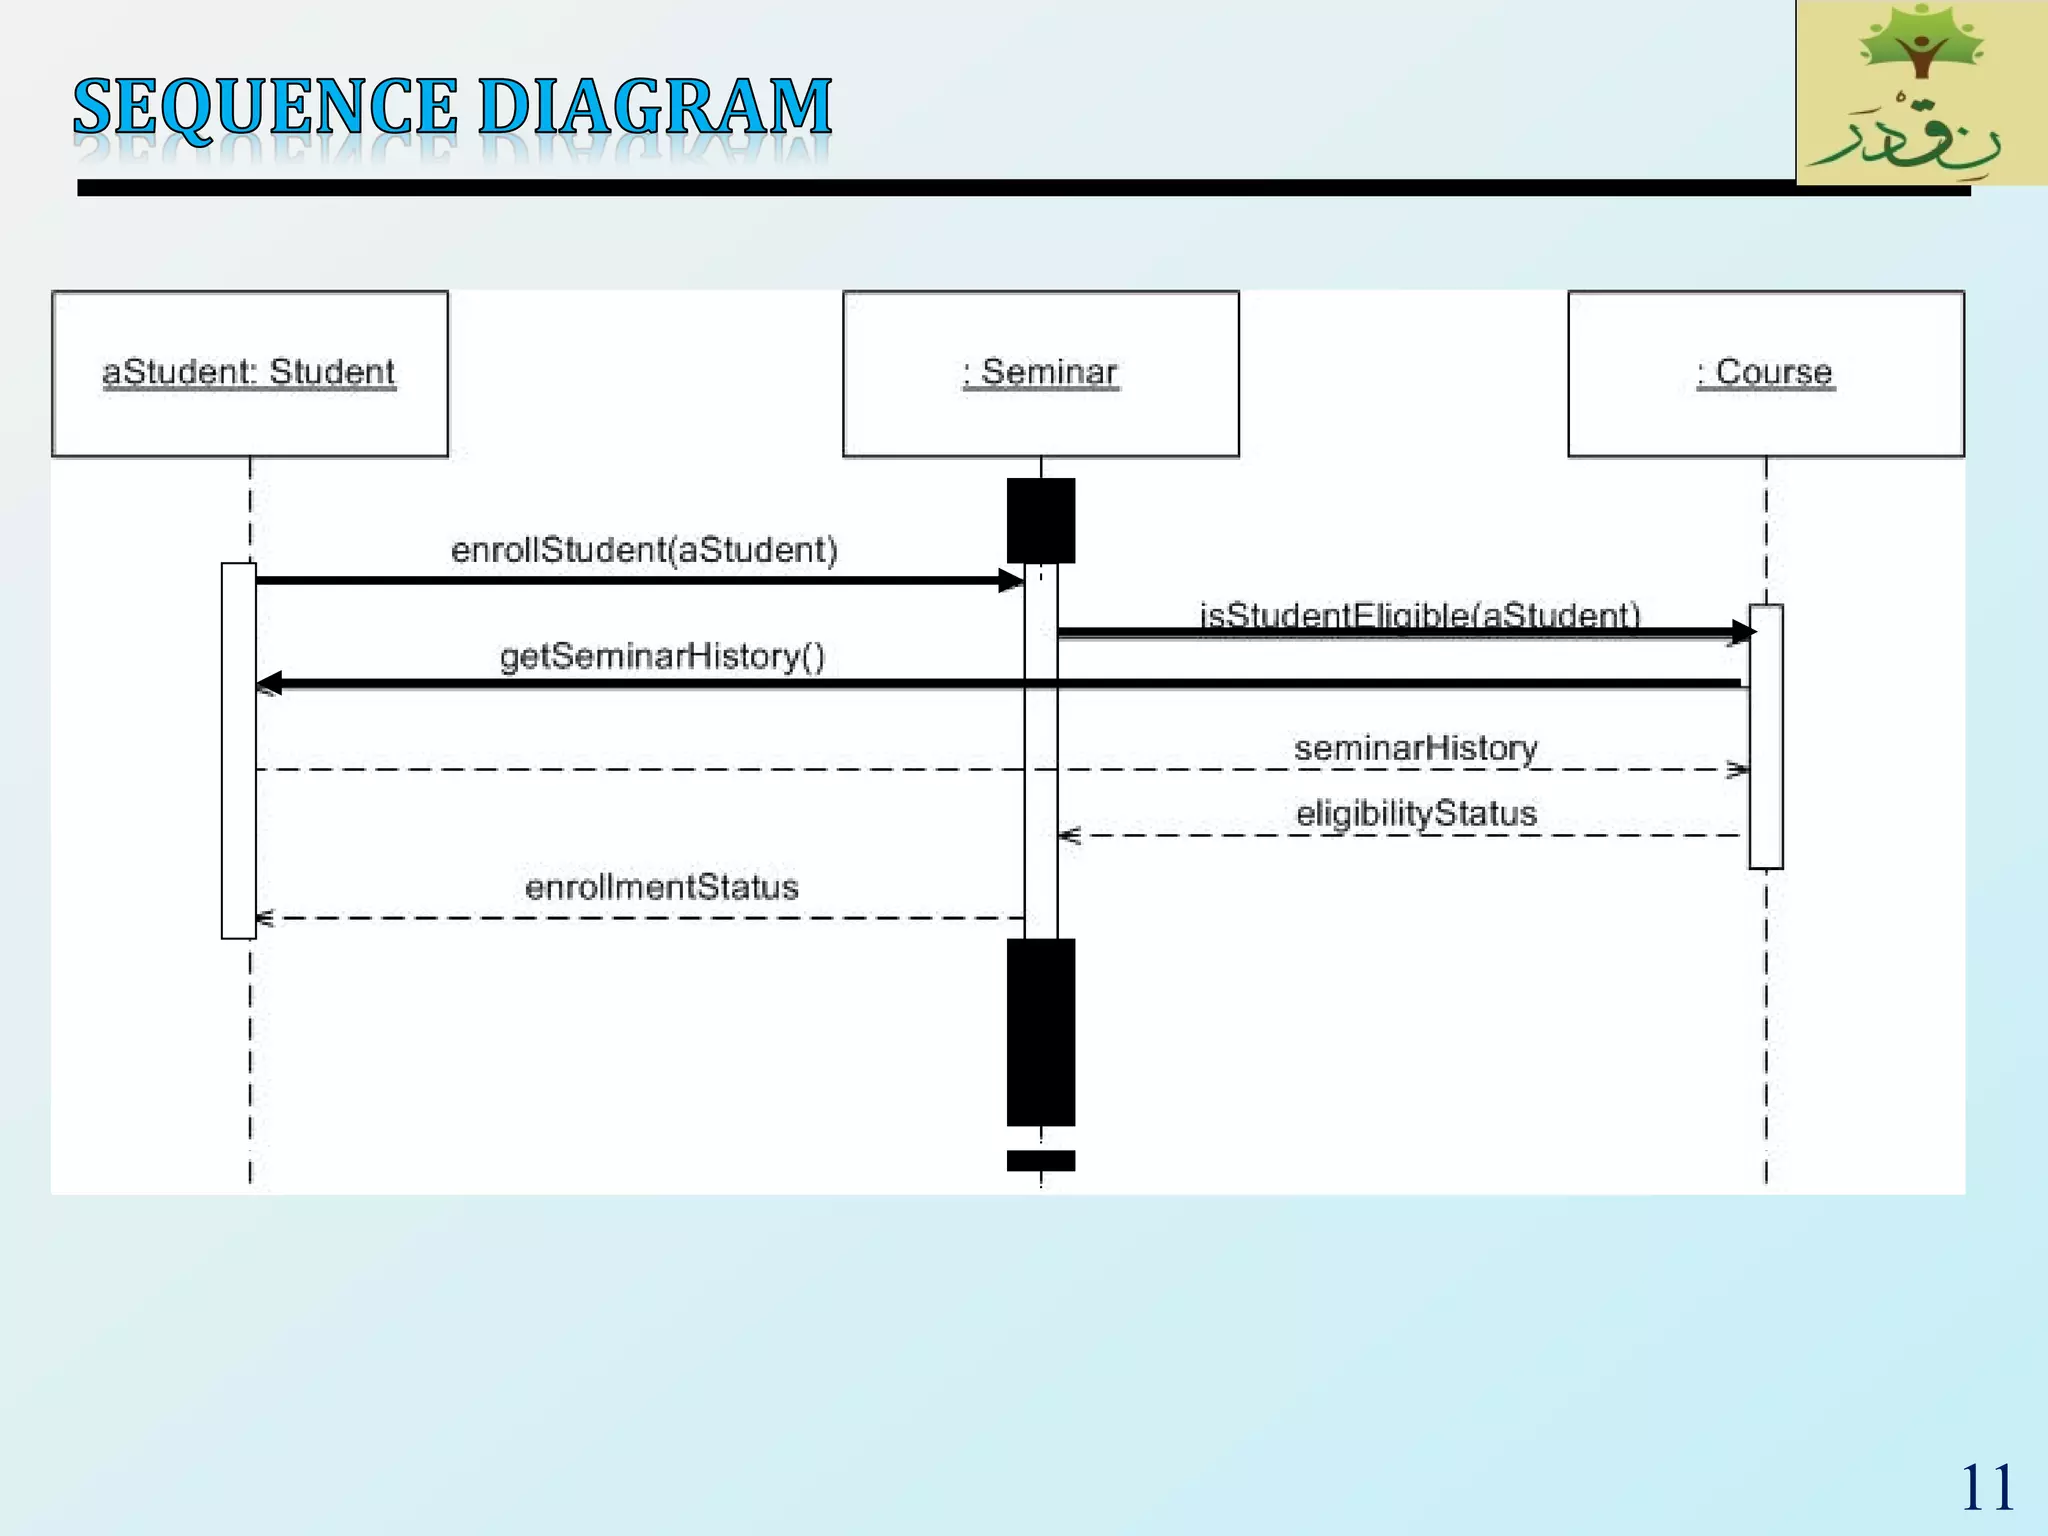
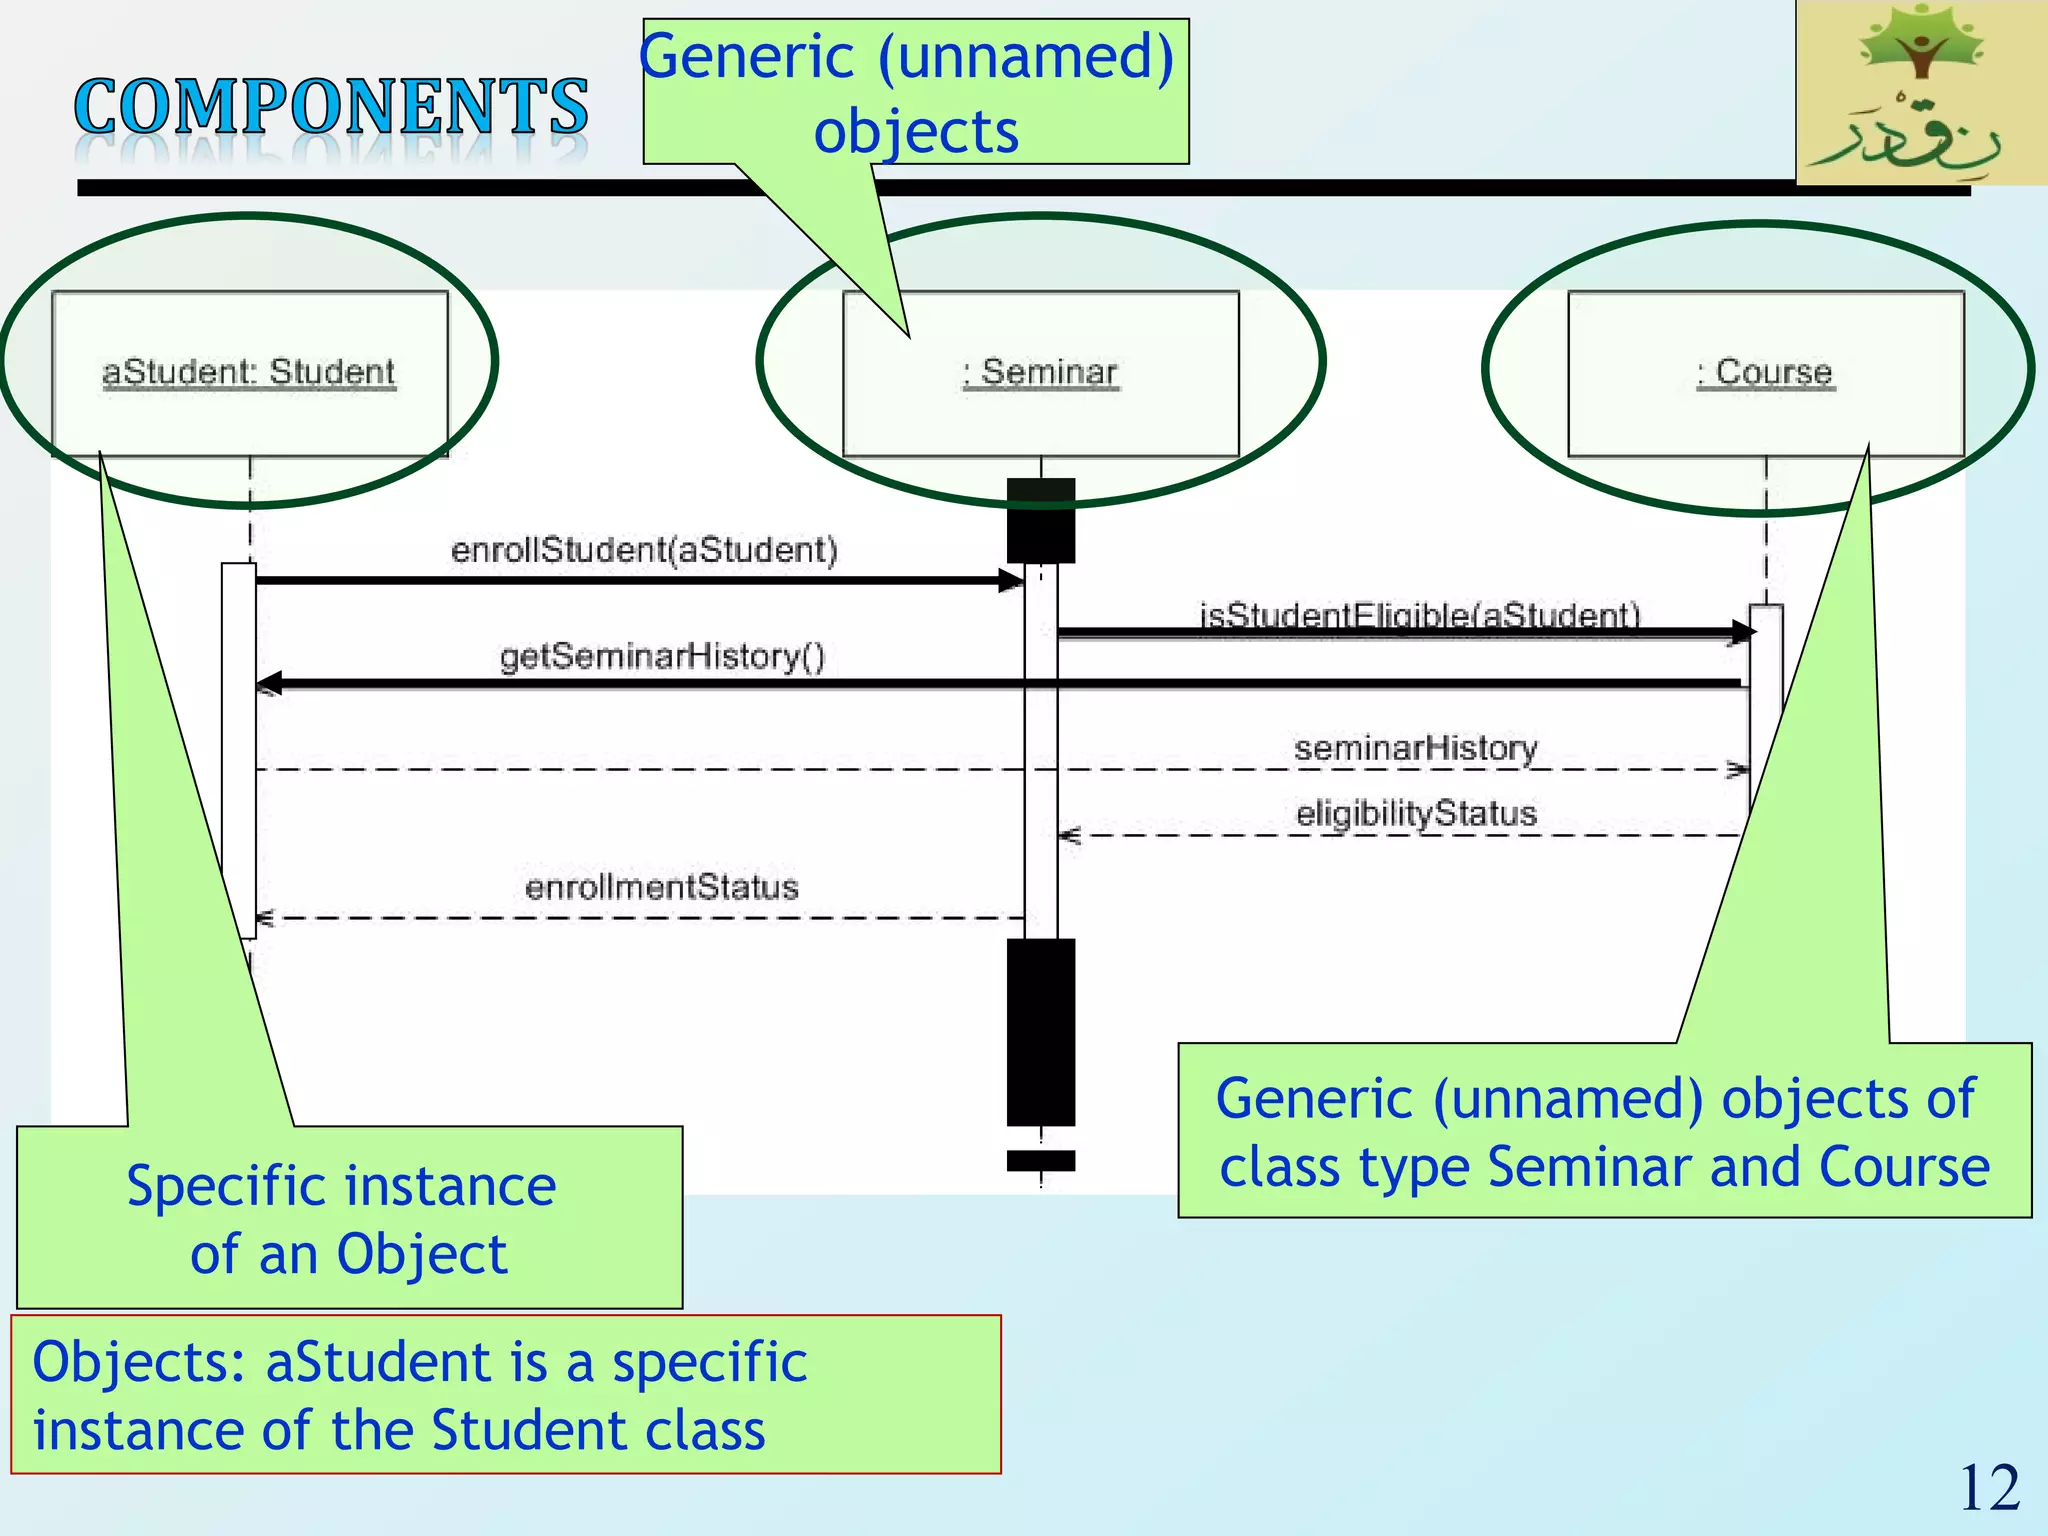
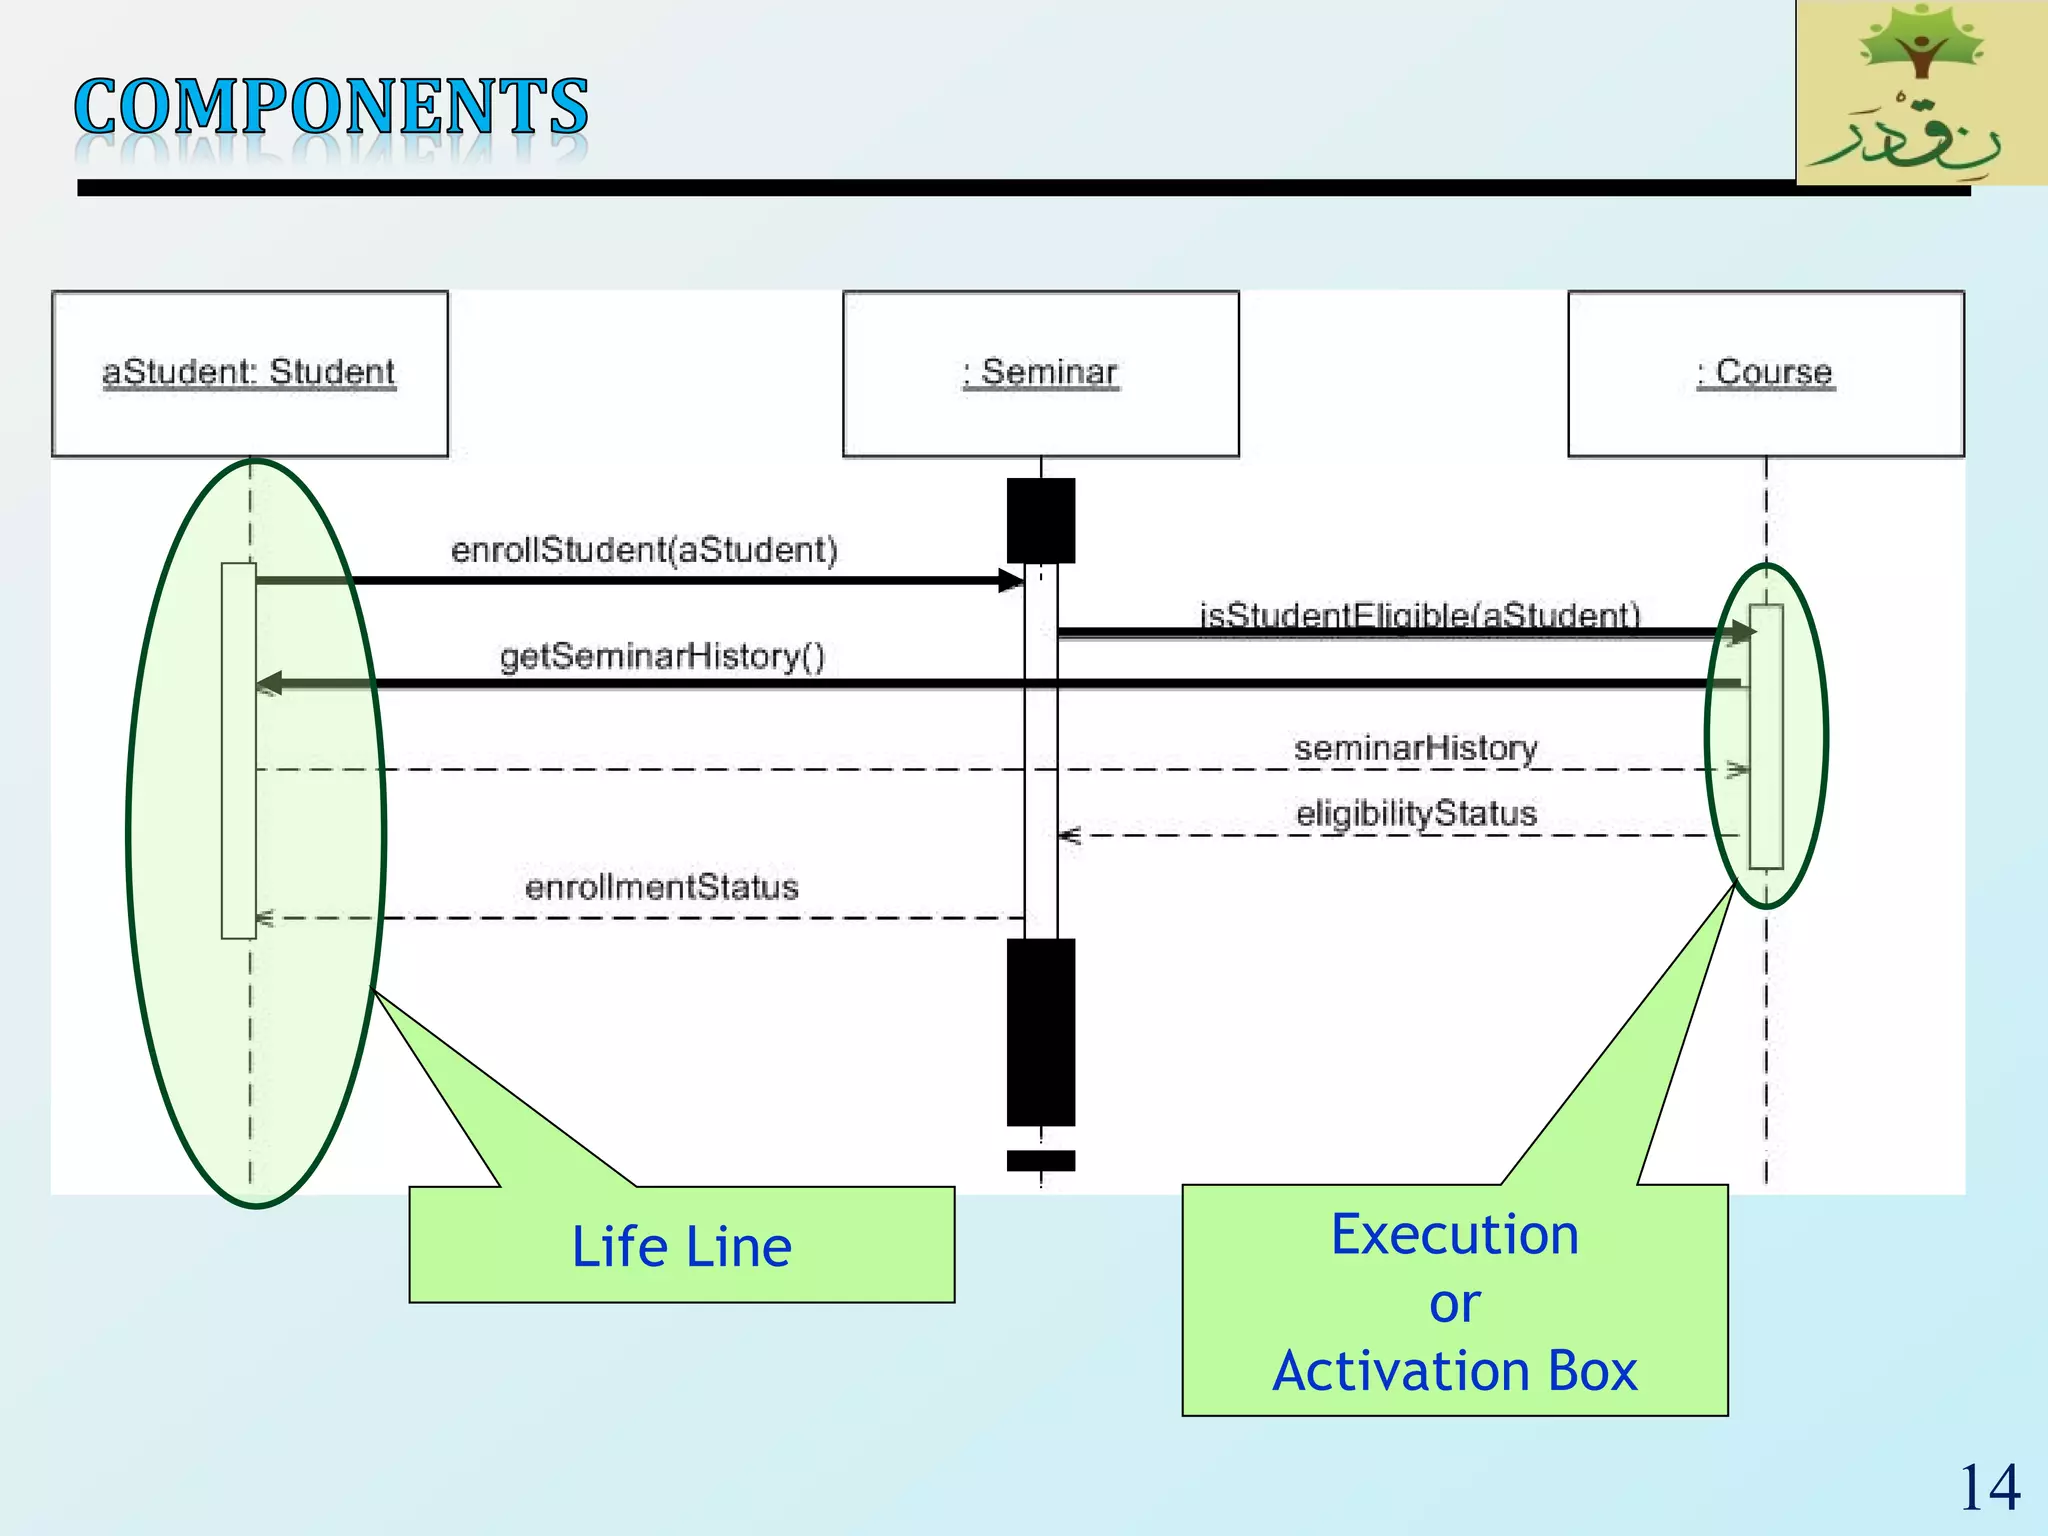
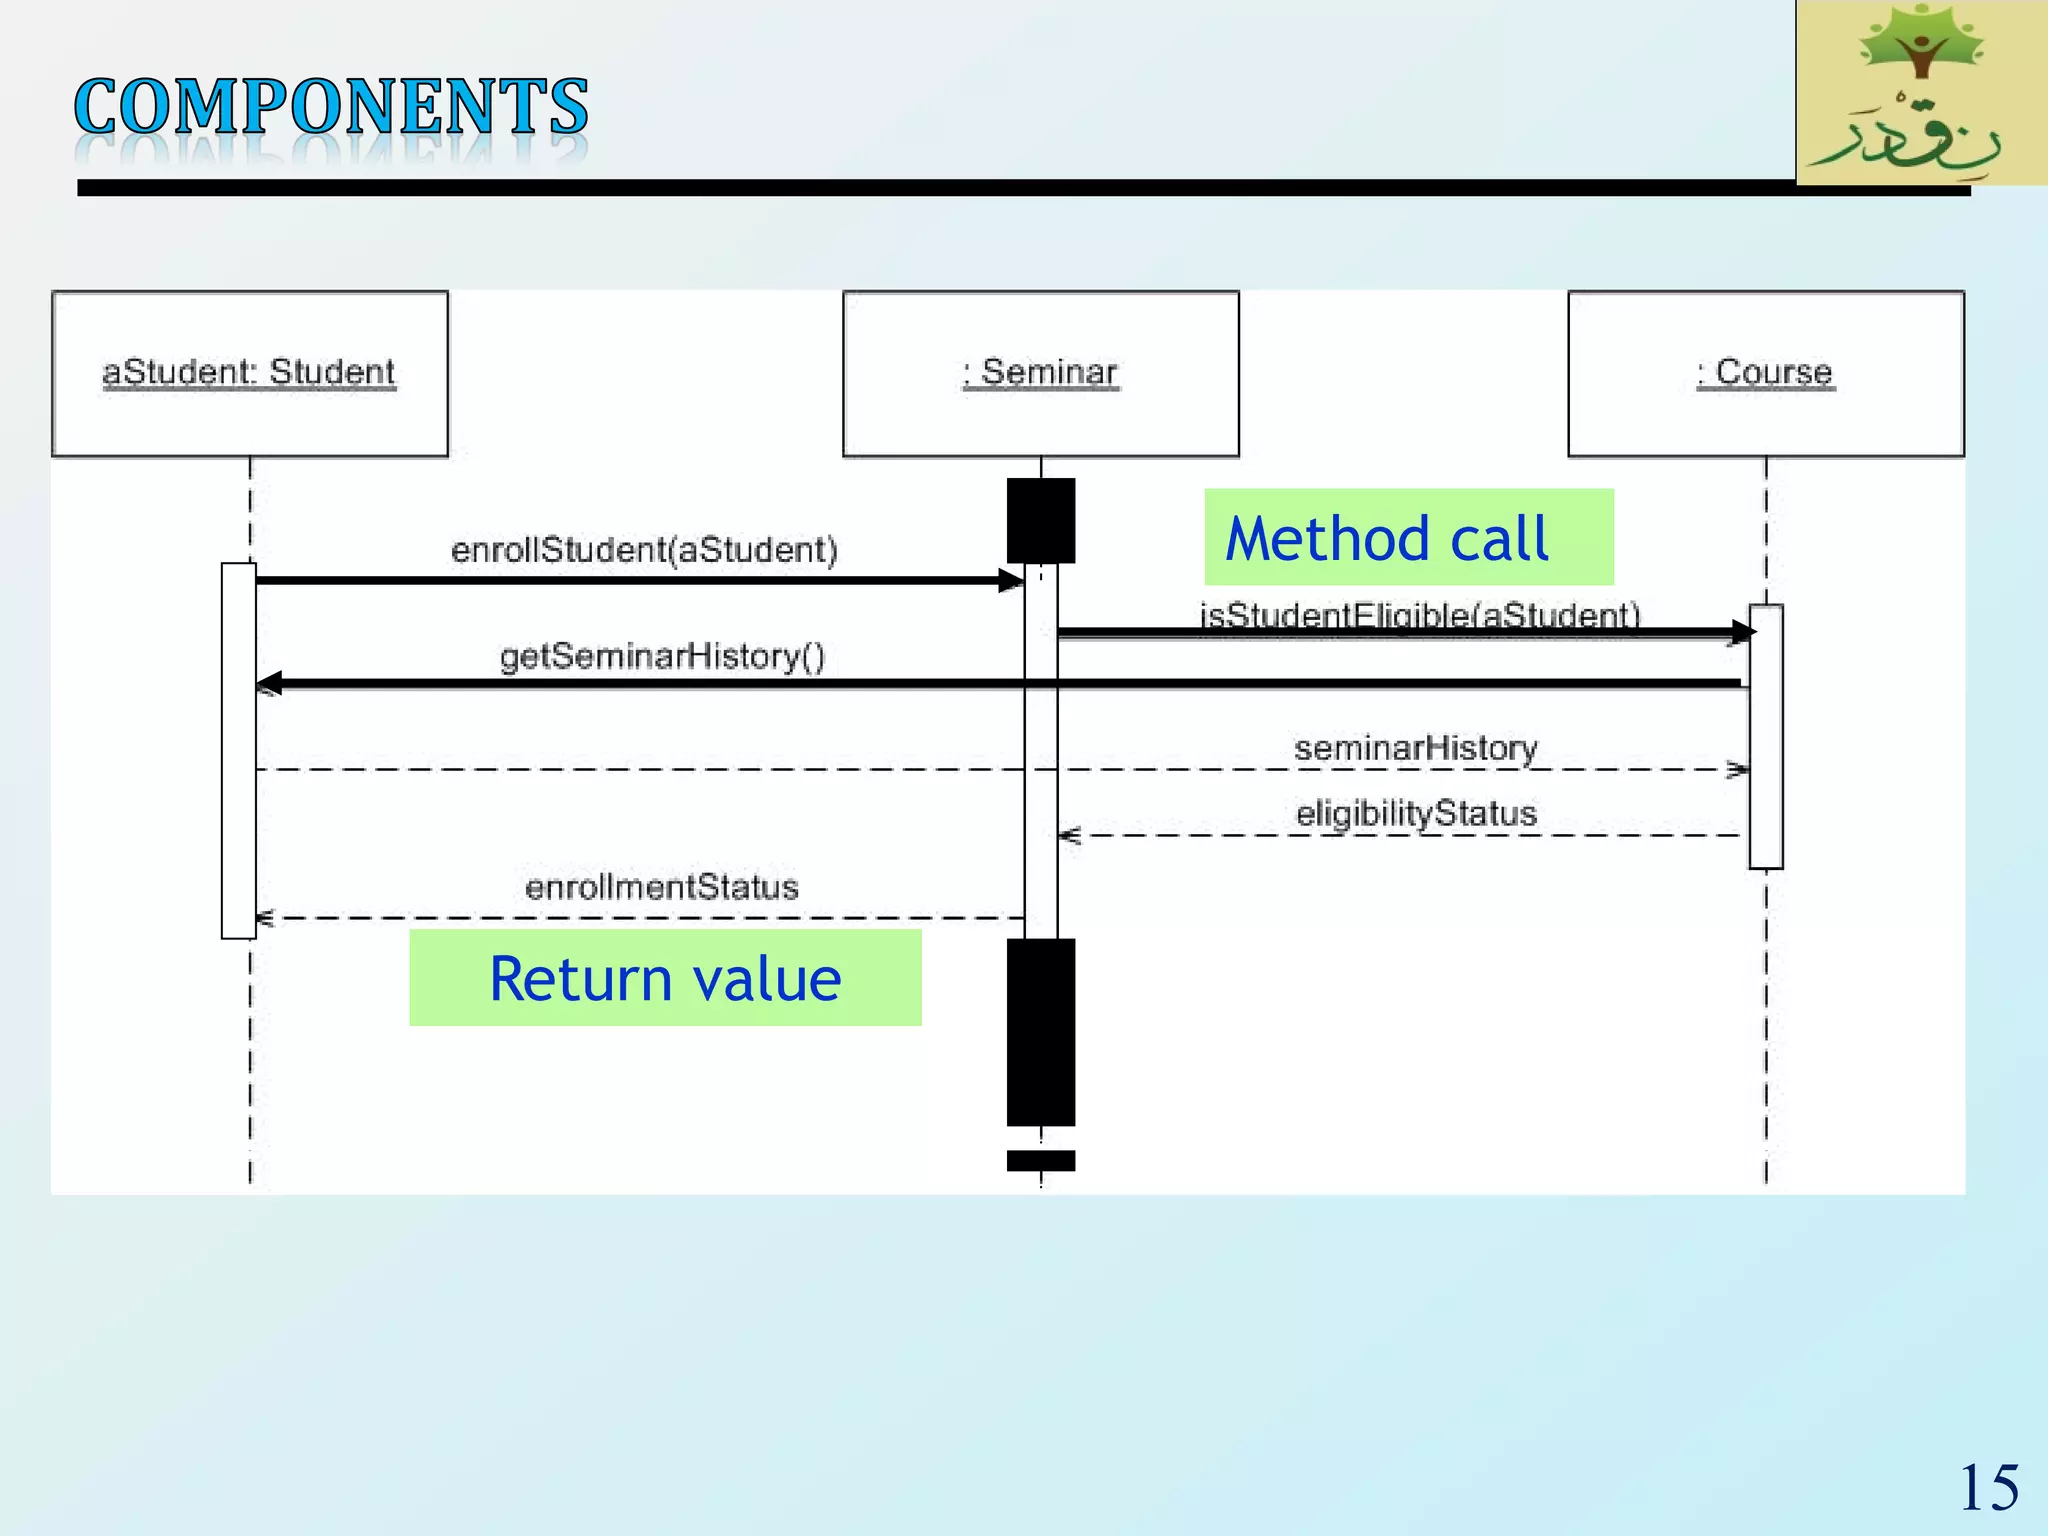
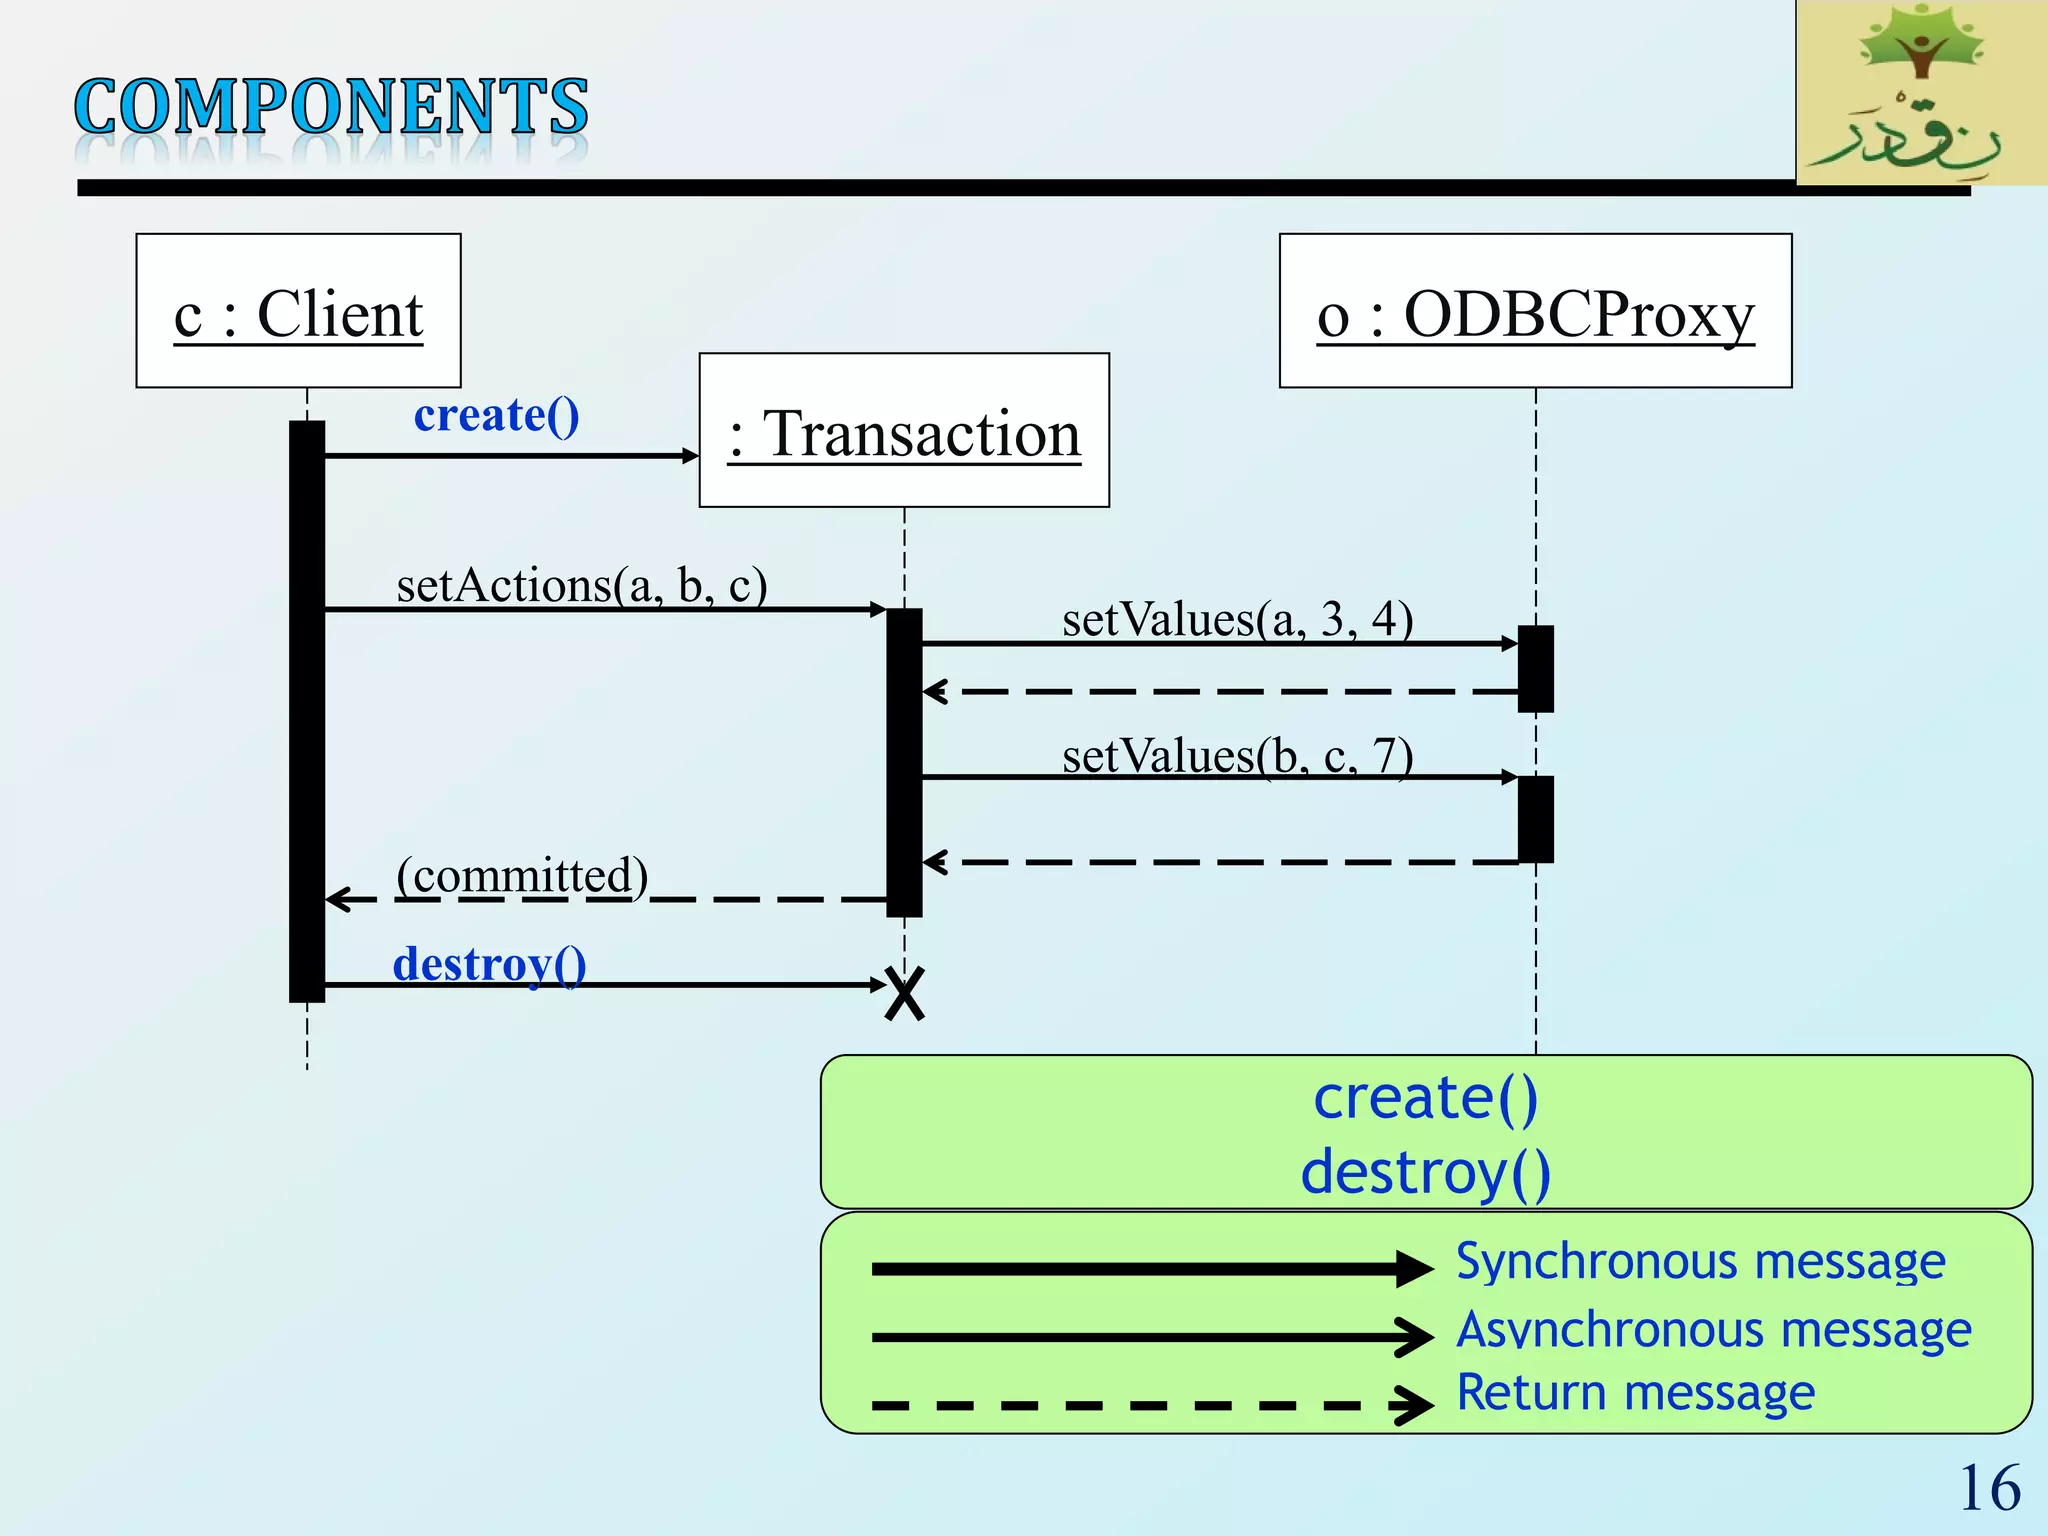
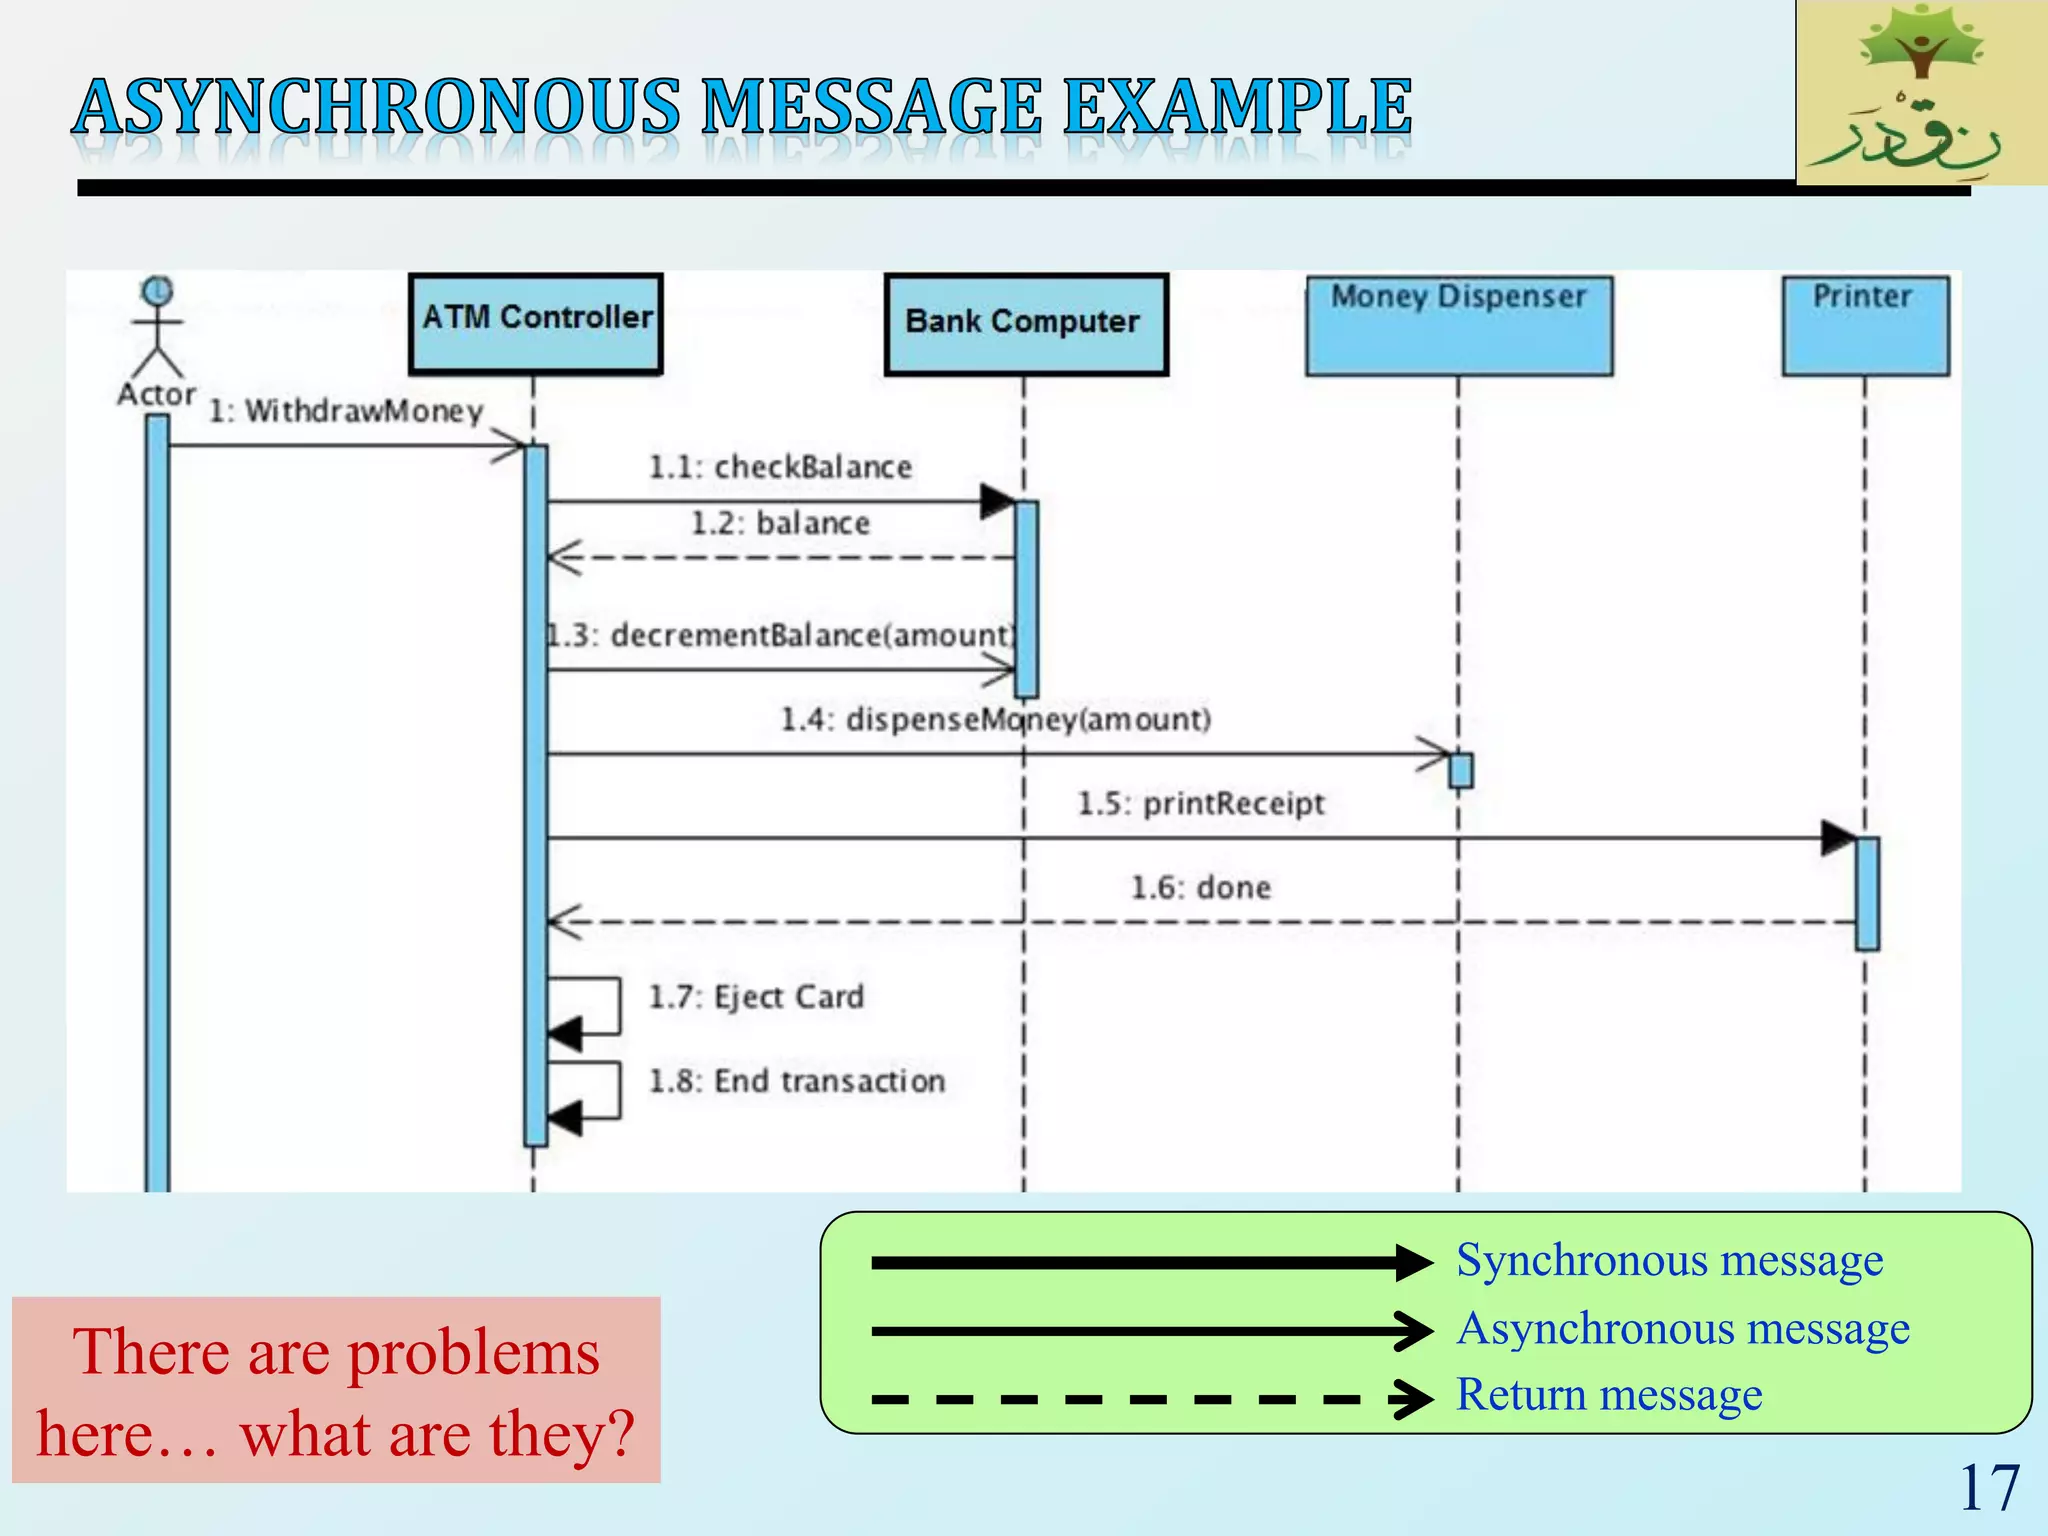
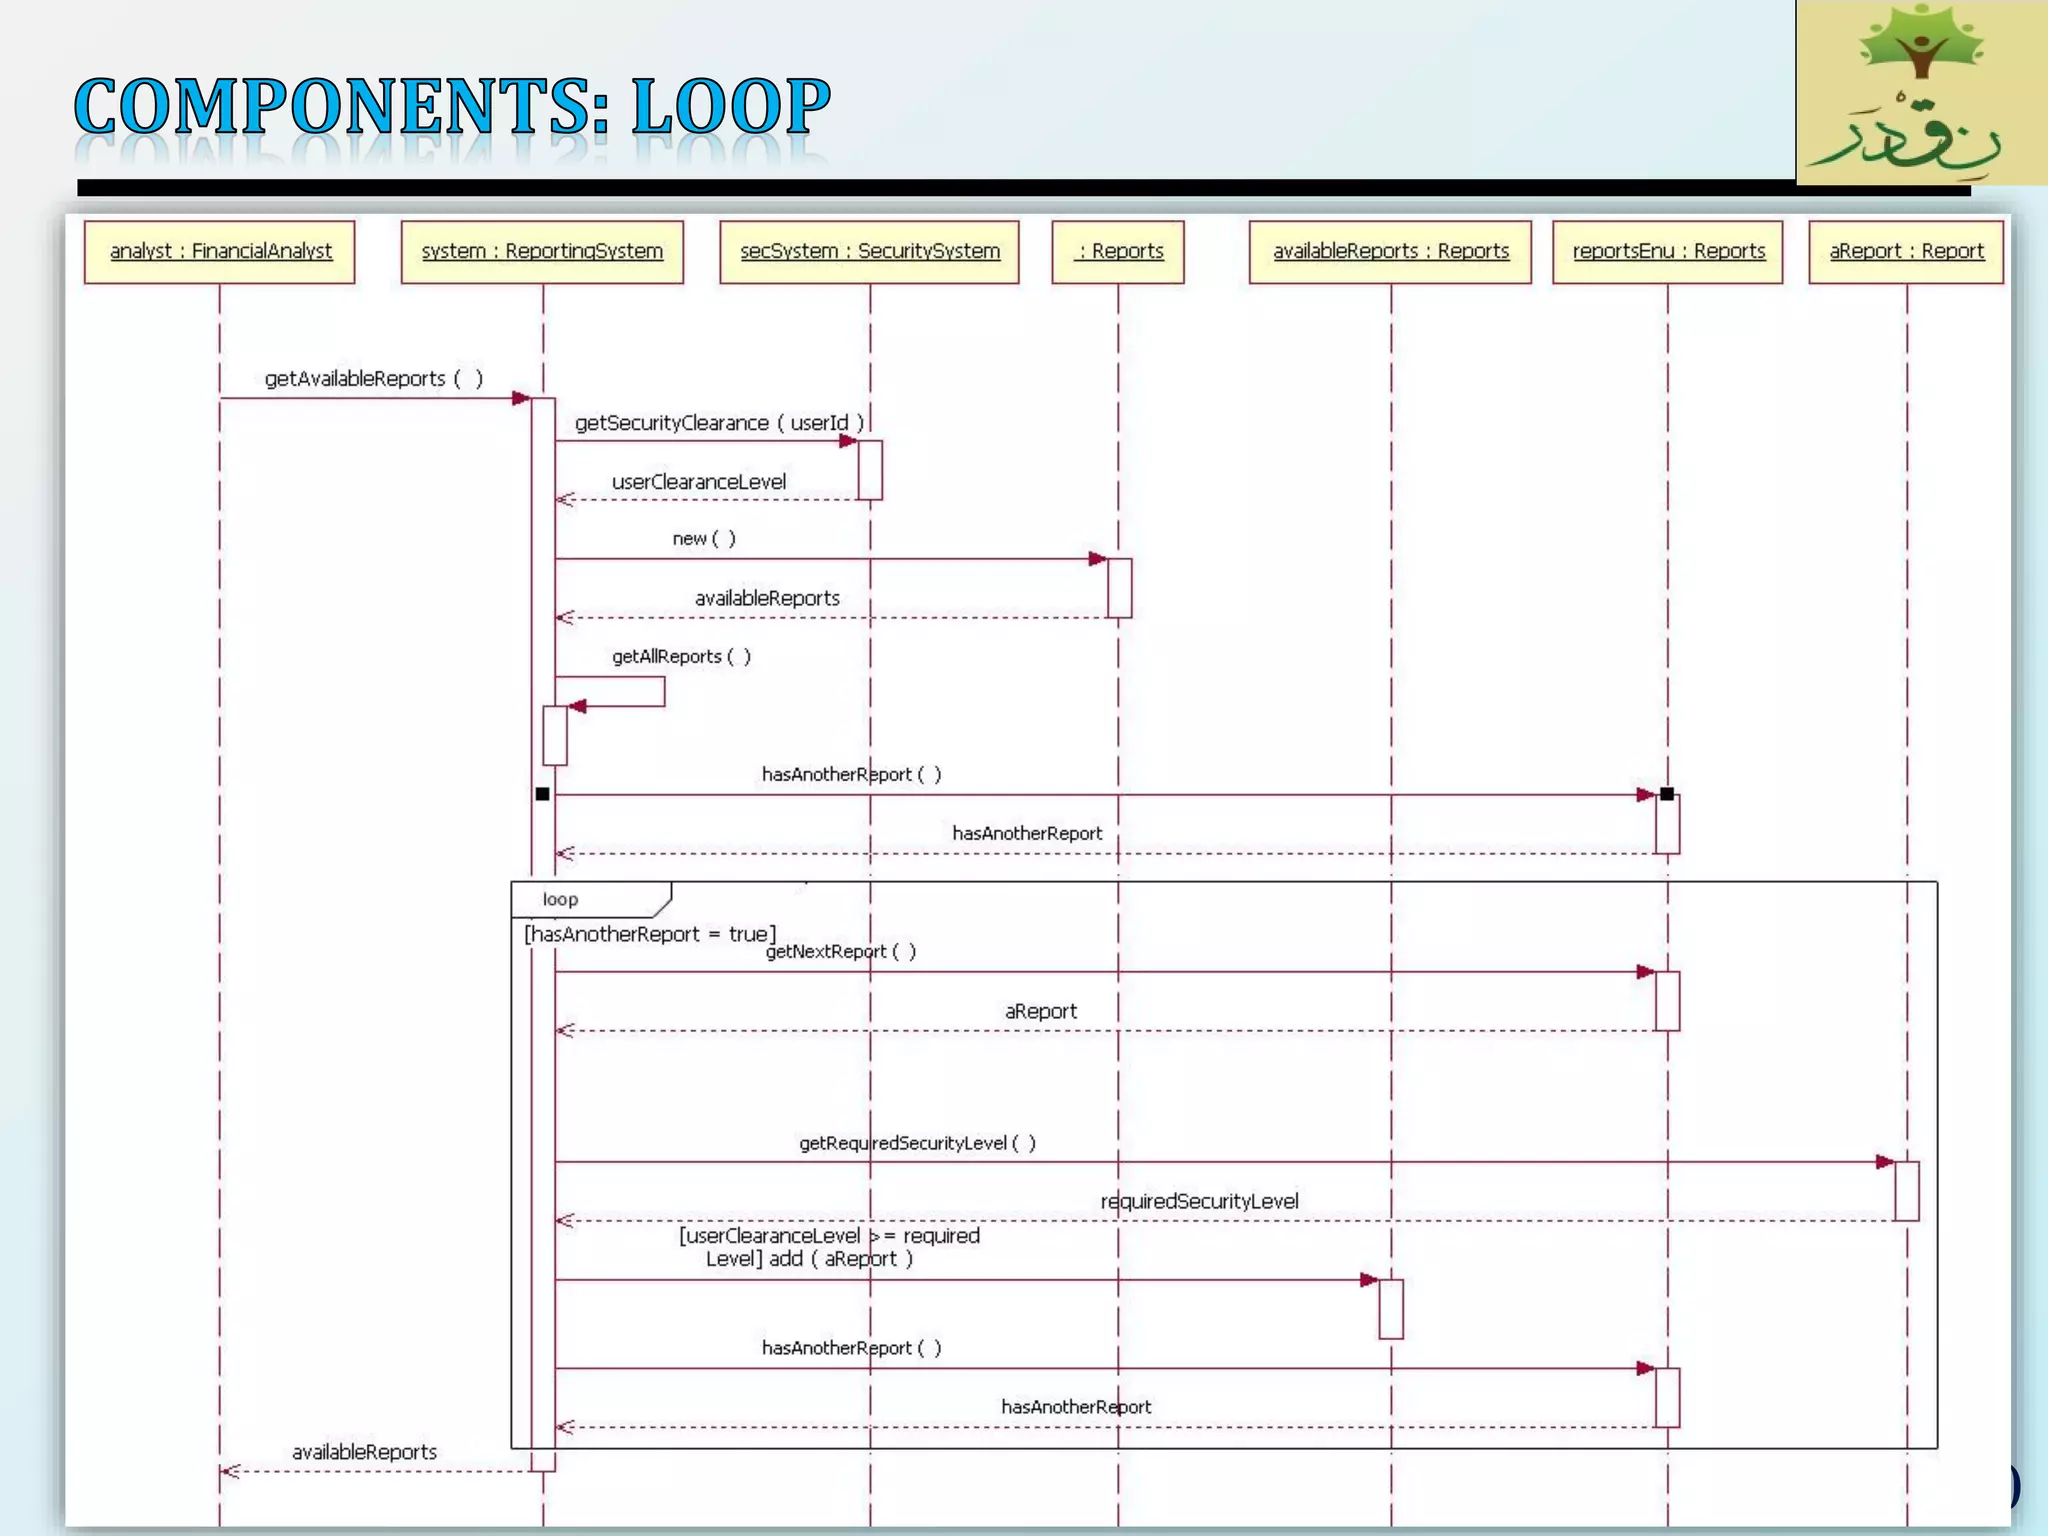
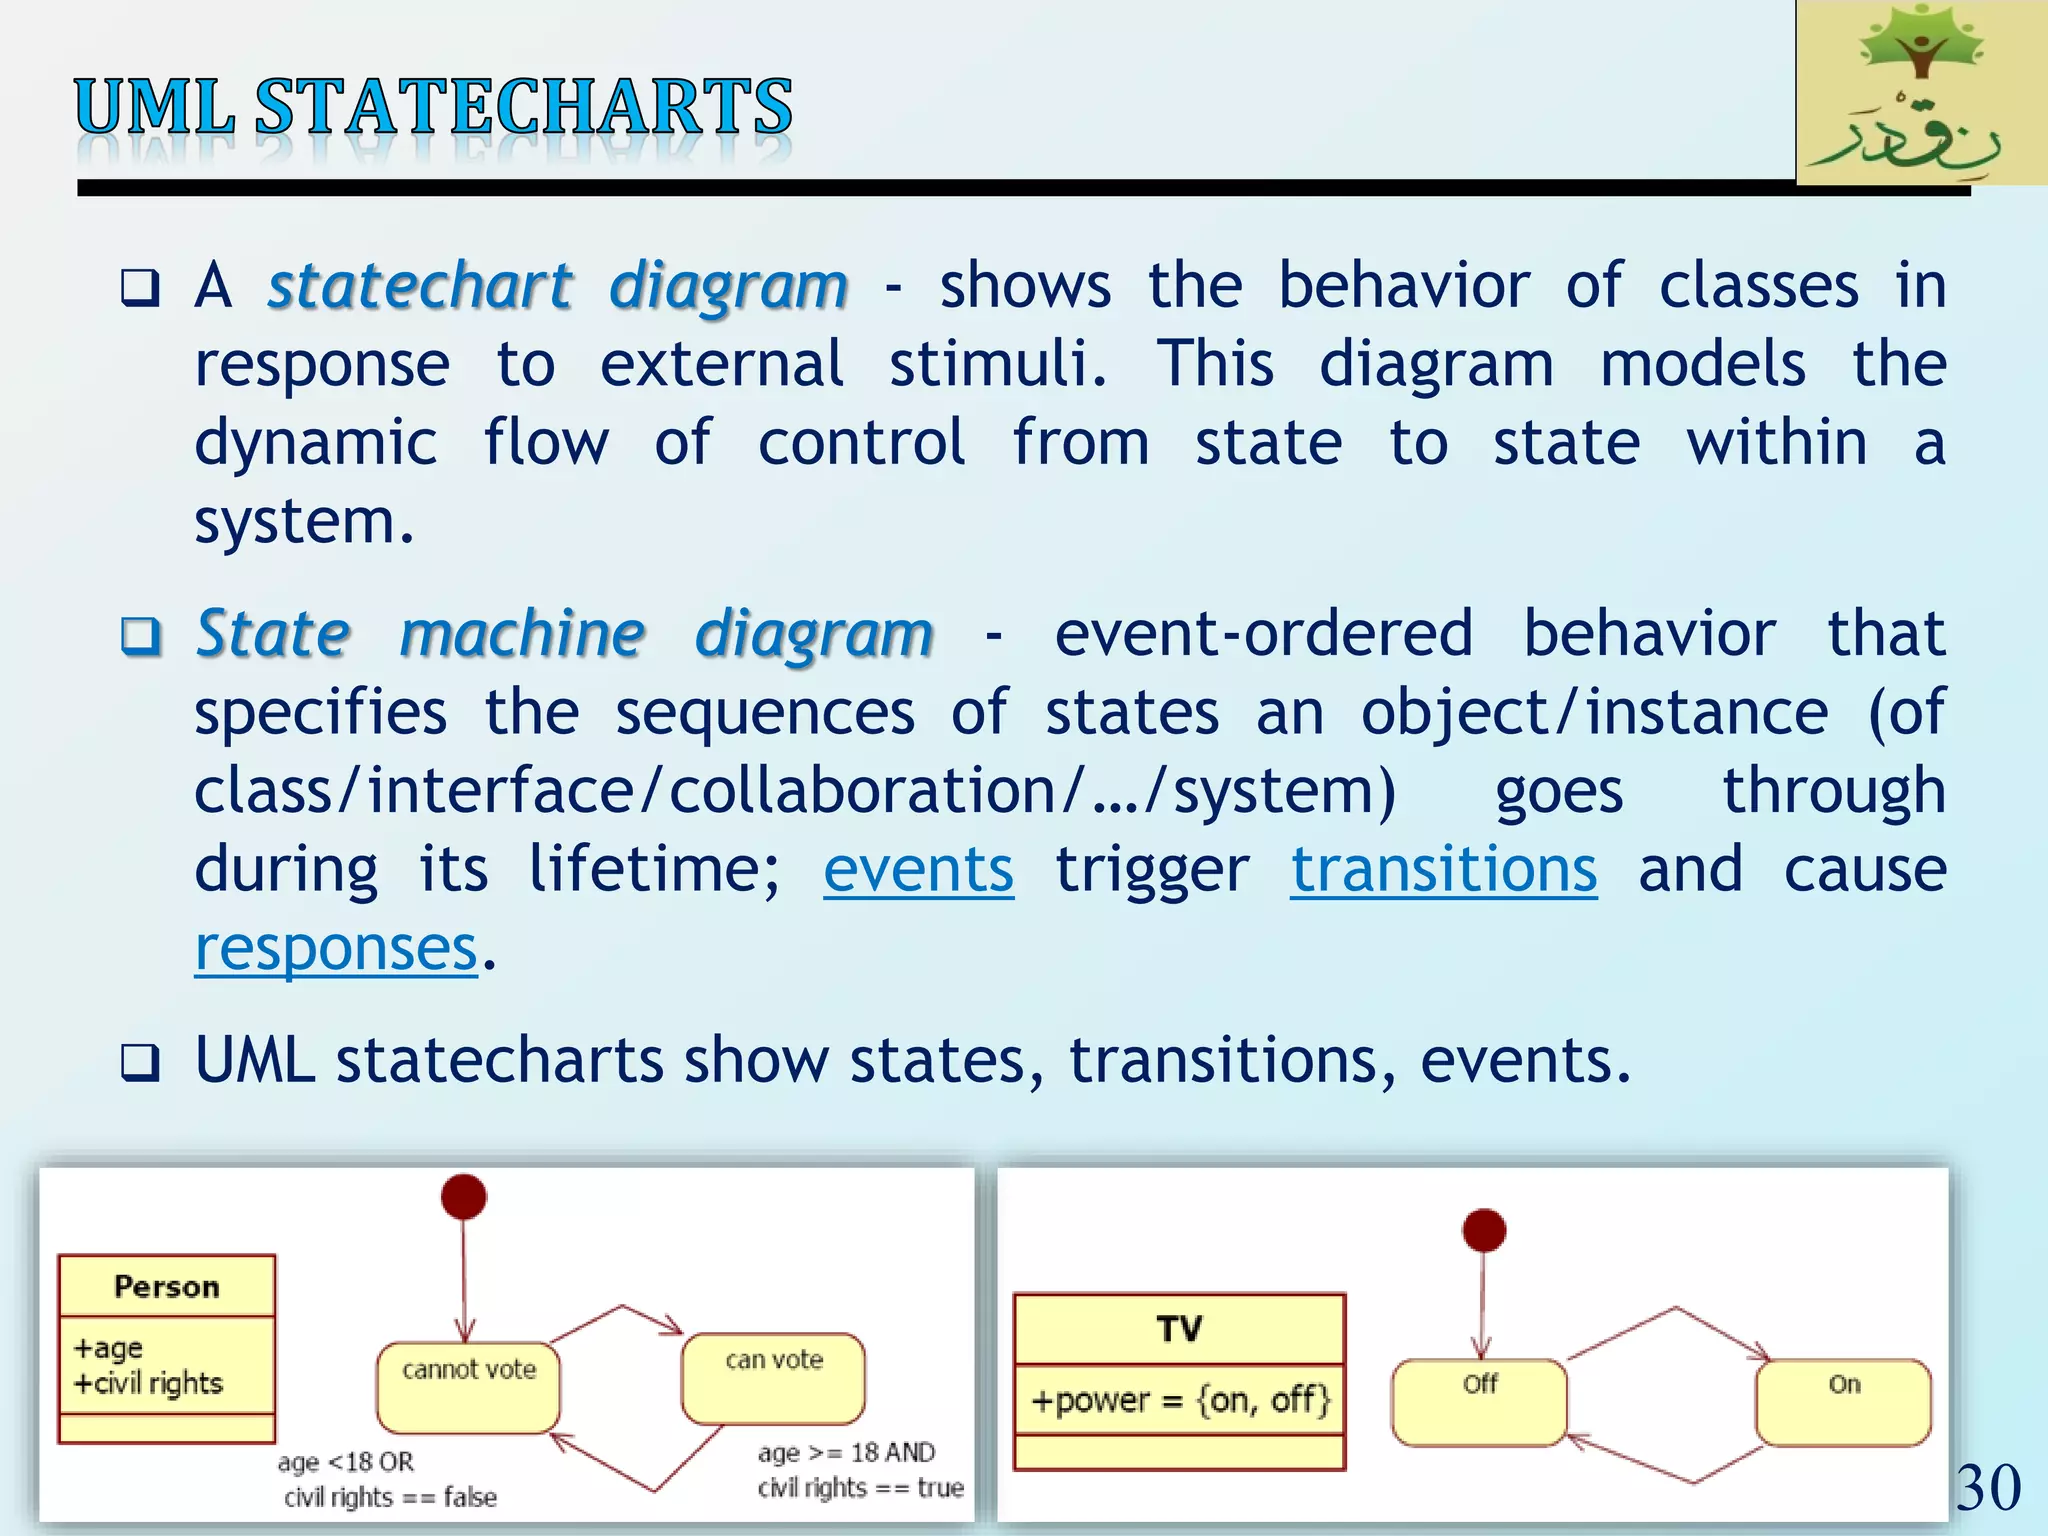
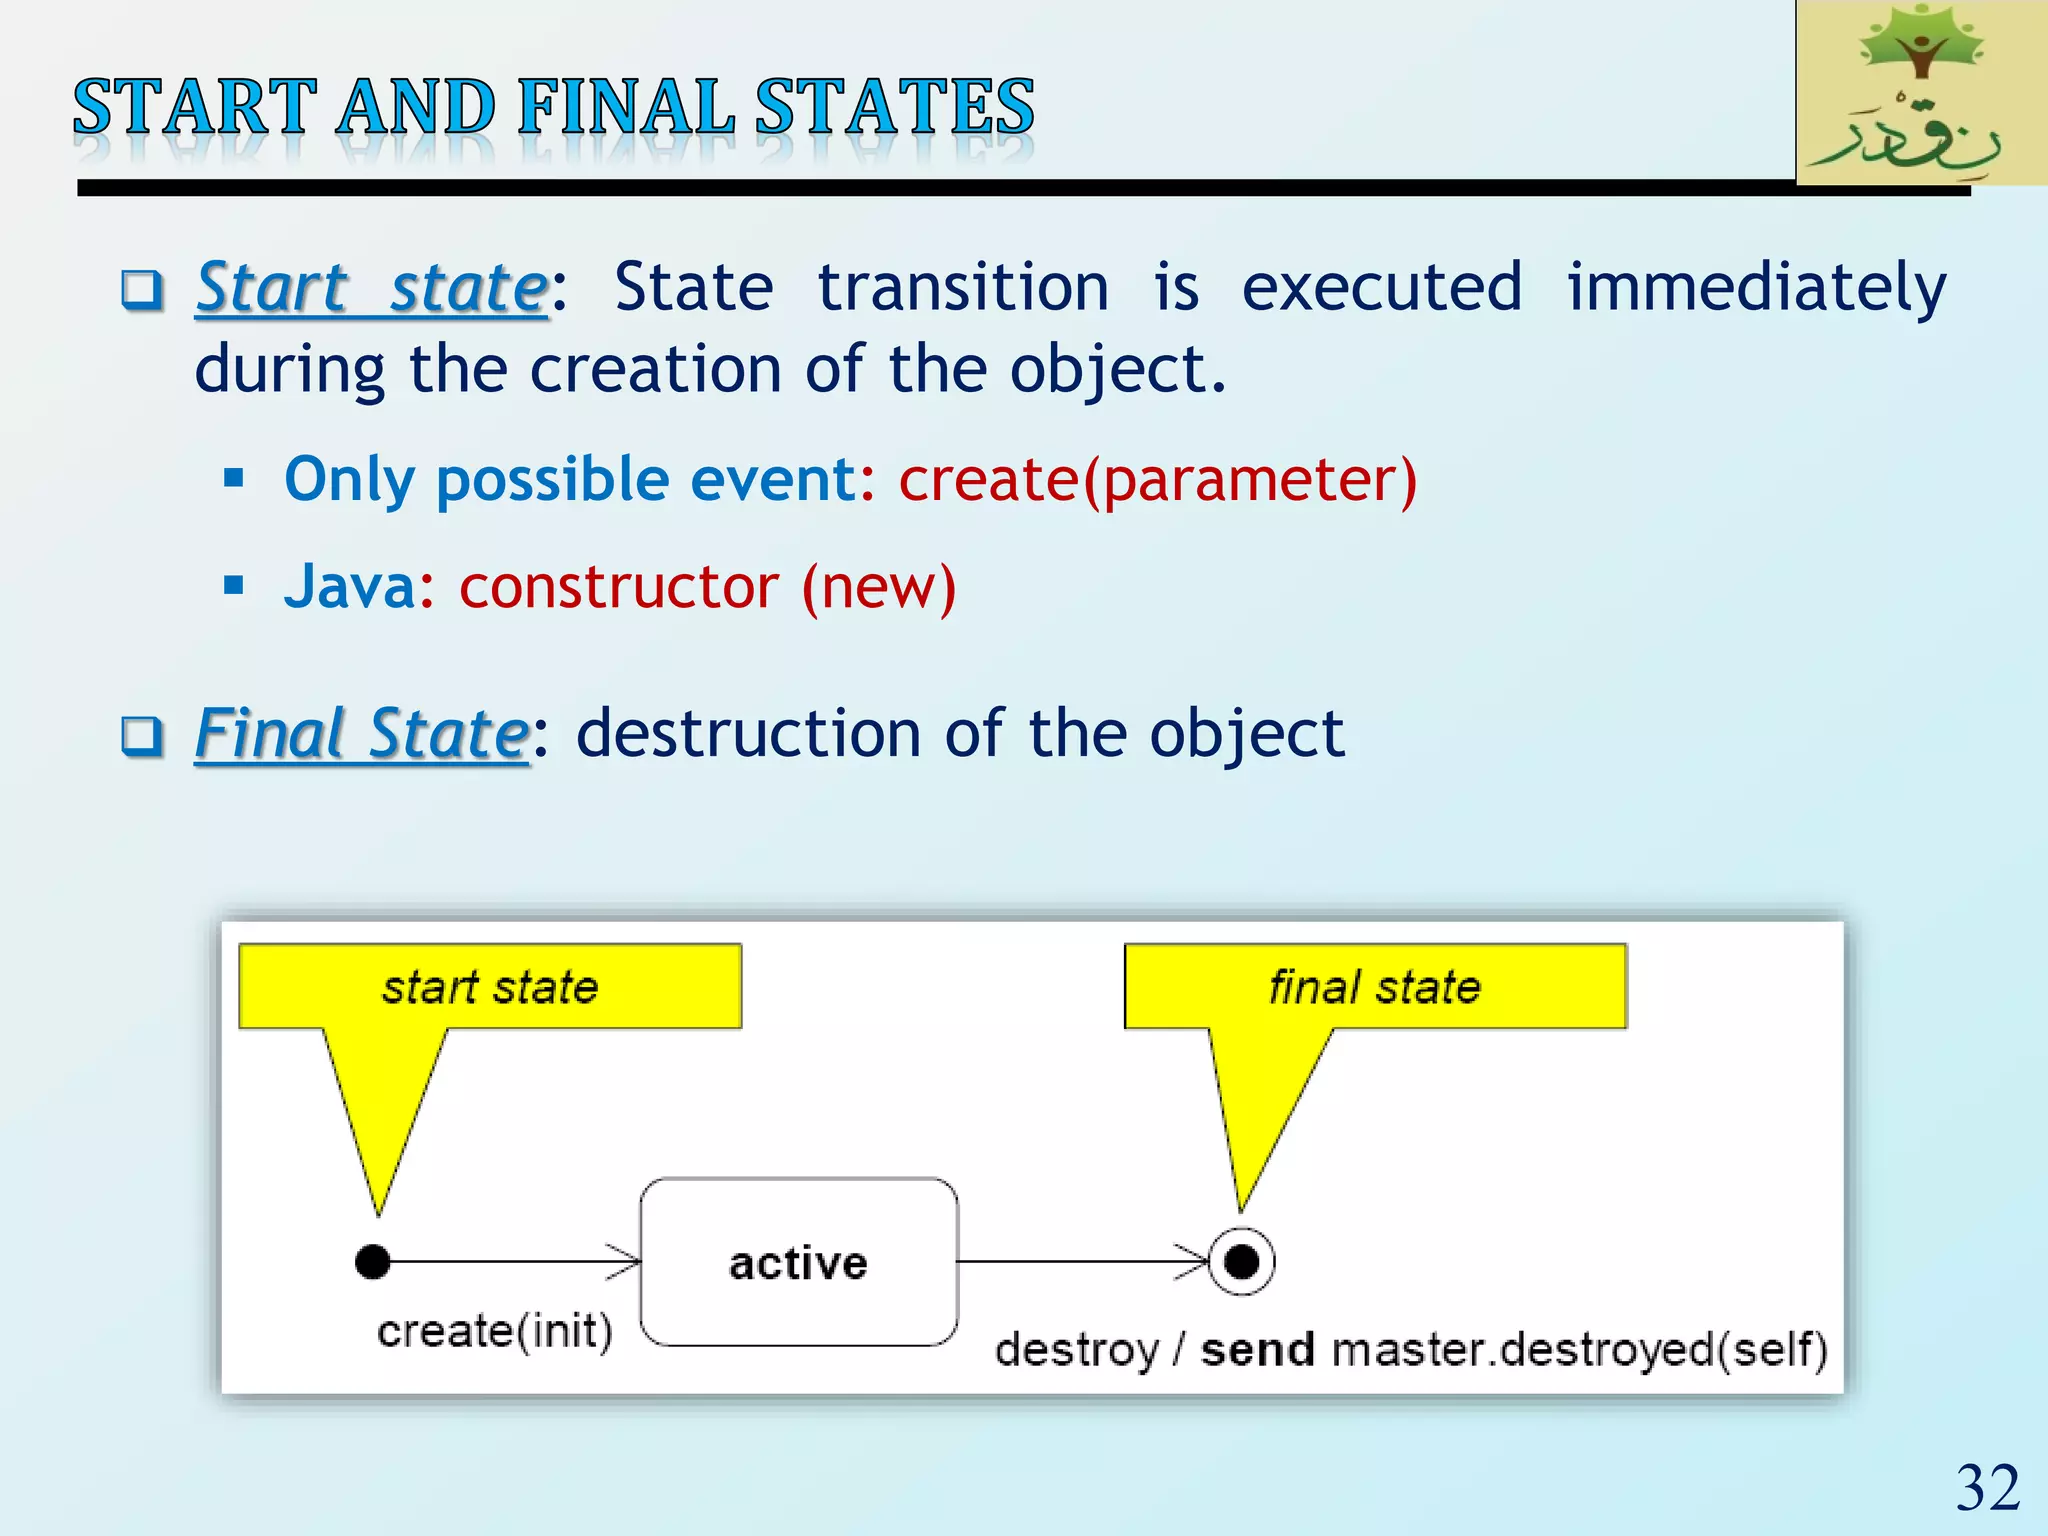
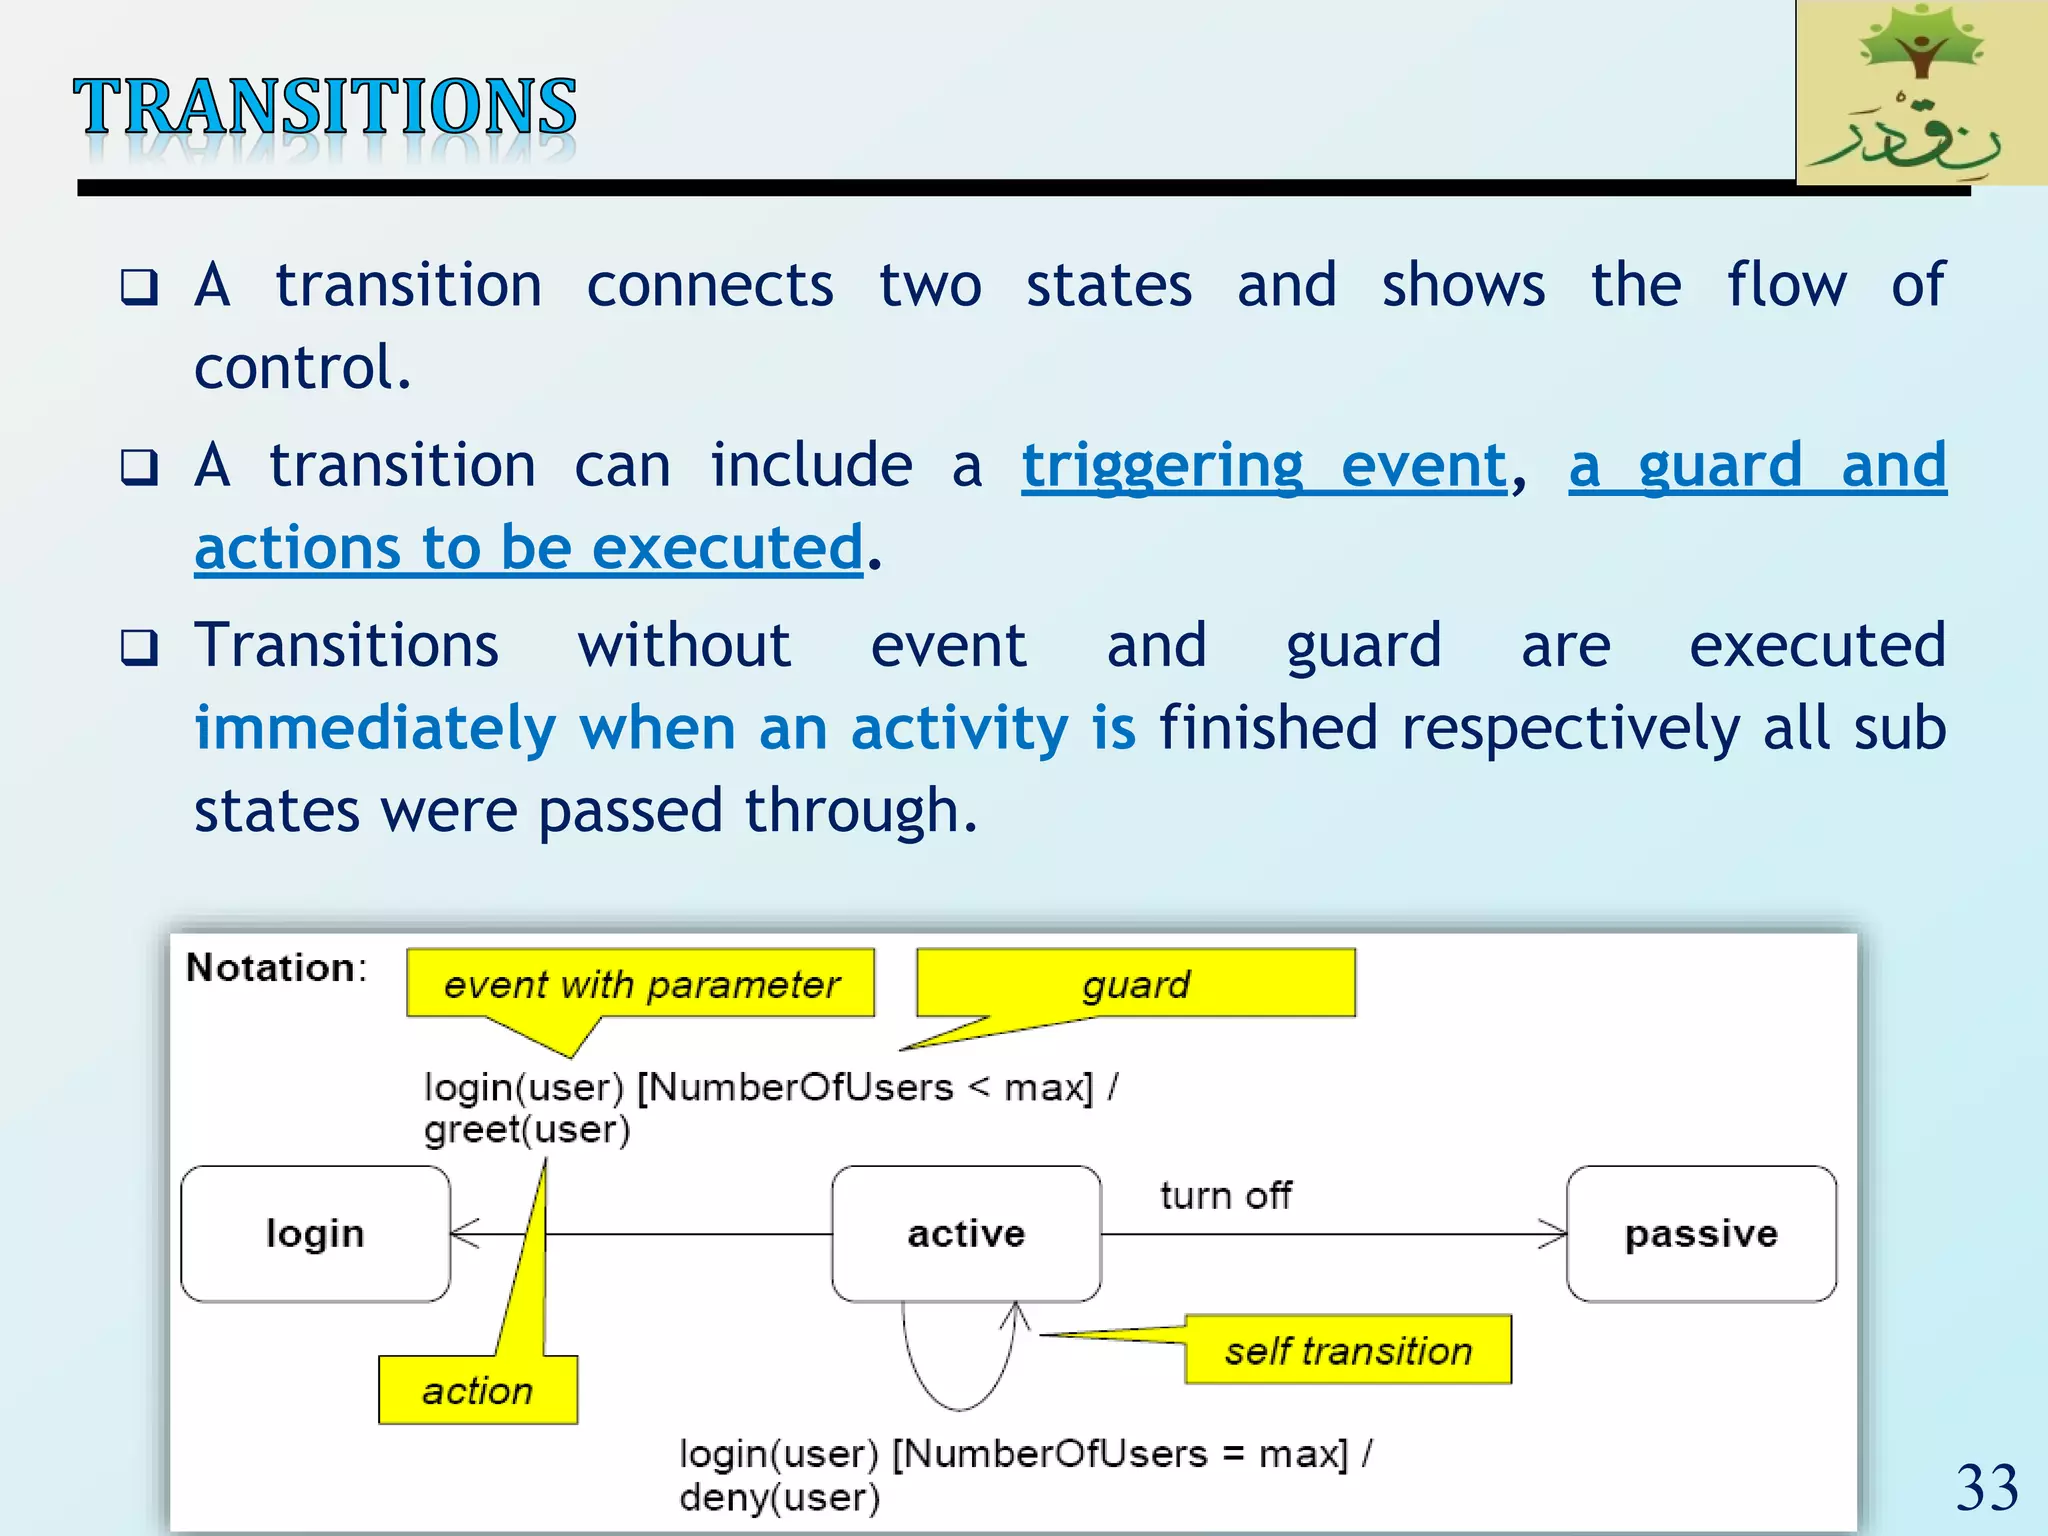
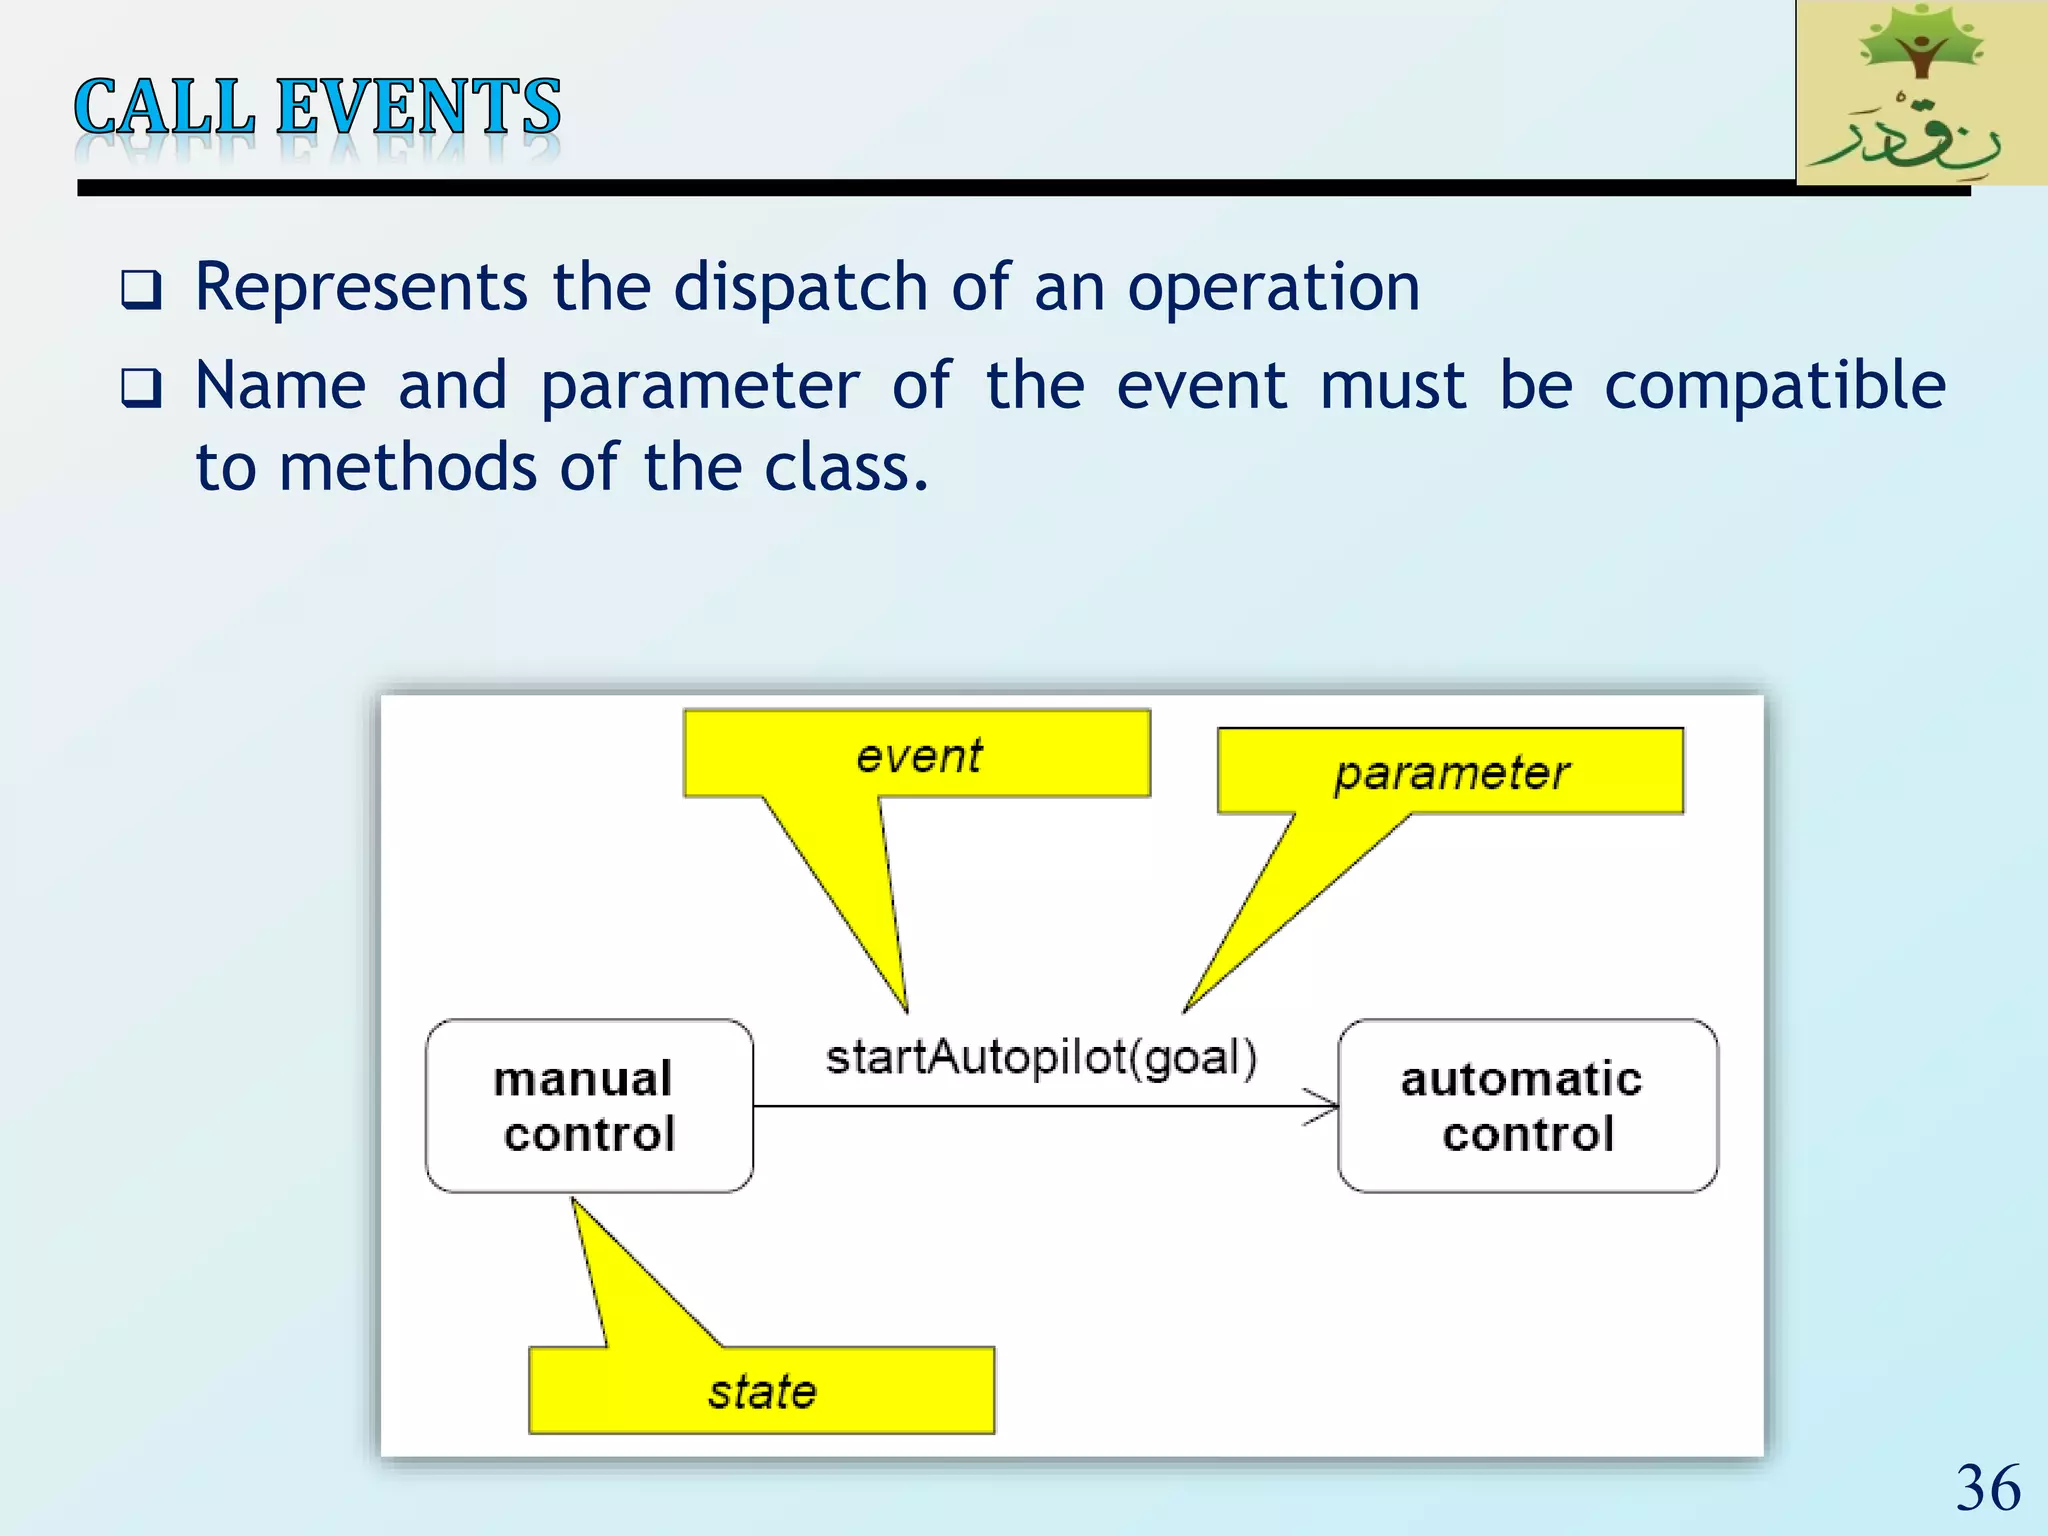
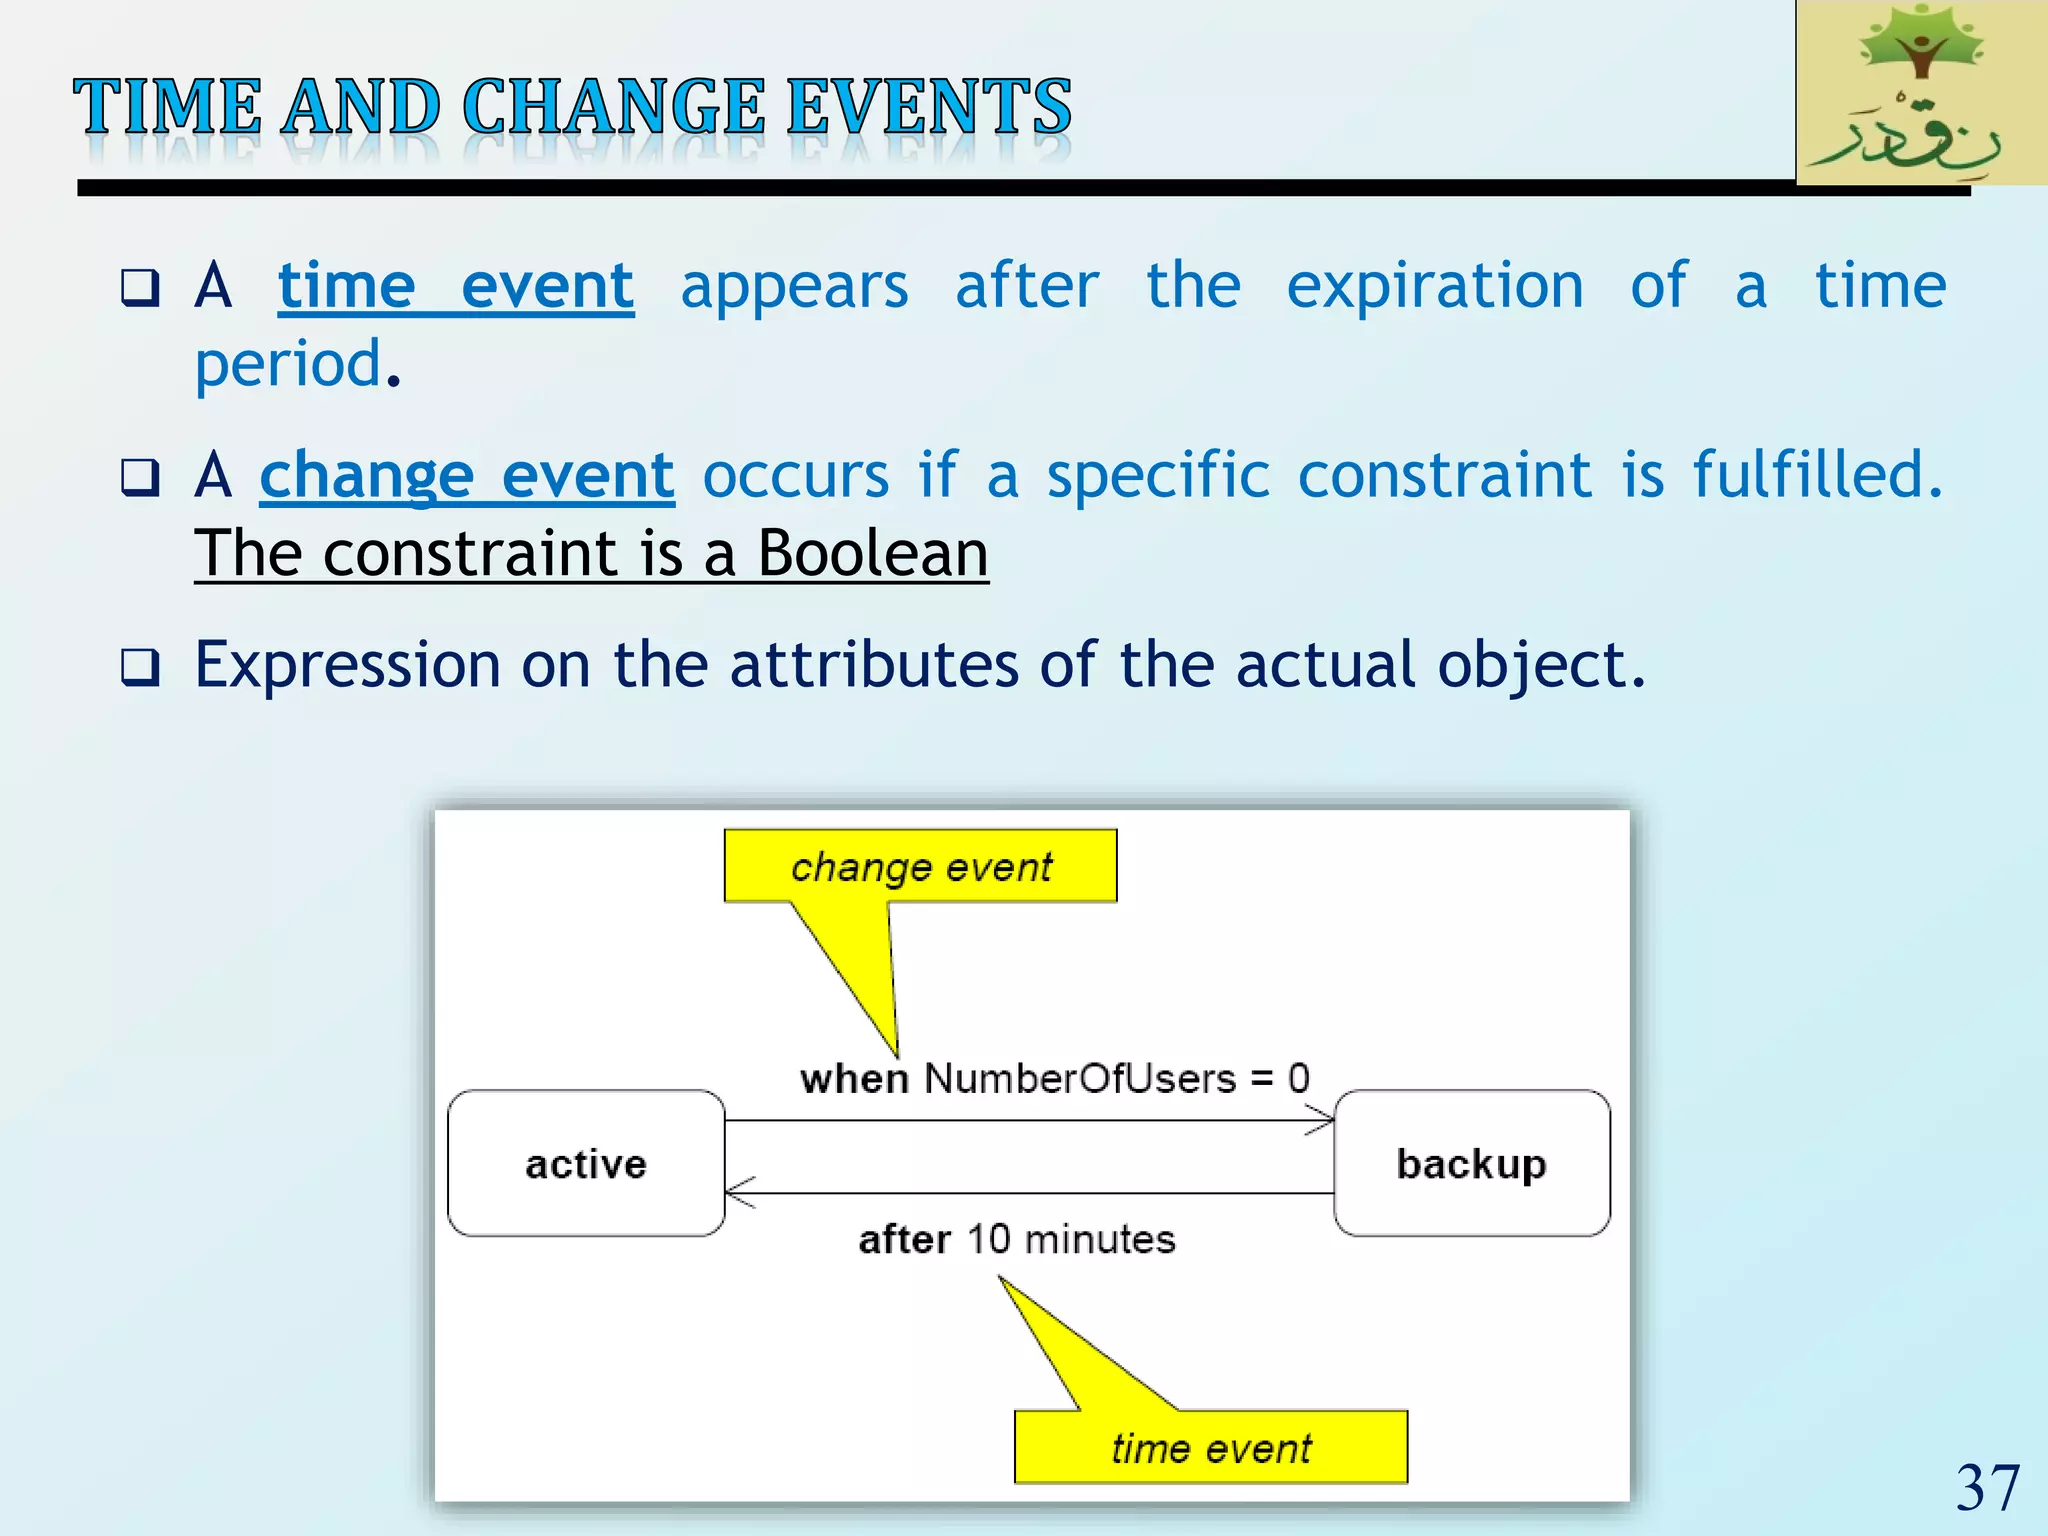
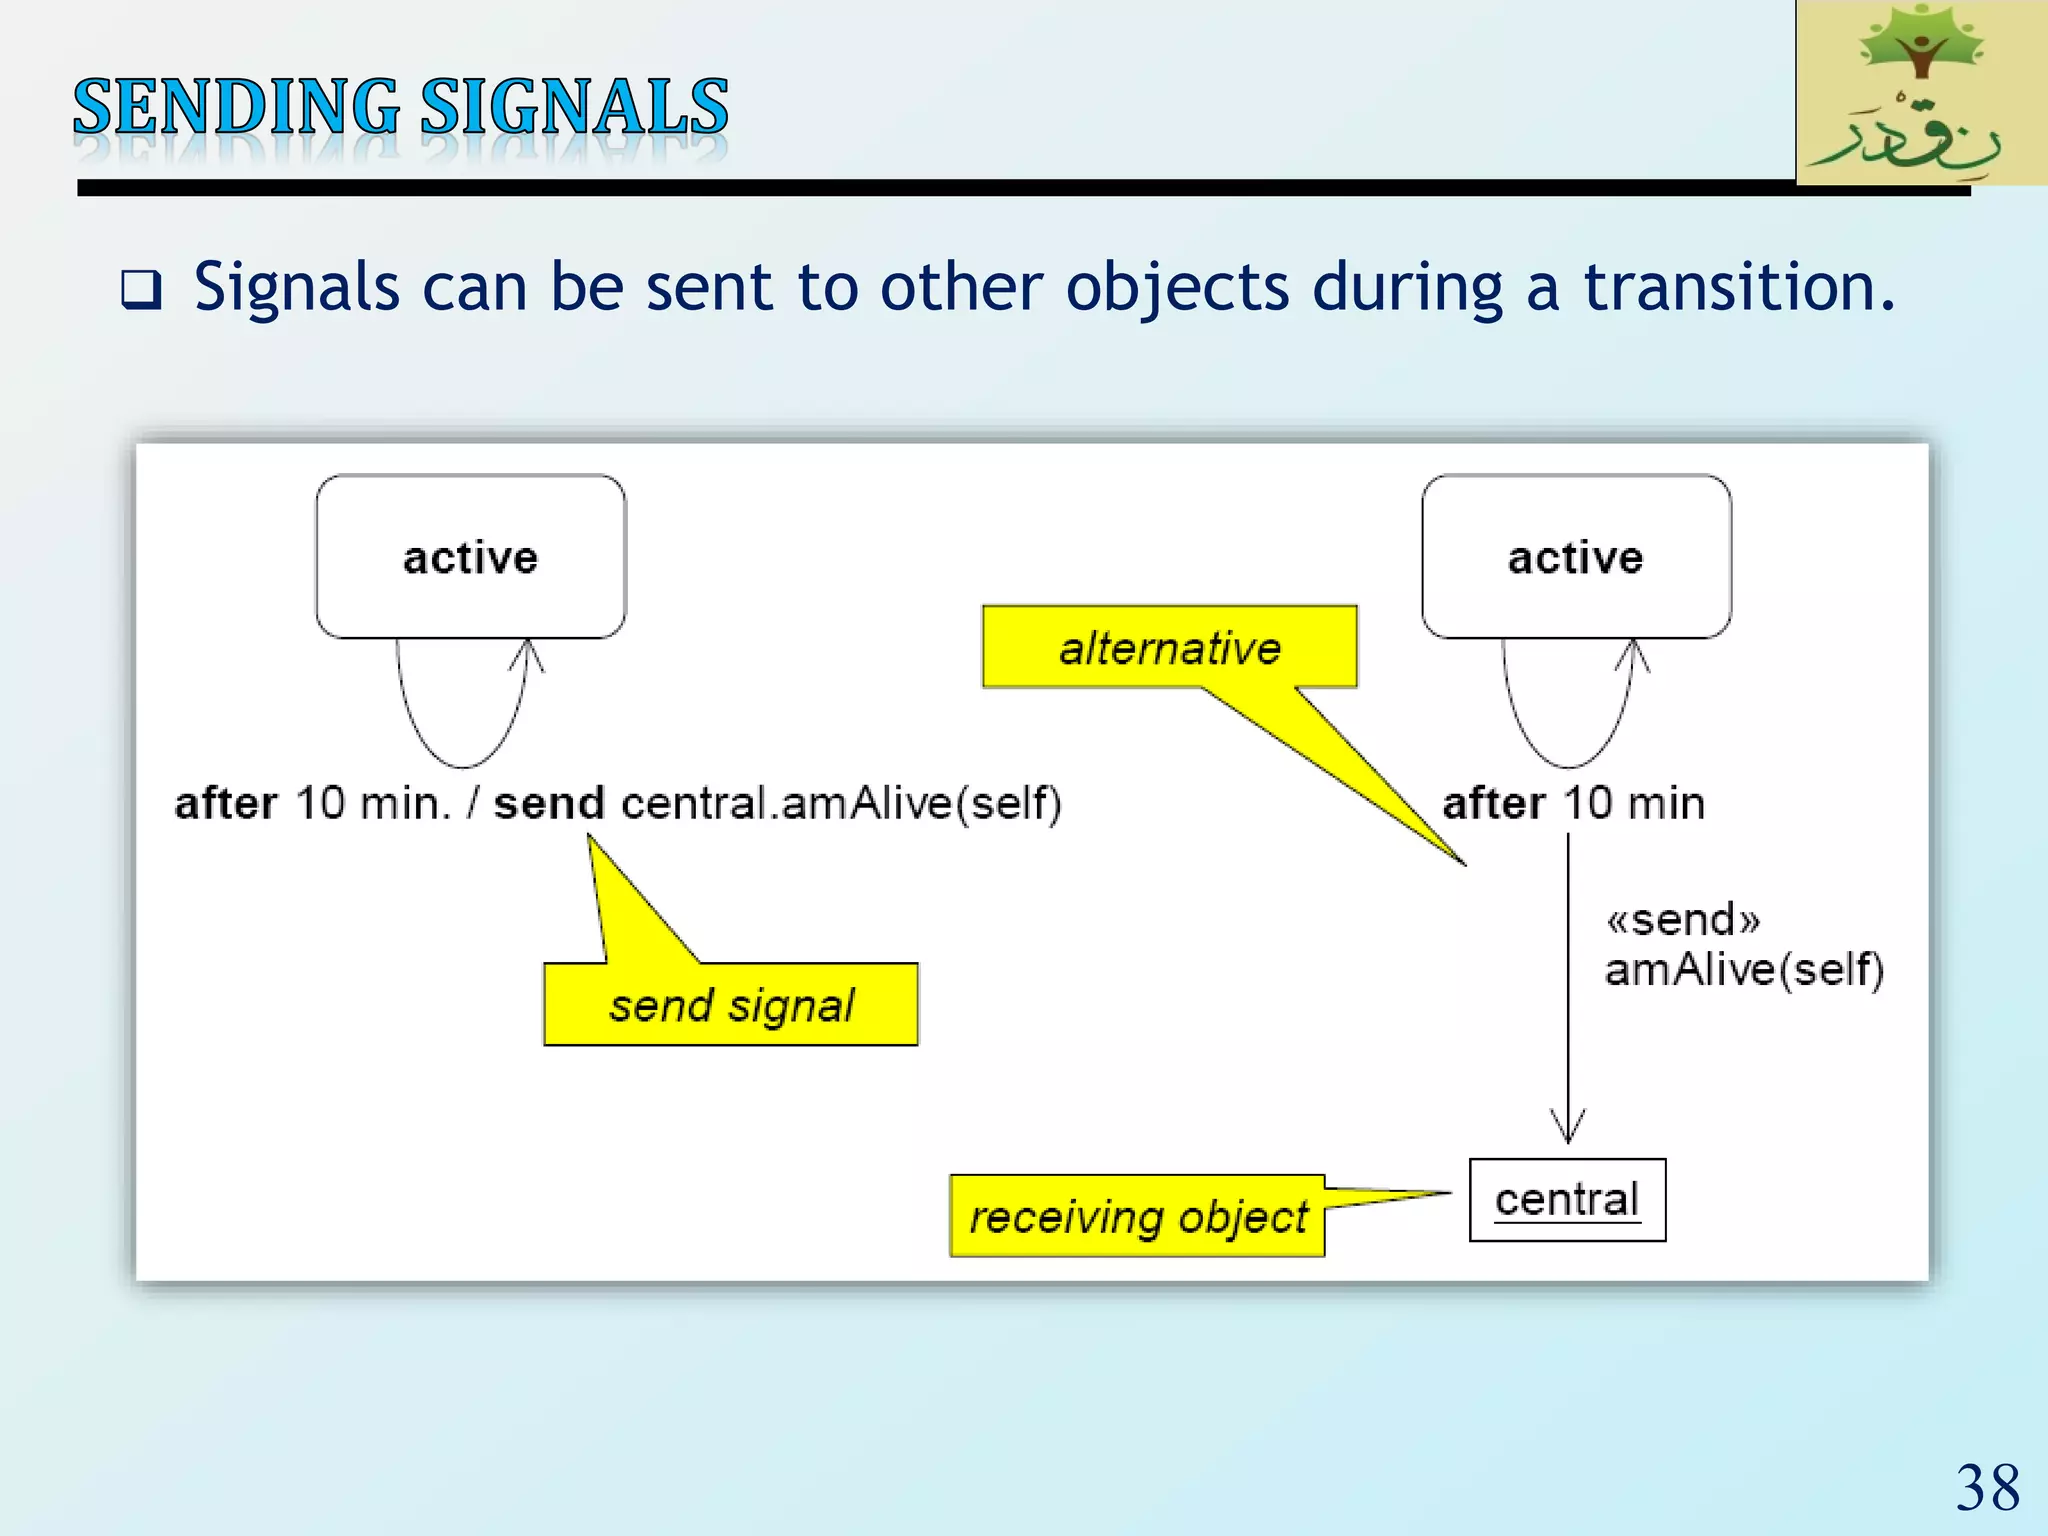
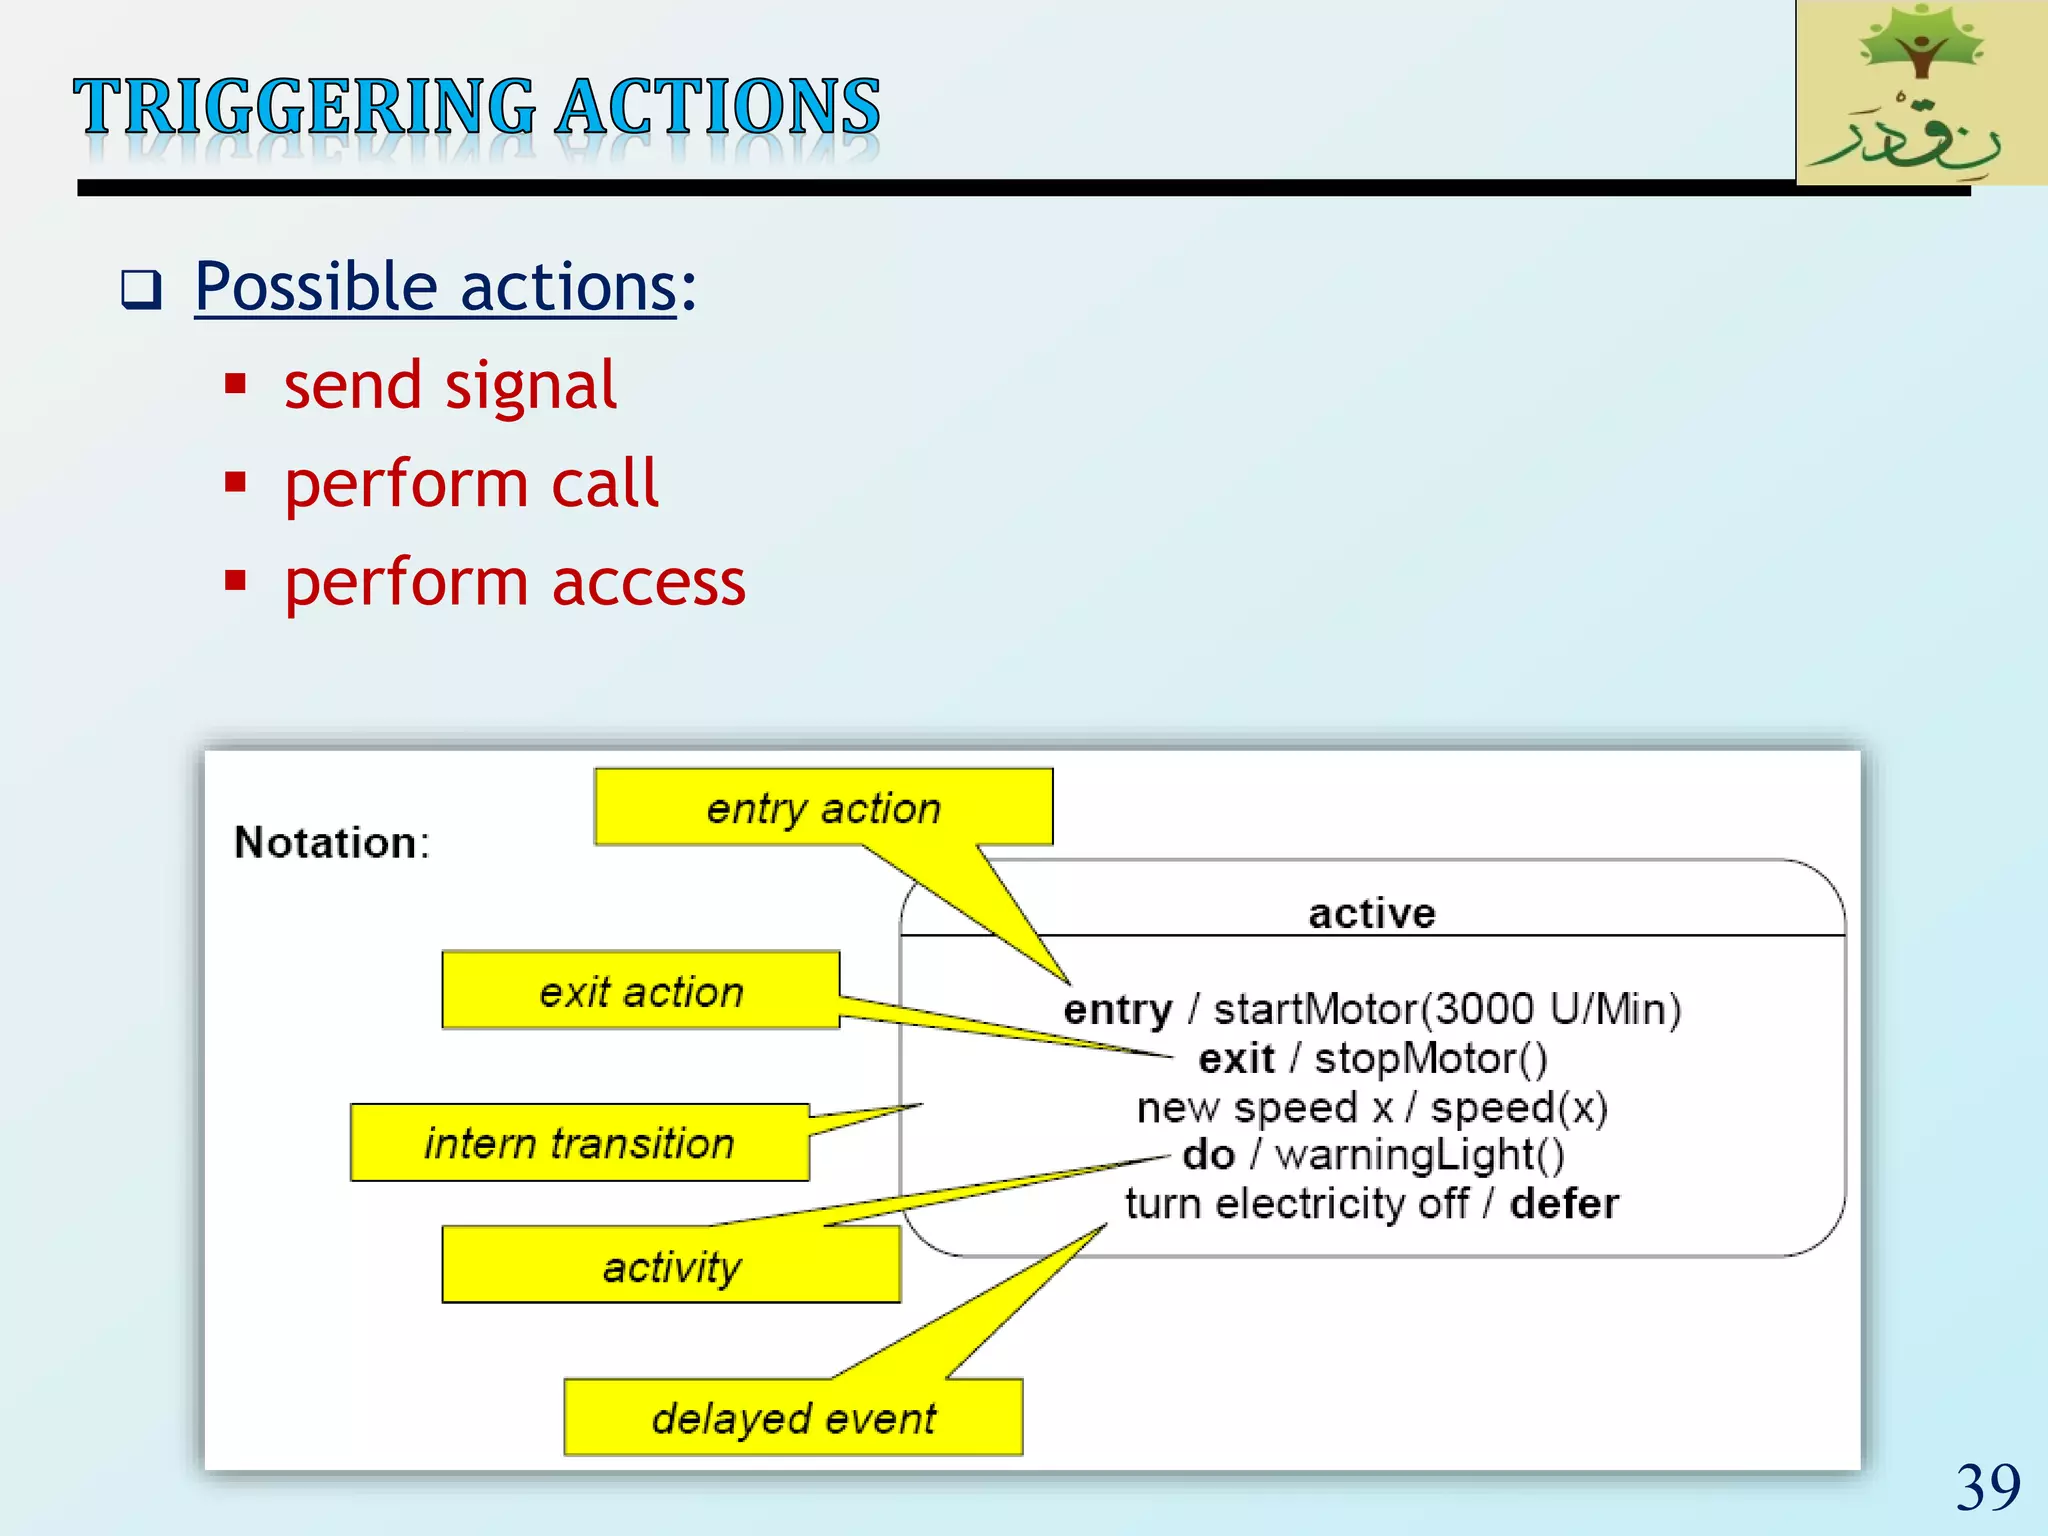
The document discusses various Unified Modeling Language (UML) diagrams used to model different aspects of software systems. It describes structure diagrams like class diagrams that show system composition and deployment diagrams that map software to hardware. It also covers behavioral diagrams like use case diagrams, interaction diagrams (sequence and communication diagrams), state-chart diagrams, and activity diagrams that model dynamic system behavior through object interactions and state transitions. Specific examples are provided for how to construct and interpret sequence diagrams, state machine diagrams, and activity diagrams.