Lecture 5
…abit more about UML
Sequence diagrams
Collaboration diagrams
State-chart diagrams
CRC cards
2.
Misc
“Missing” seminarsfor OOMPA E
Monday 15/10 10-12 in Q32
Wednesday 17/10 10-12 in V35
Seminars
It is mandatory to hand in your notes for the chapters
you prepared for presentation after the seminar
Labs
Lab1 is due next Friday 28/9
JAVA syntax highlighting in Emacs
Press “M-x” and type “font-lock-mode”
Add the line
(require ‘jde)
to your .emacs file
3.
System Model
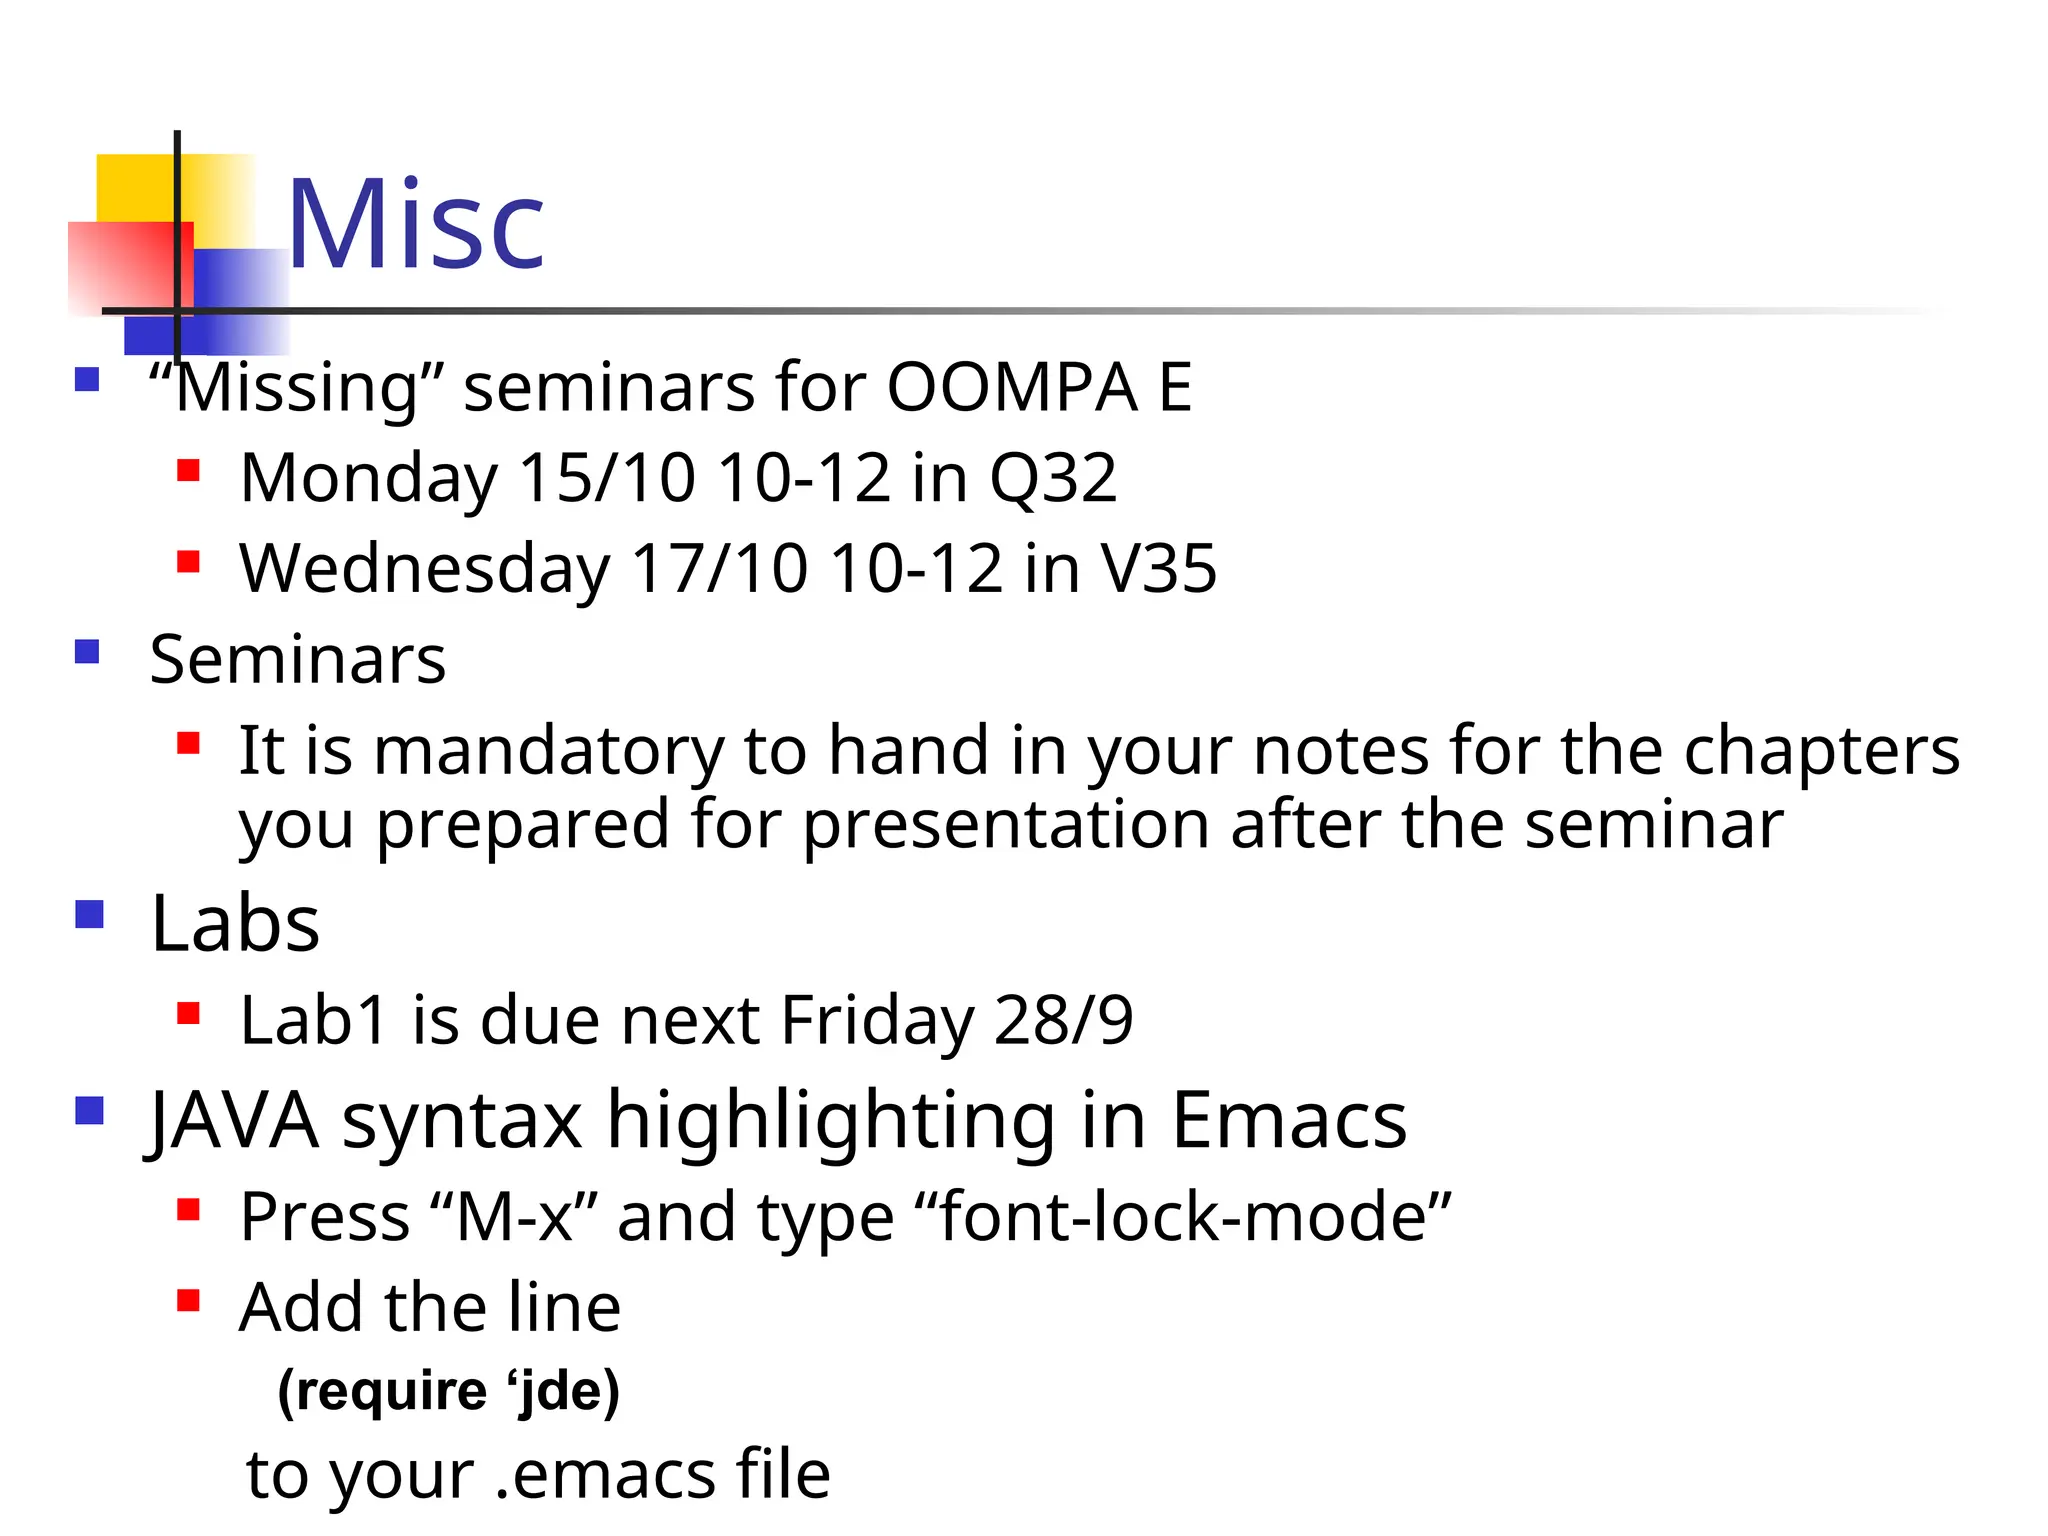
Scenarios
-As-is scenarios, visionary scenarios
Use case model
- Actors and use cases
Object model
- Data dictionary
- Class diagrams (classes, associations, attributes and
behaviors)
Dynamic model
- State diagrams for classes with significant dynamic
behavior
- Sequence diagrams for collaborating objects (protocol)
4.
Dynamic Modeling withUML
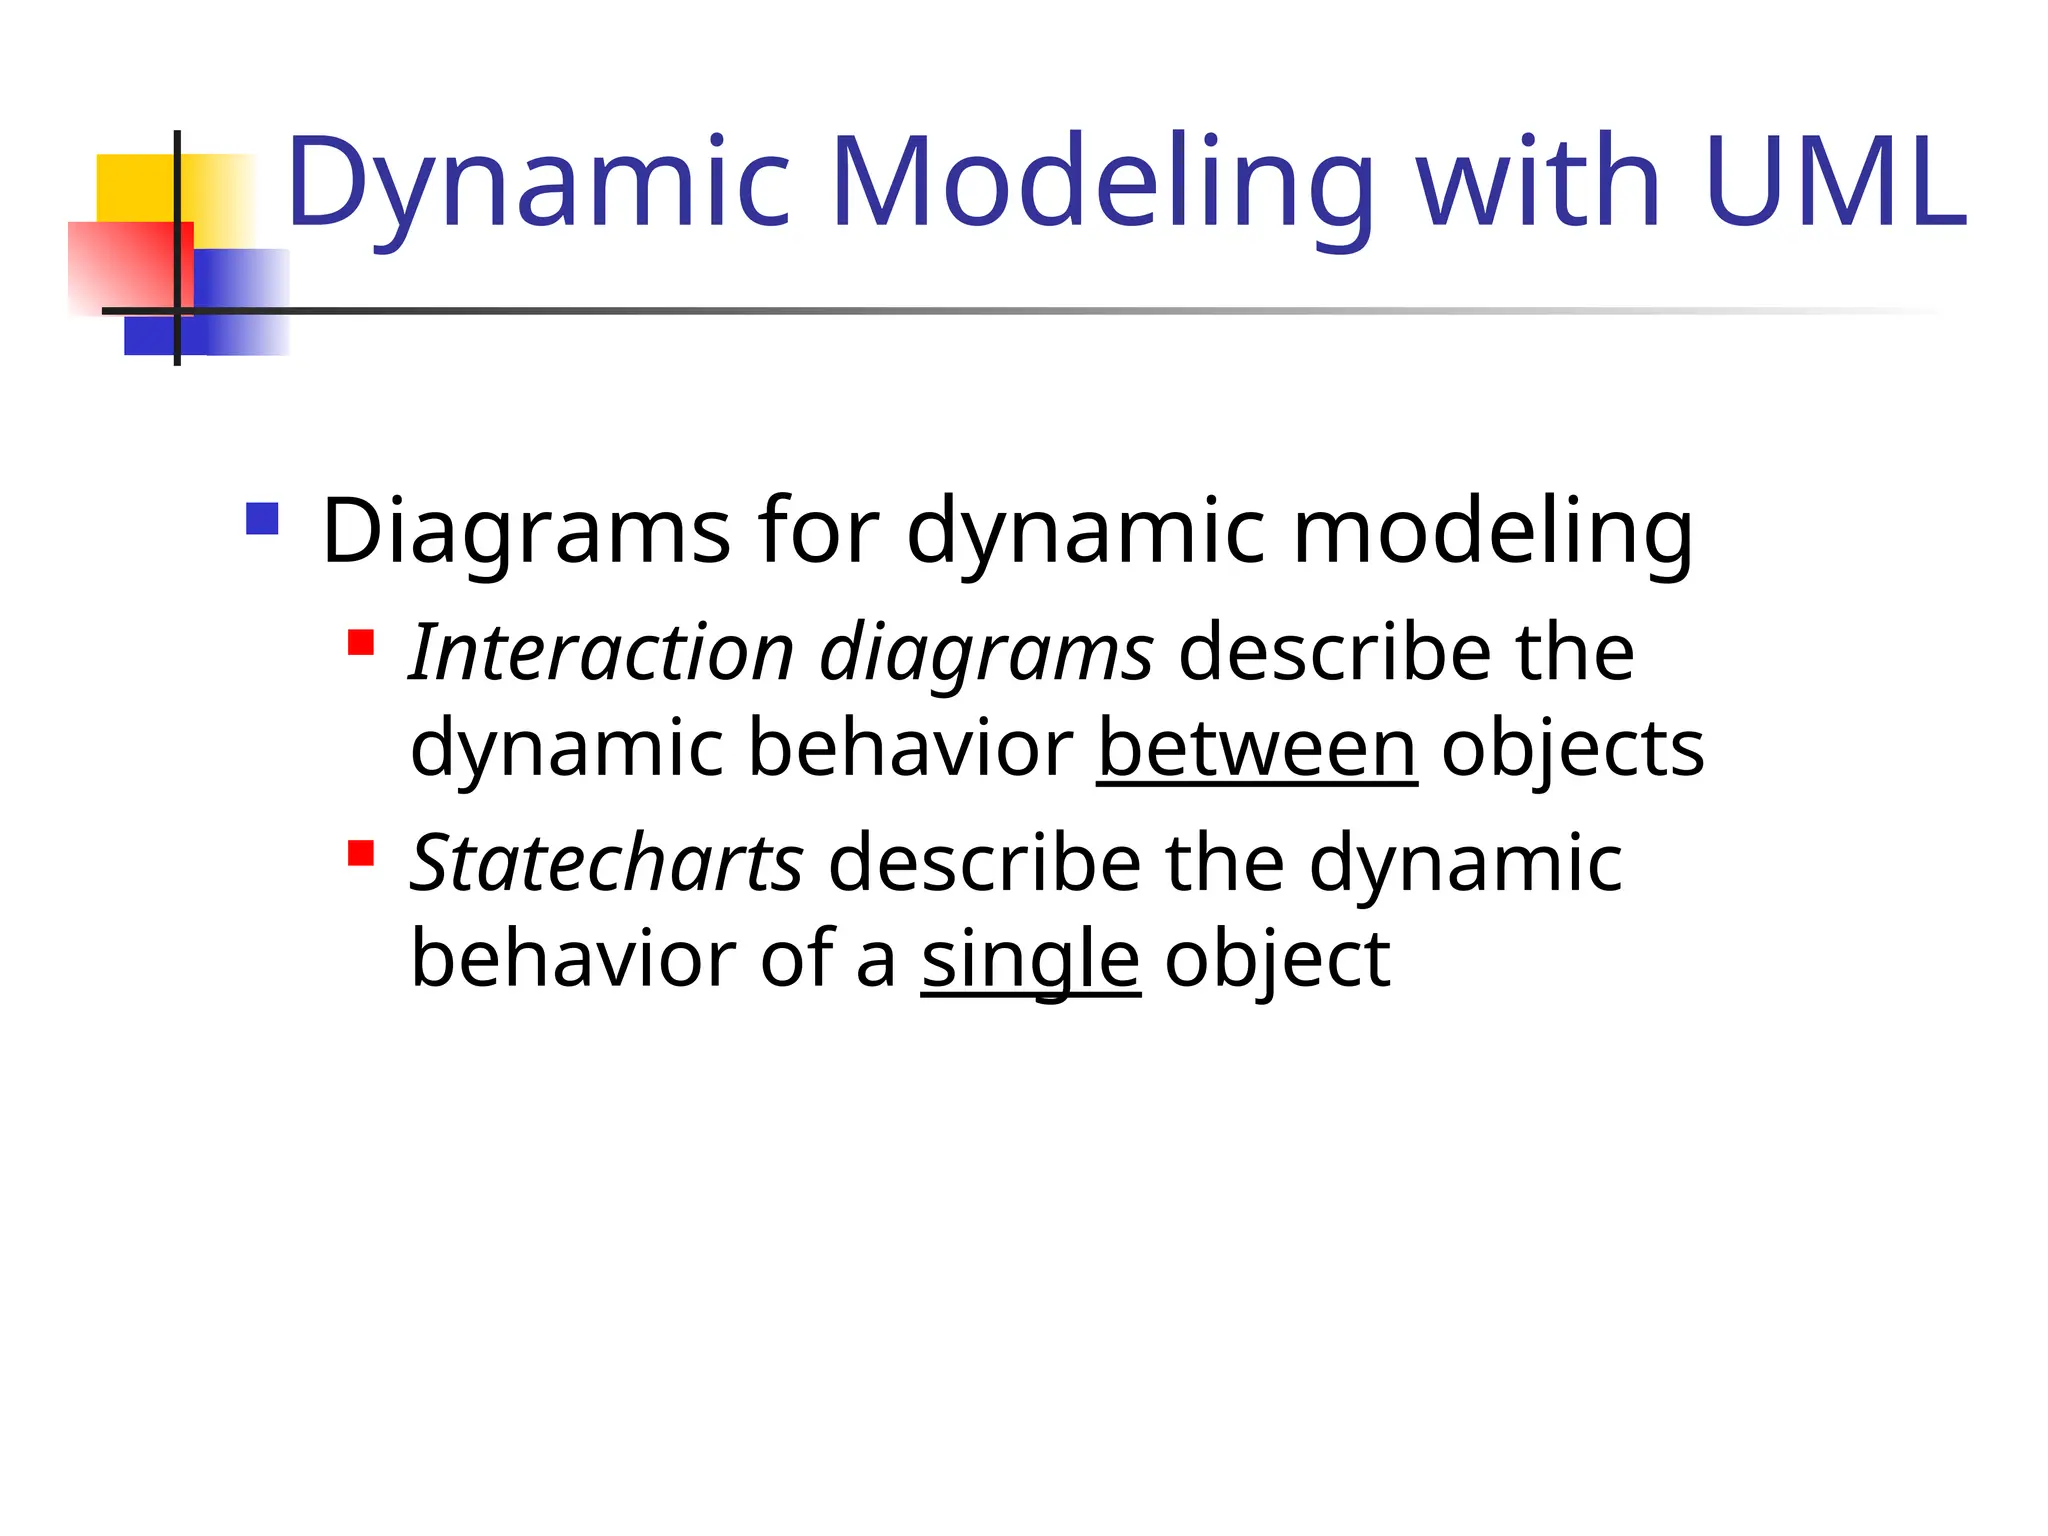
Diagrams for dynamic modeling
Interaction diagrams describe the
dynamic behavior between objects
Statecharts describe the dynamic
behavior of a single object
5.
Dynamic Modeling withUML
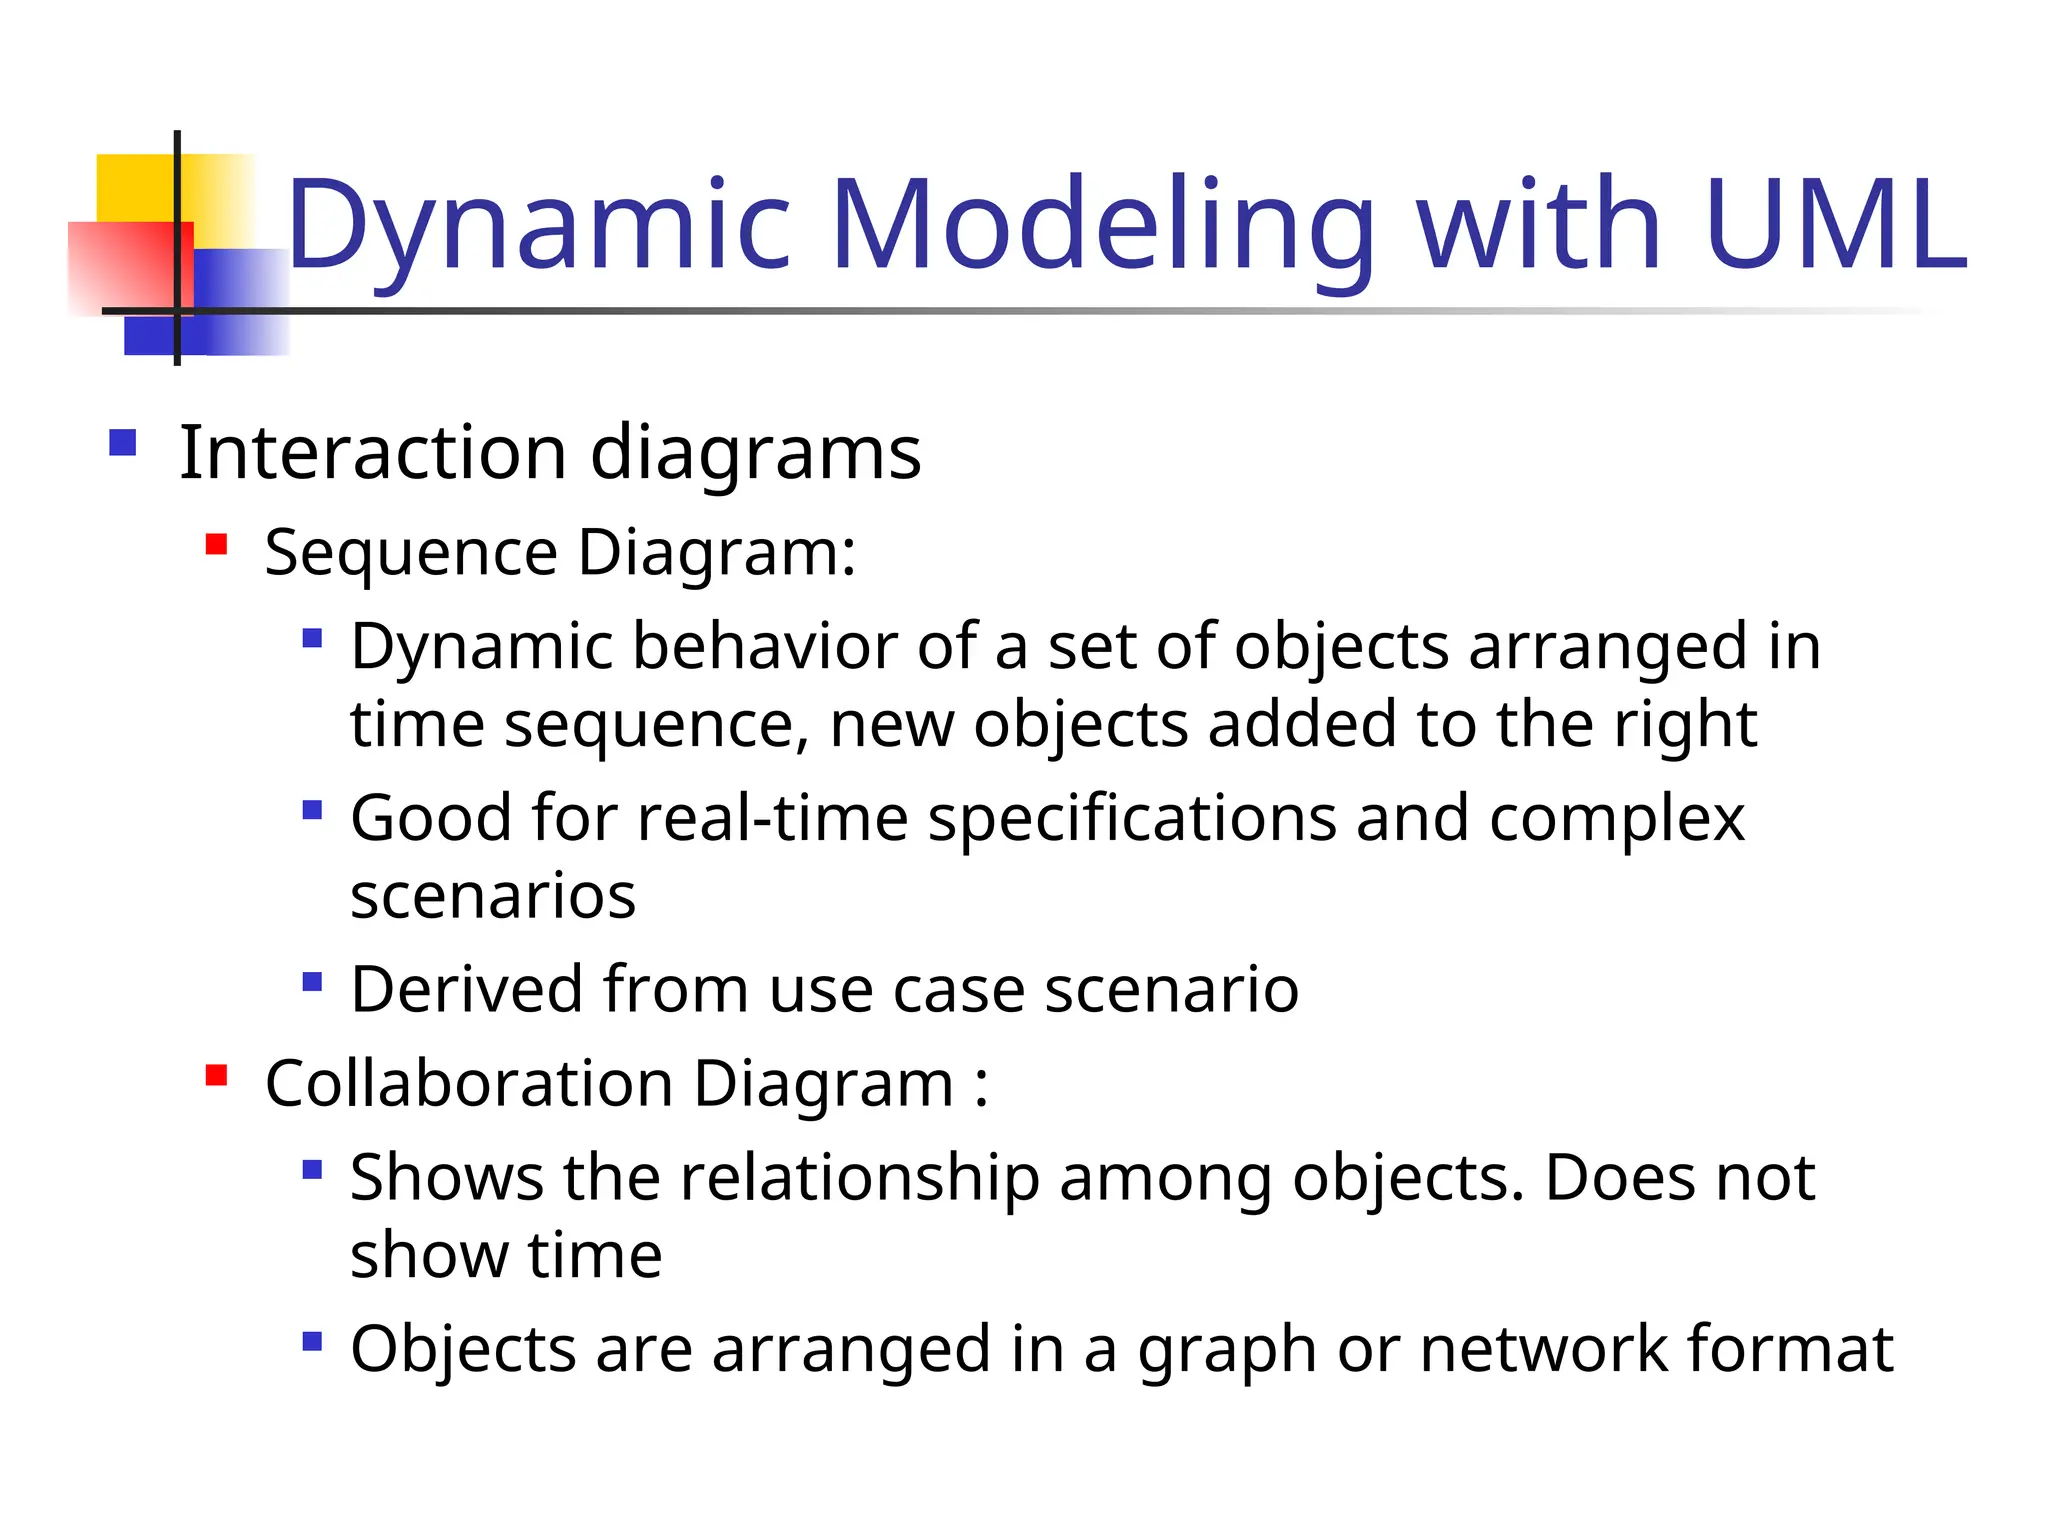
Interaction diagrams
Sequence Diagram:
Dynamic behavior of a set of objects arranged in
time sequence, new objects added to the right
Good for real-time specifications and complex
scenarios
Derived from use case scenario
Collaboration Diagram :
Shows the relationship among objects. Does not
show time
Objects are arranged in a graph or network format
Sequence Diagrams vs
CollaborationDiagrams
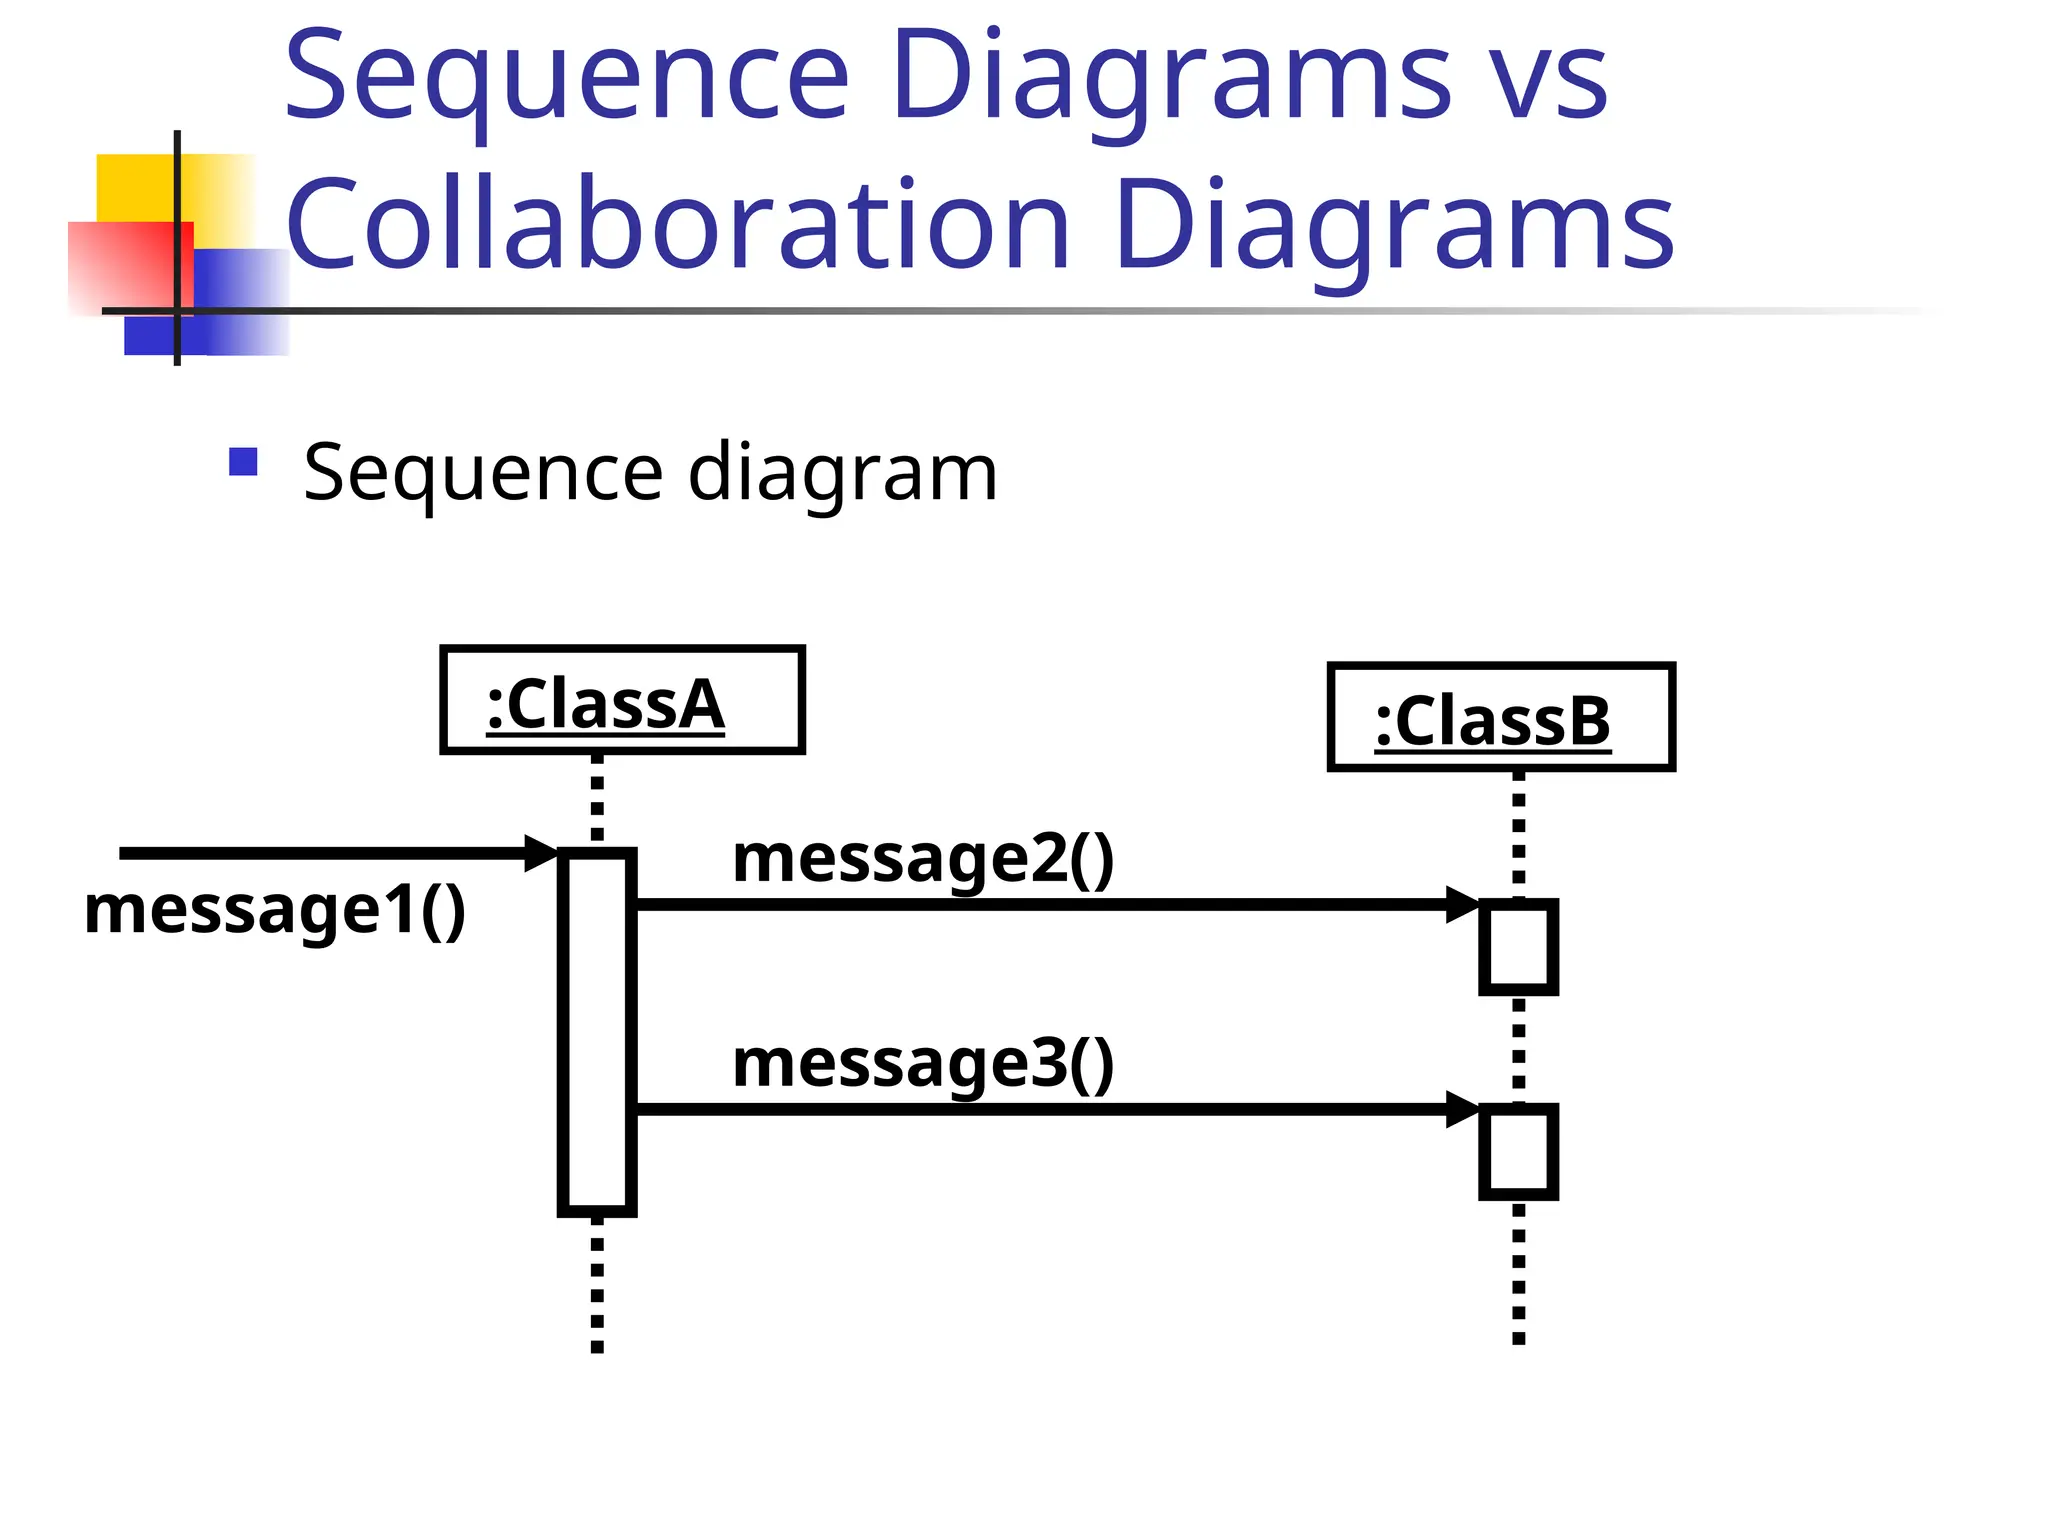
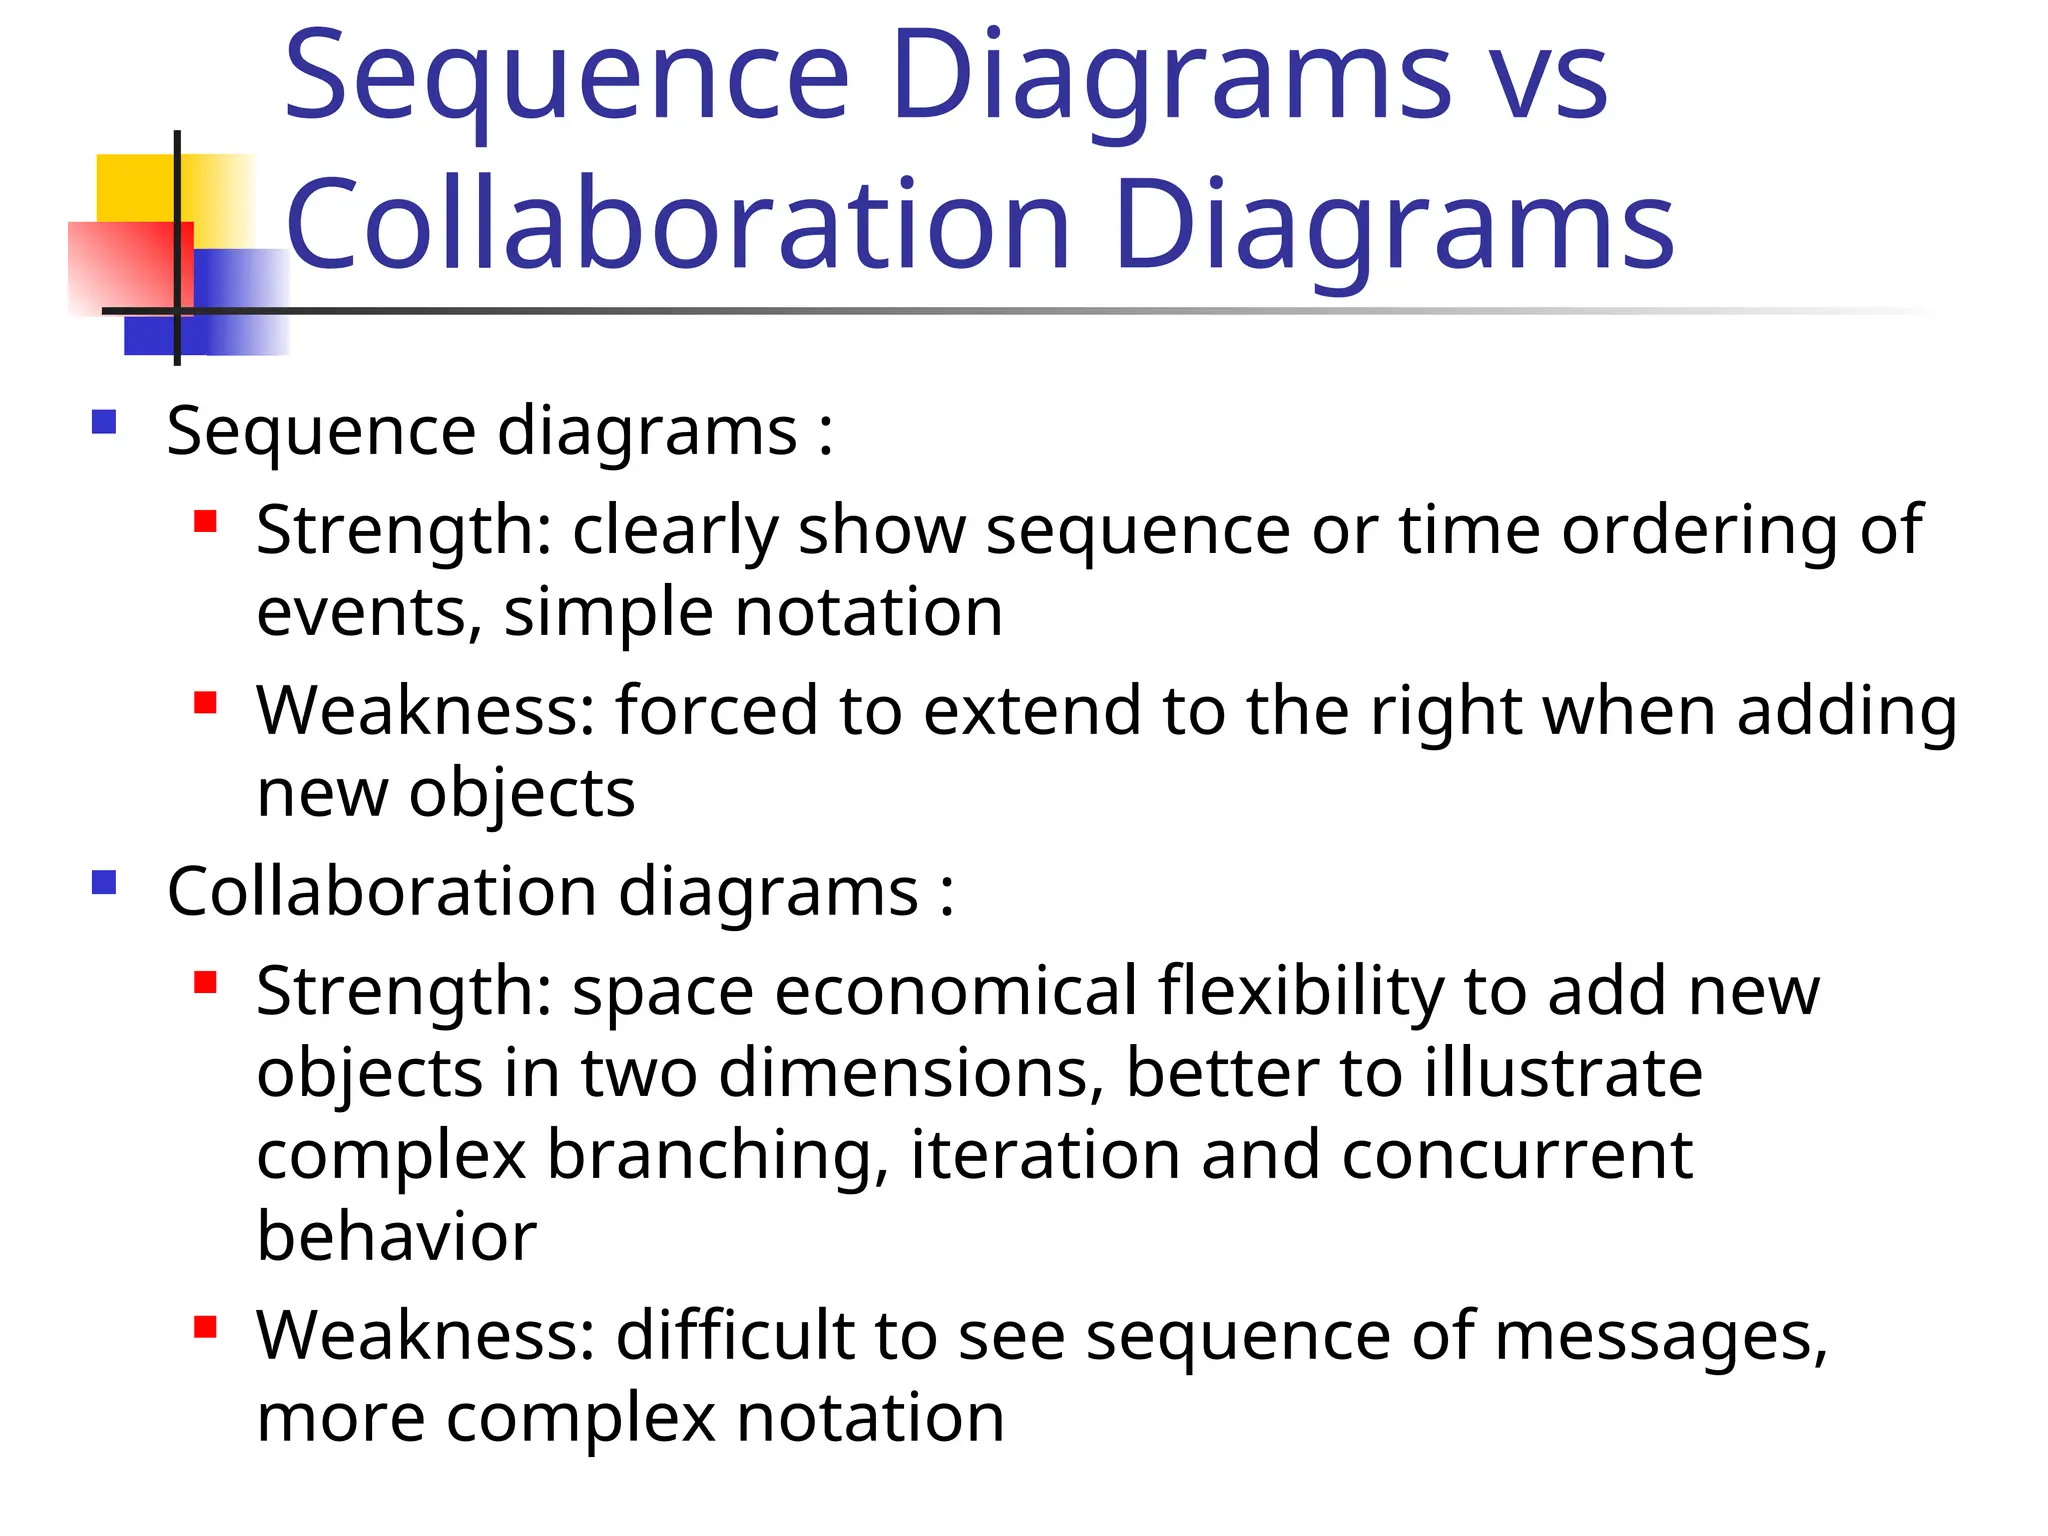
Sequence diagrams :
Strength: clearly show sequence or time ordering of
events, simple notation
Weakness: forced to extend to the right when adding
new objects
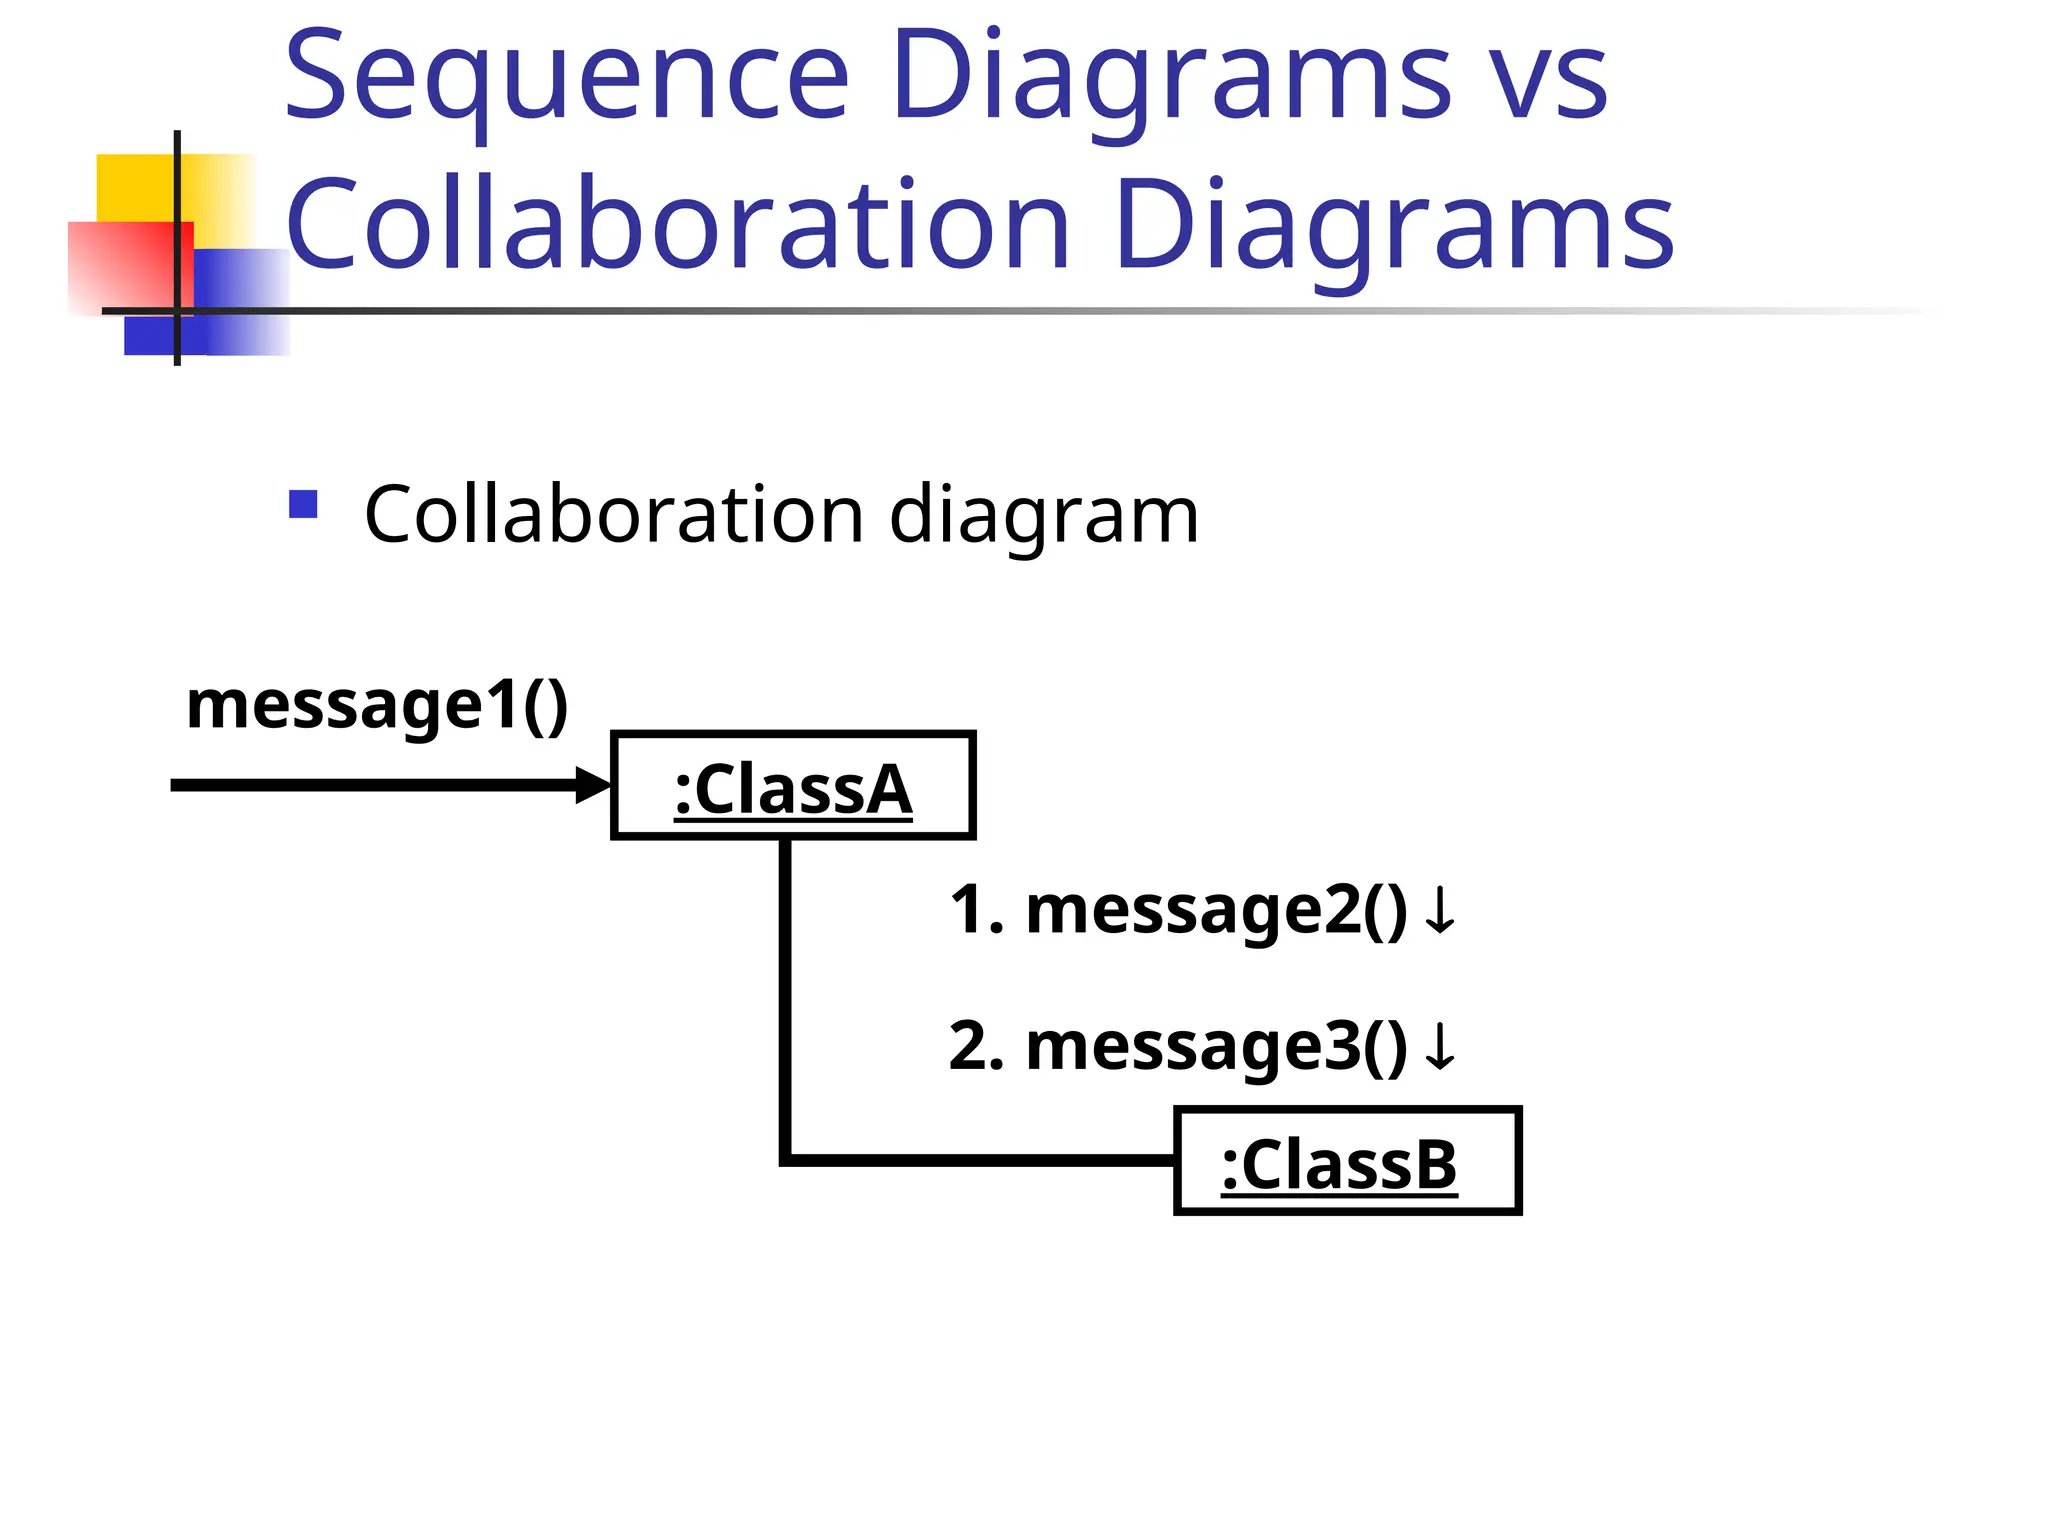
Collaboration diagrams :
Strength: space economical flexibility to add new
objects in two dimensions, better to illustrate
complex branching, iteration and concurrent
behavior
Weakness: difficult to see sequence of messages,
more complex notation
9.
Dynamic Modeling withUML
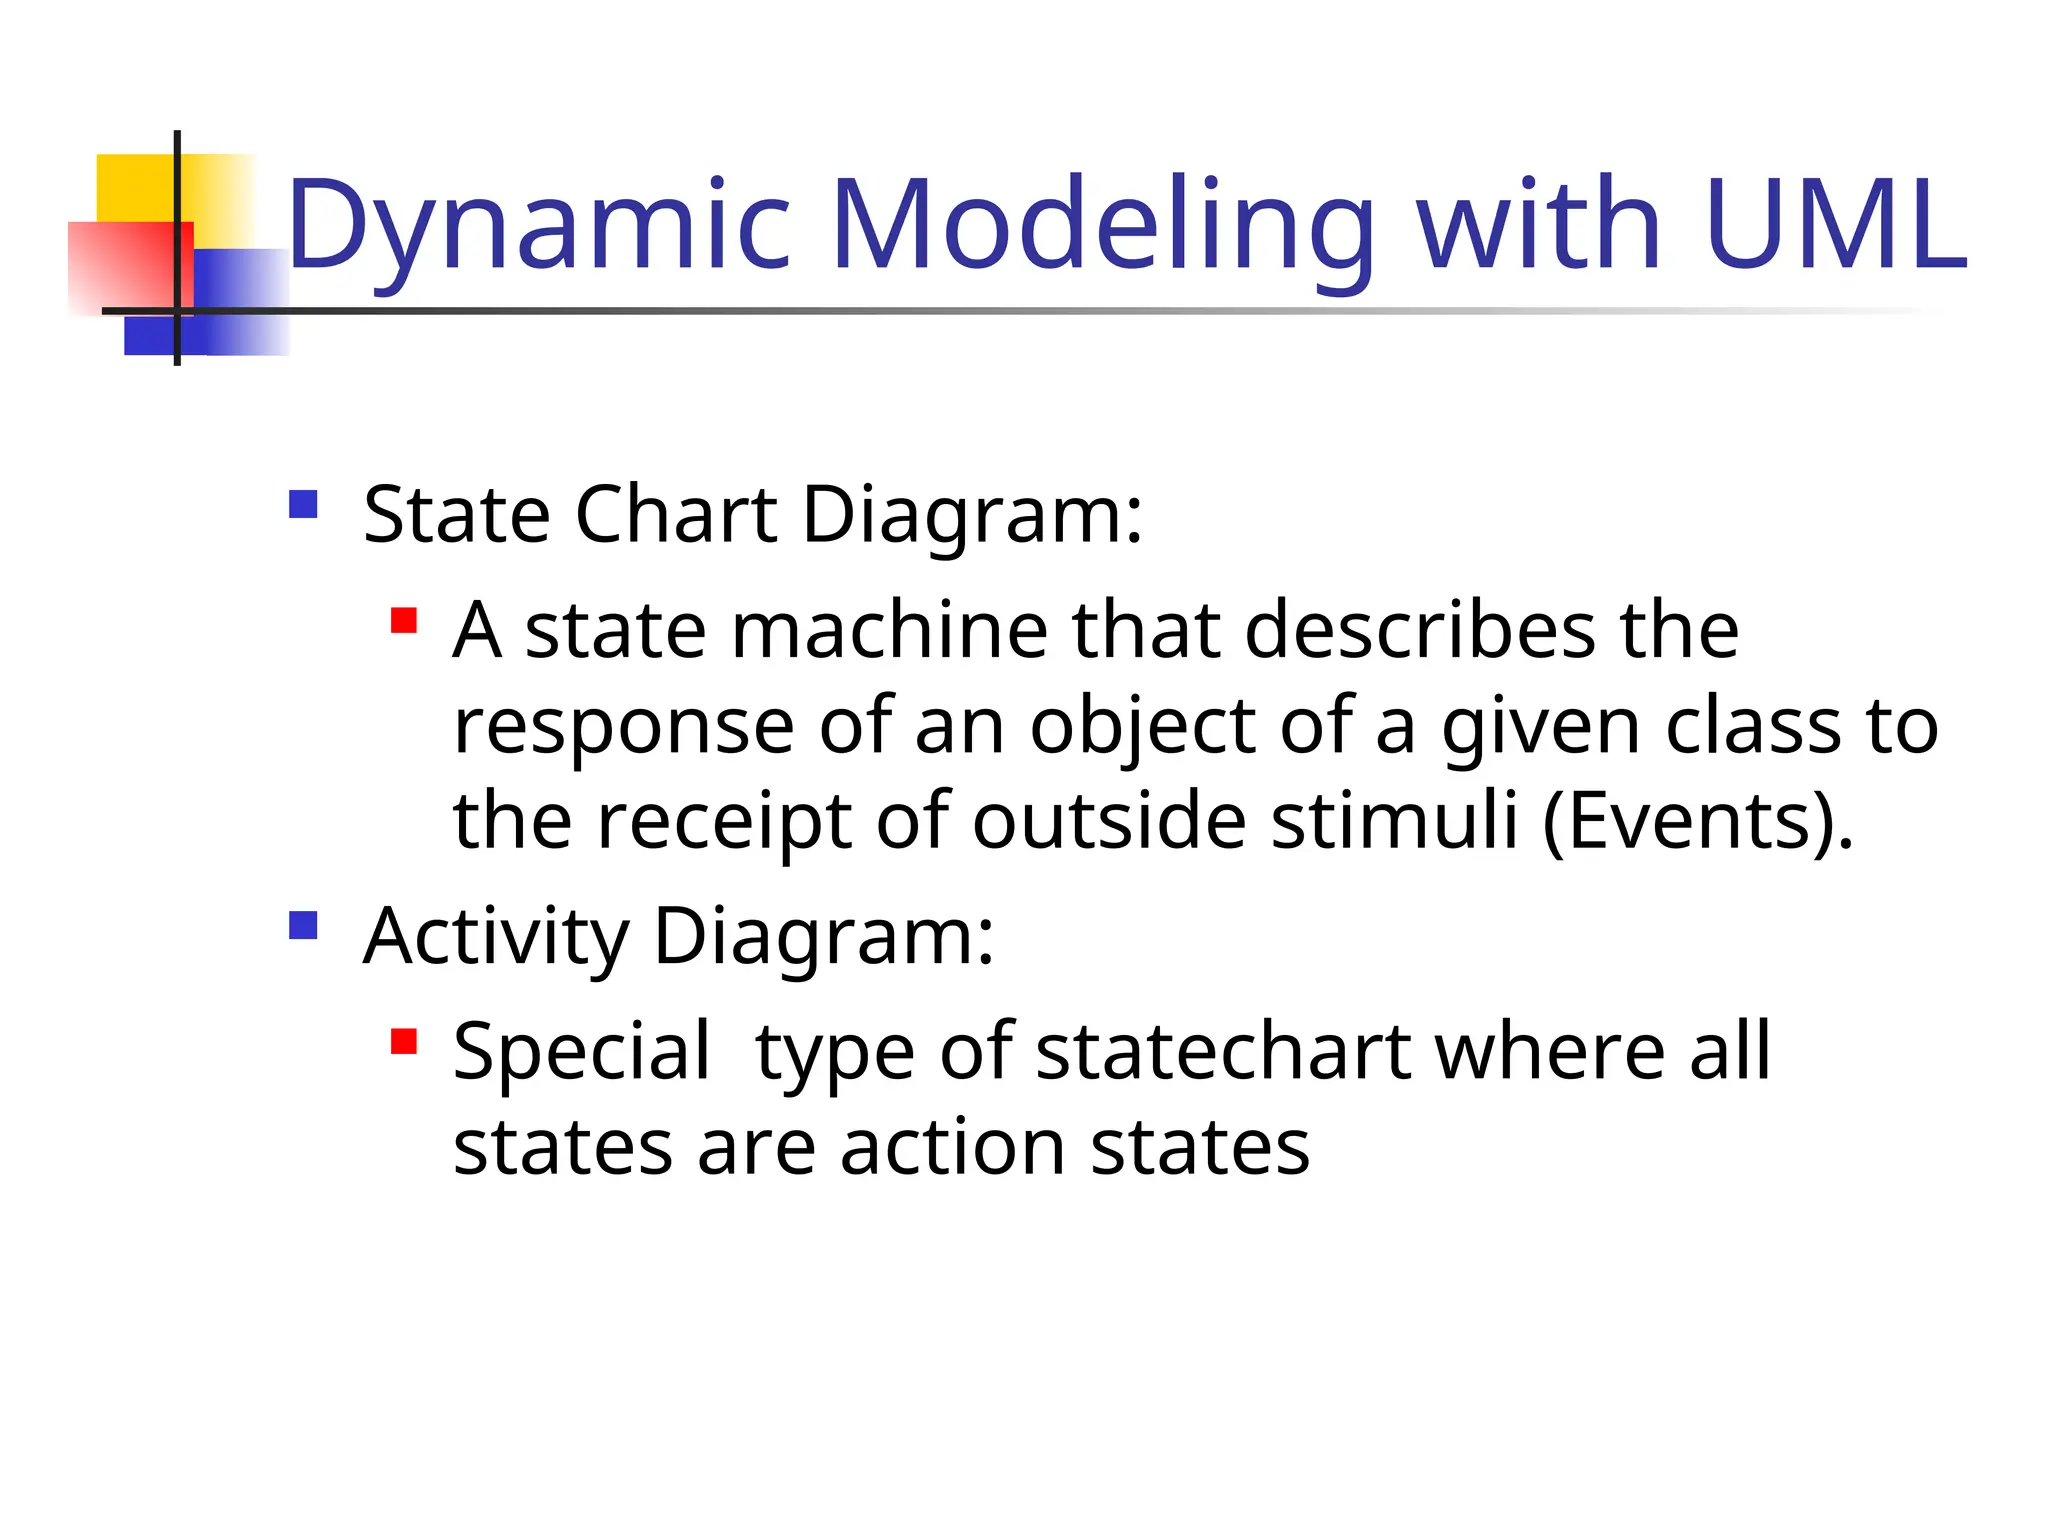
State Chart Diagram:
A state machine that describes the
response of an object of a given class to
the receipt of outside stimuli (Events).
Activity Diagram:
Special type of statechart where all
states are action states
10.
State Chart Diagramvs Sequence
Diagram
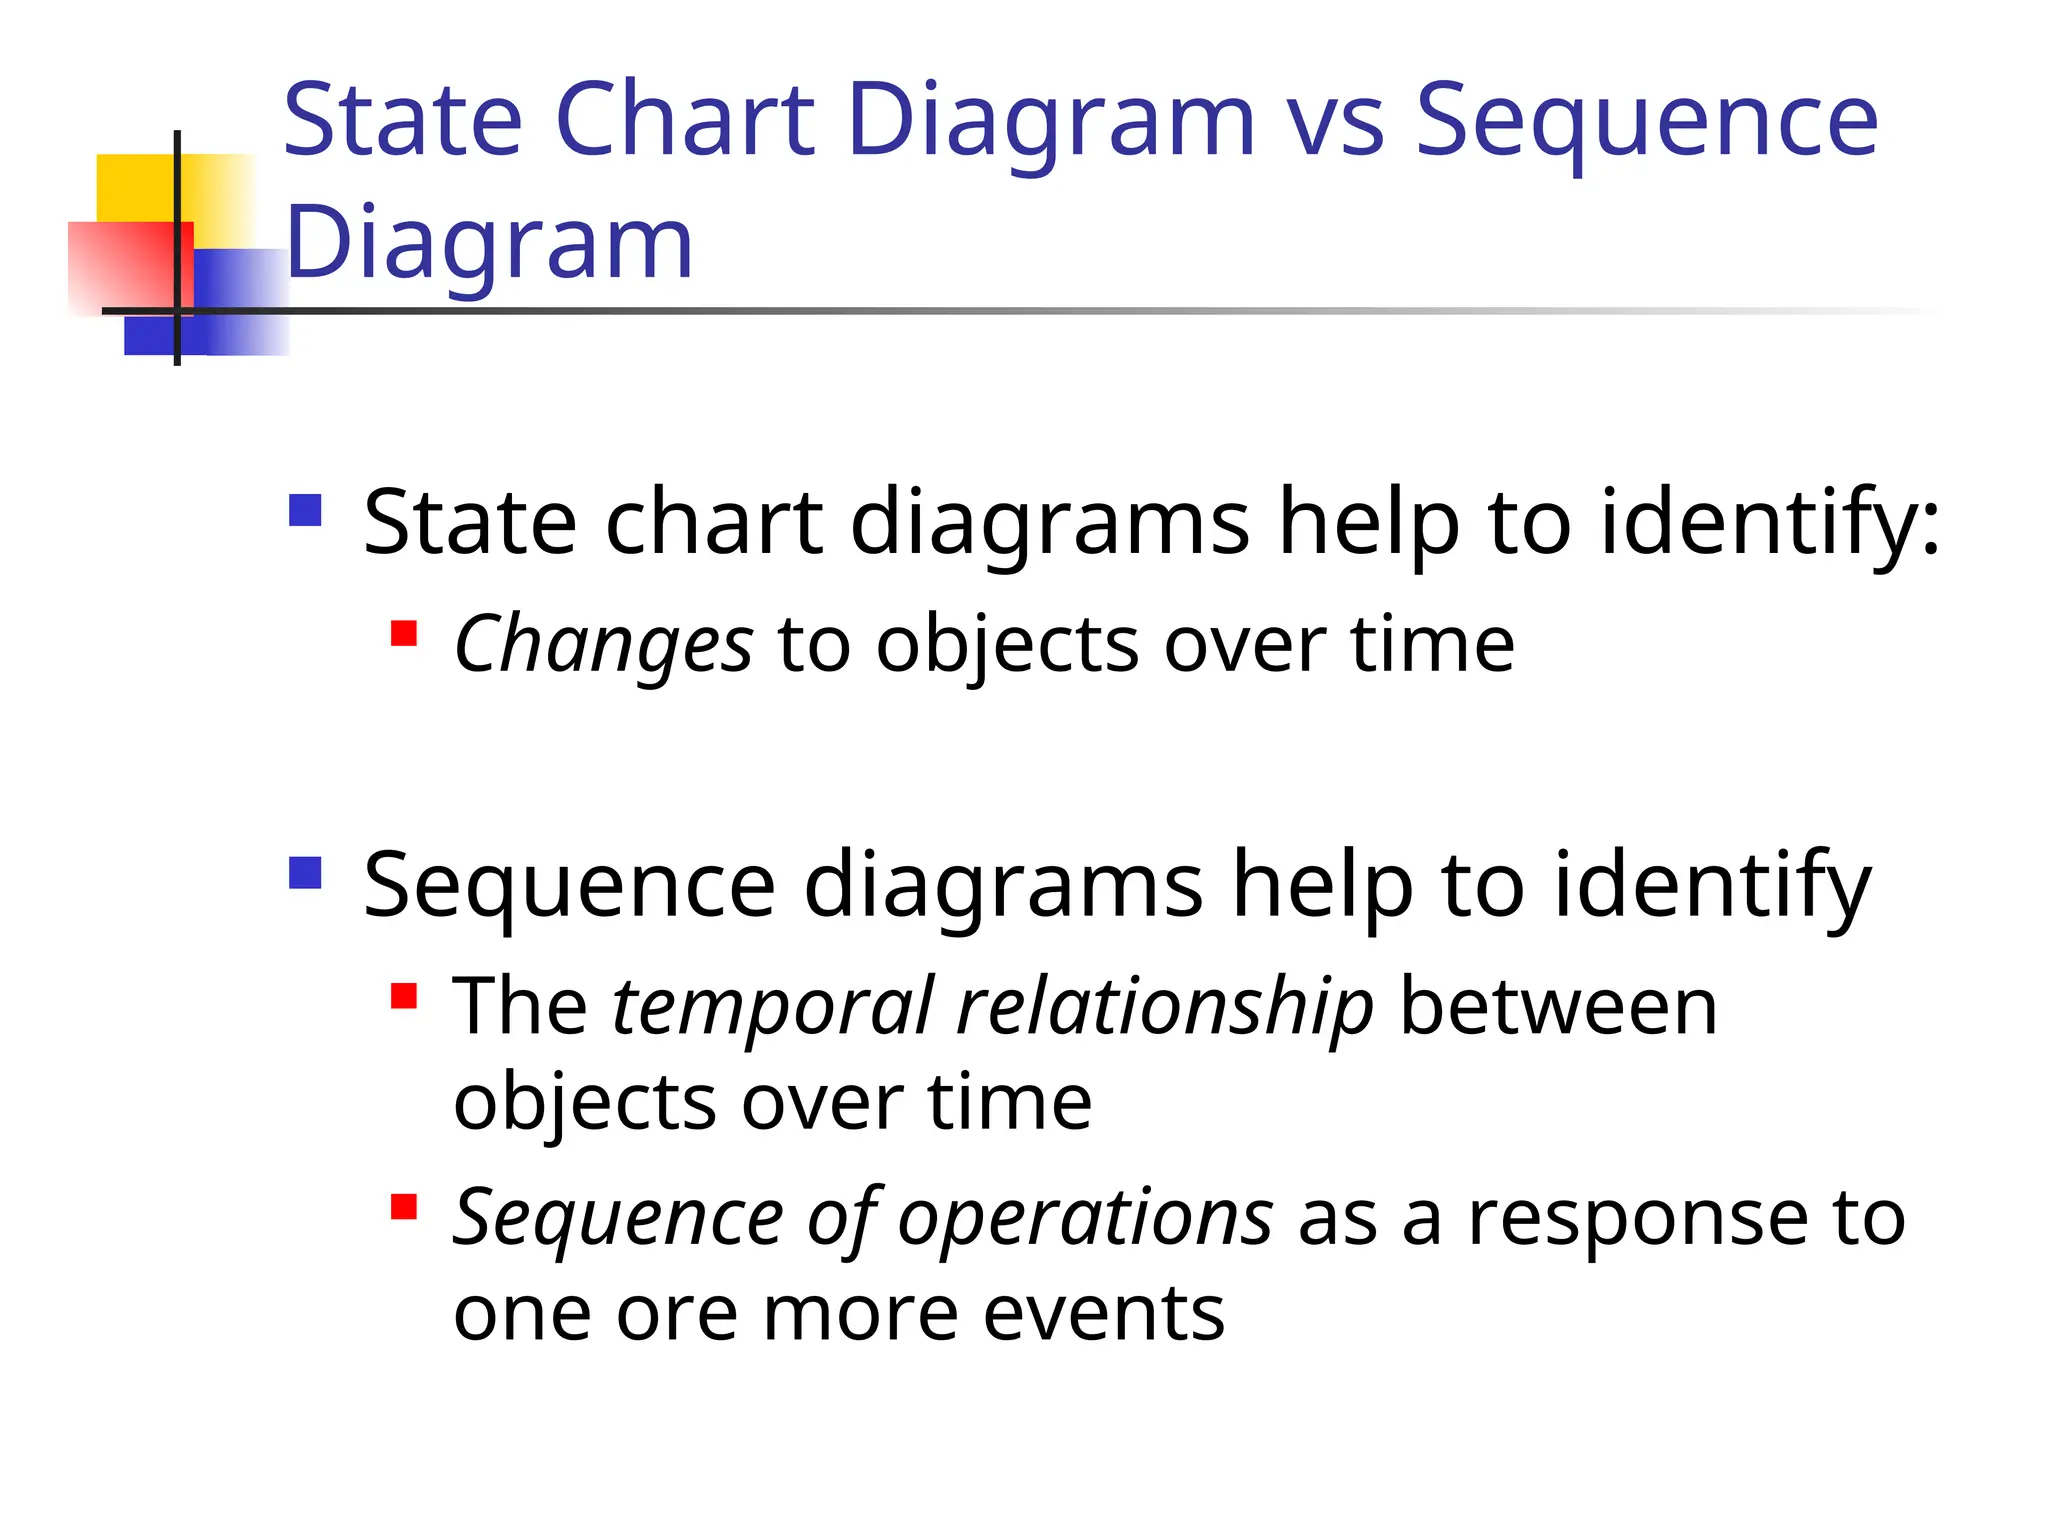
State chart diagrams help to identify:
Changes to objects over time
Sequence diagrams help to identify
The temporal relationship between
objects over time
Sequence of operations as a response to
one ore more events
11.
Dynamic Modeling
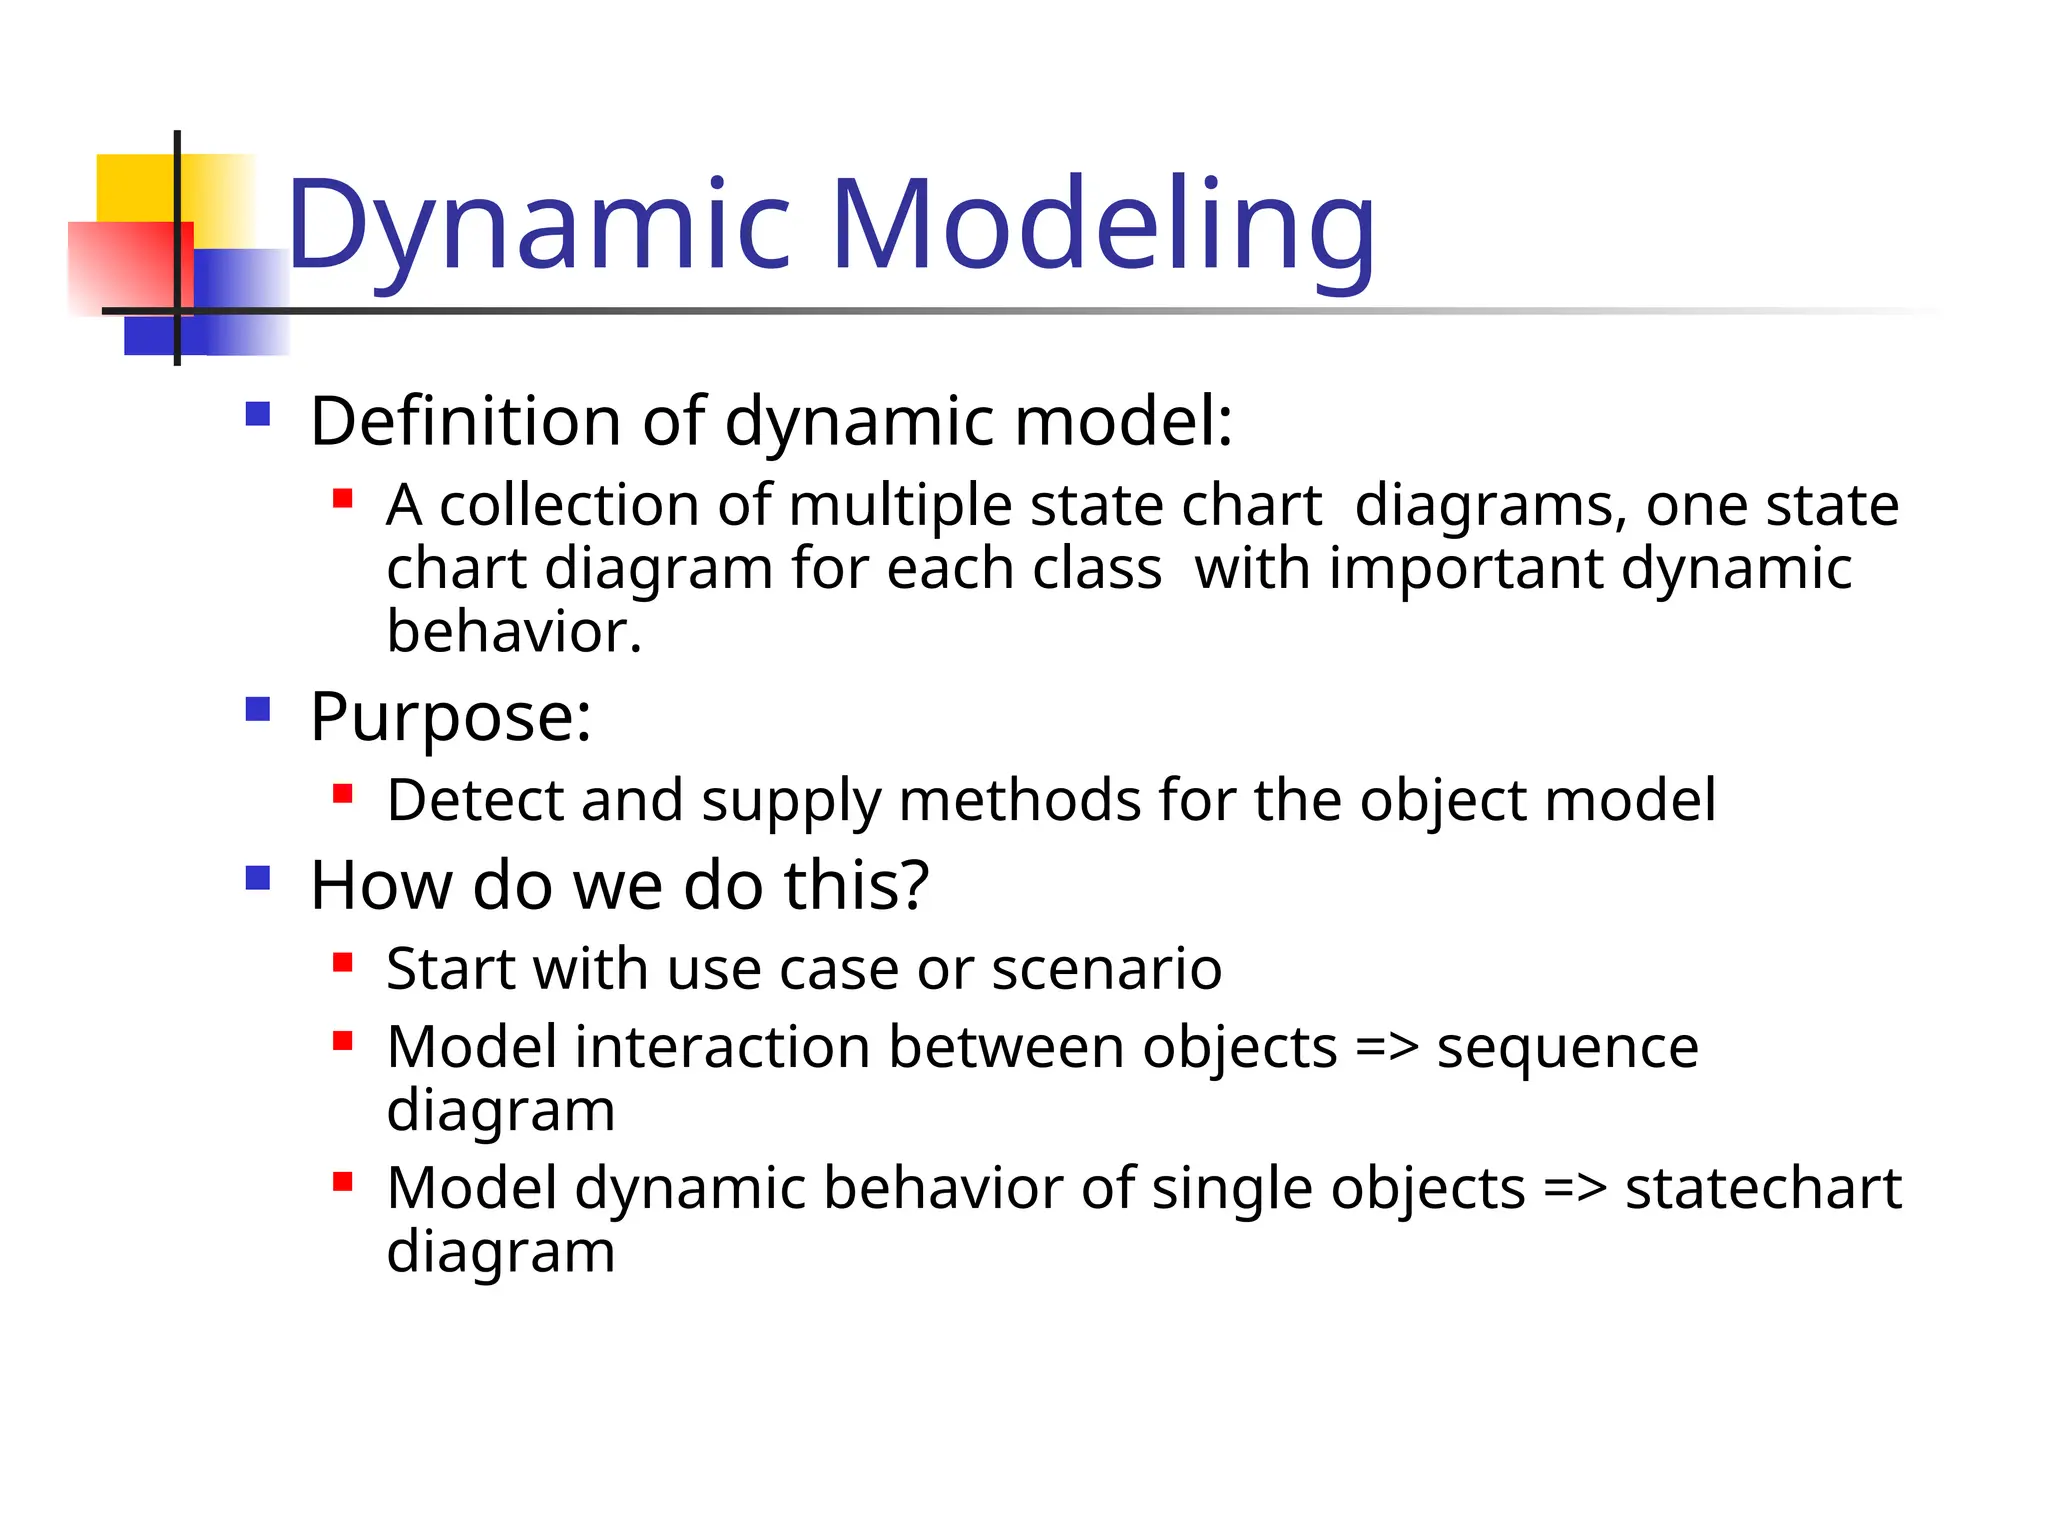
Definitionof dynamic model:
A collection of multiple state chart diagrams, one state
chart diagram for each class with important dynamic
behavior.
Purpose:
Detect and supply methods for the object model
How do we do this?
Start with use case or scenario
Model interaction between objects => sequence
diagram
Model dynamic behavior of single objects => statechart
diagram
12.
Start with Flowof Events from Use
Case
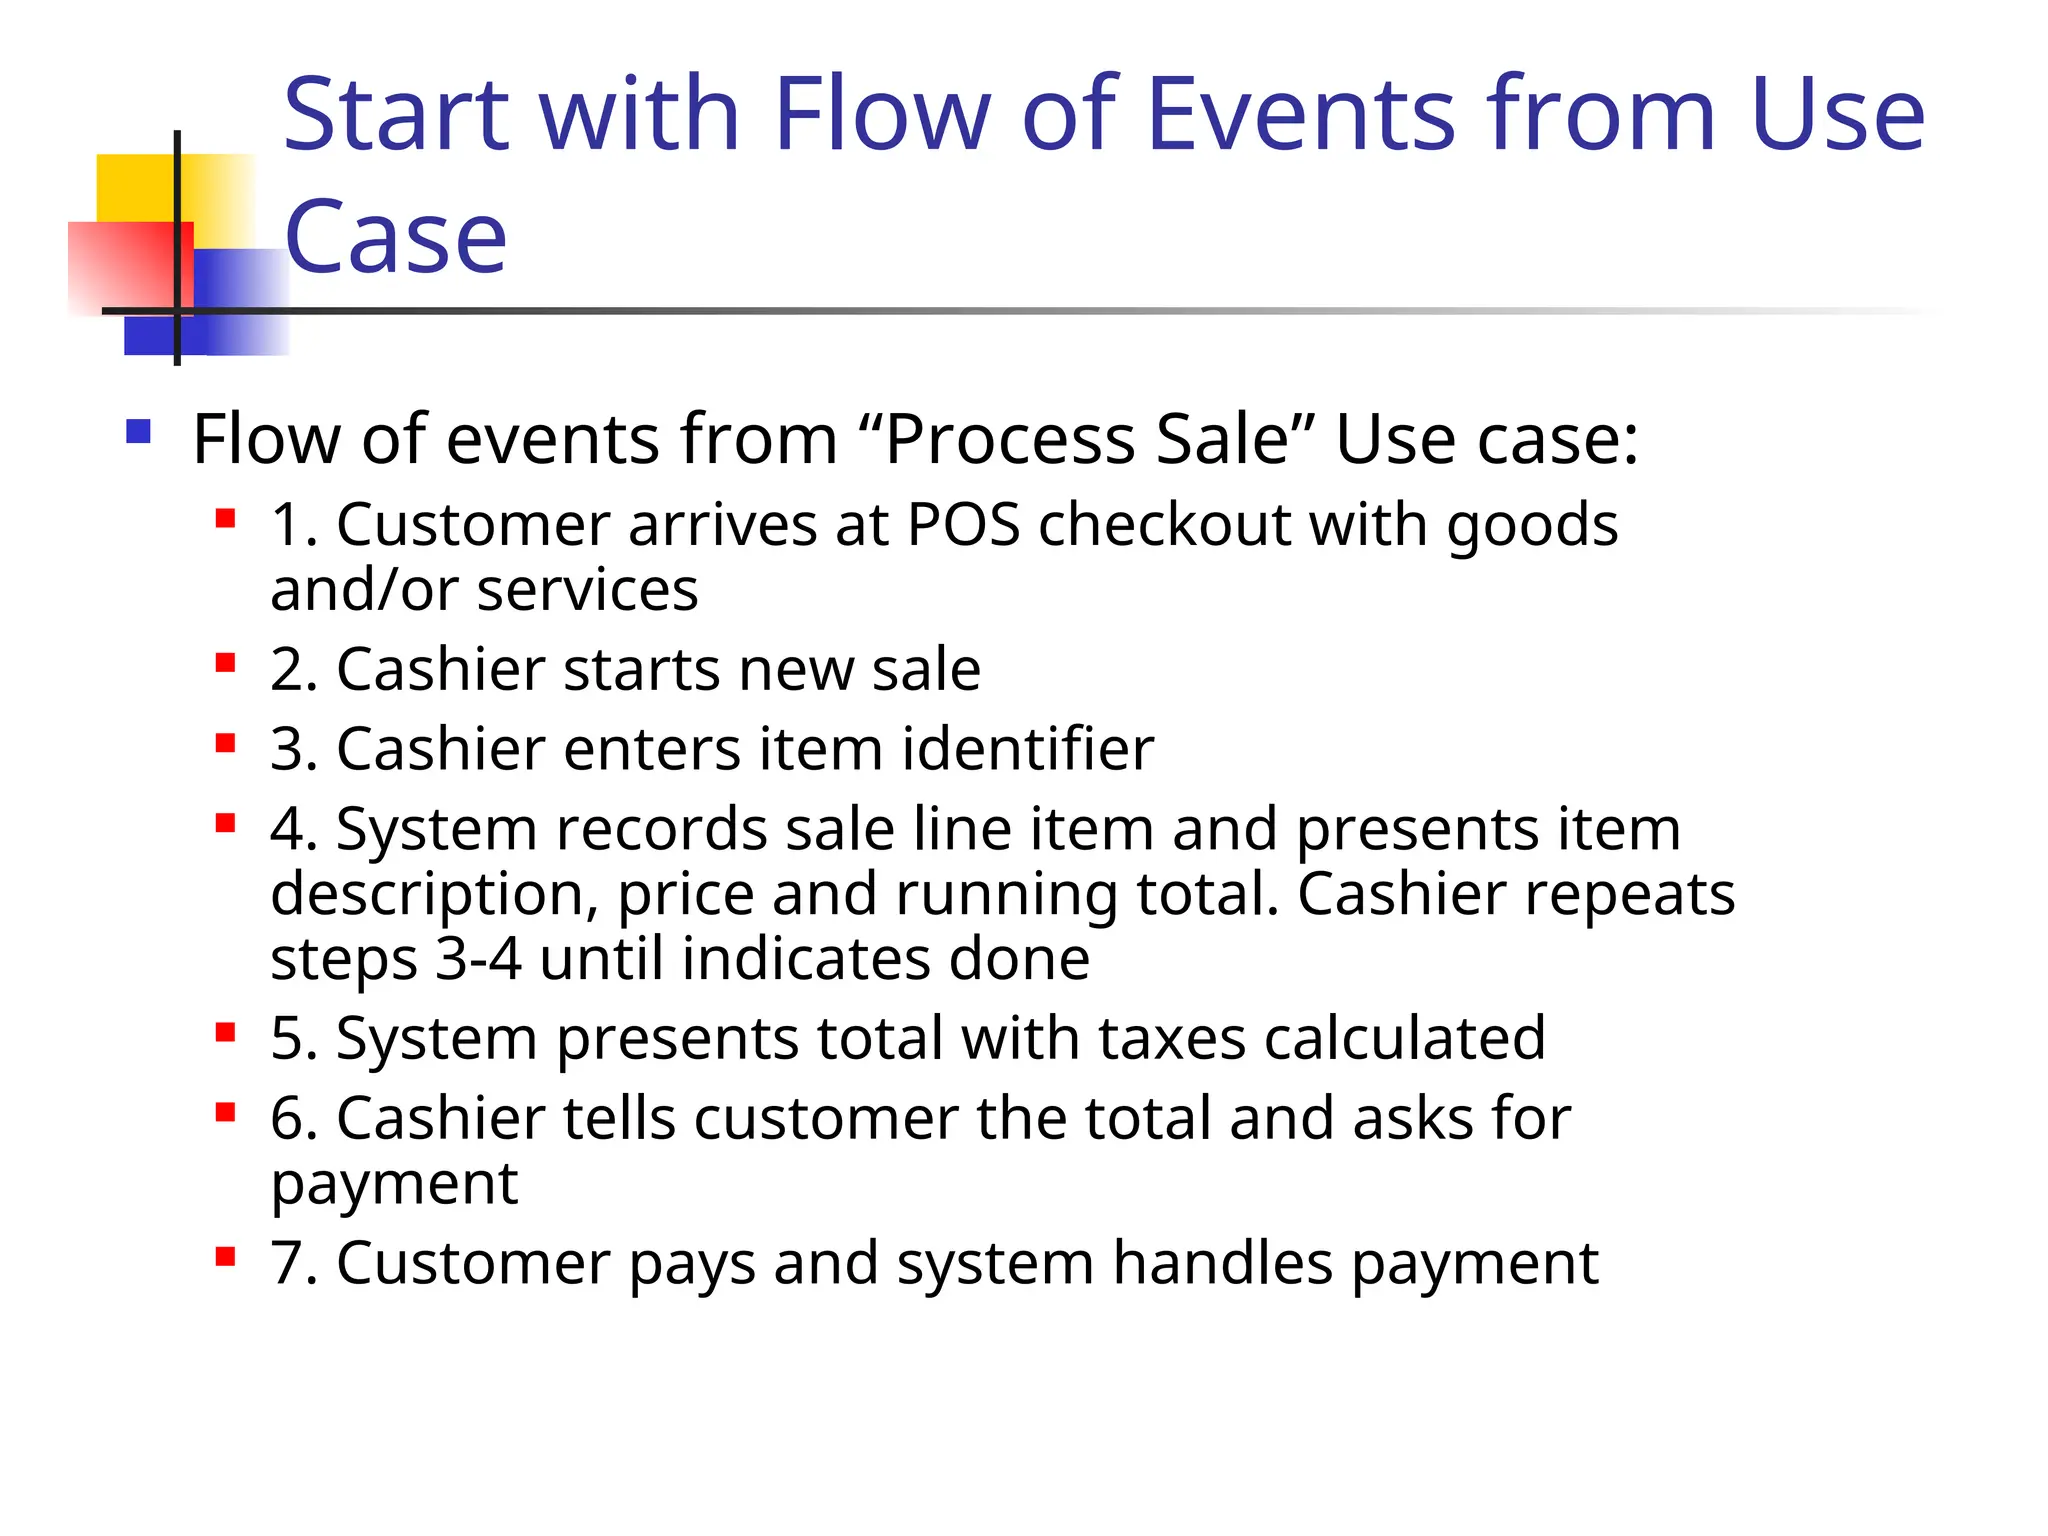
Flow of events from “Process Sale” Use case:
1. Customer arrives at POS checkout with goods
and/or services
2. Cashier starts new sale
3. Cashier enters item identifier
4. System records sale line item and presents item
description, price and running total. Cashier repeats
steps 3-4 until indicates done
5. System presents total with taxes calculated
6. Cashier tells customer the total and asks for
payment
7. Customer pays and system handles payment
13.
What is anEvent?
Something that happens at a point in time
Relation of events to each other:
Causally related: Before, after,
Causally unrelated: concurrent
An event sends information from one object
to another
One distinguishes between
The instance of an event : enterItem
The attributes of an event : itemID, quantity
14.
Sequence Diagrams
Fromthe flow of events in the use case or scenario proceed
to the sequence diagram
A sequence diagram is a graphical description of objects
participating in a use case or scenario using a DAG (directed
acyclic graph) notation
Relation to object identification:
Objects/classes have already been identified during
object modeling
Objects are identified as a result of dynamic modeling
Heuristic:
An event always has a sender and a receiver. Find them
for each event => These are the objects participating in
the use case
15.
Sequence Diagrams
Usecases and participating objects are found. What now?
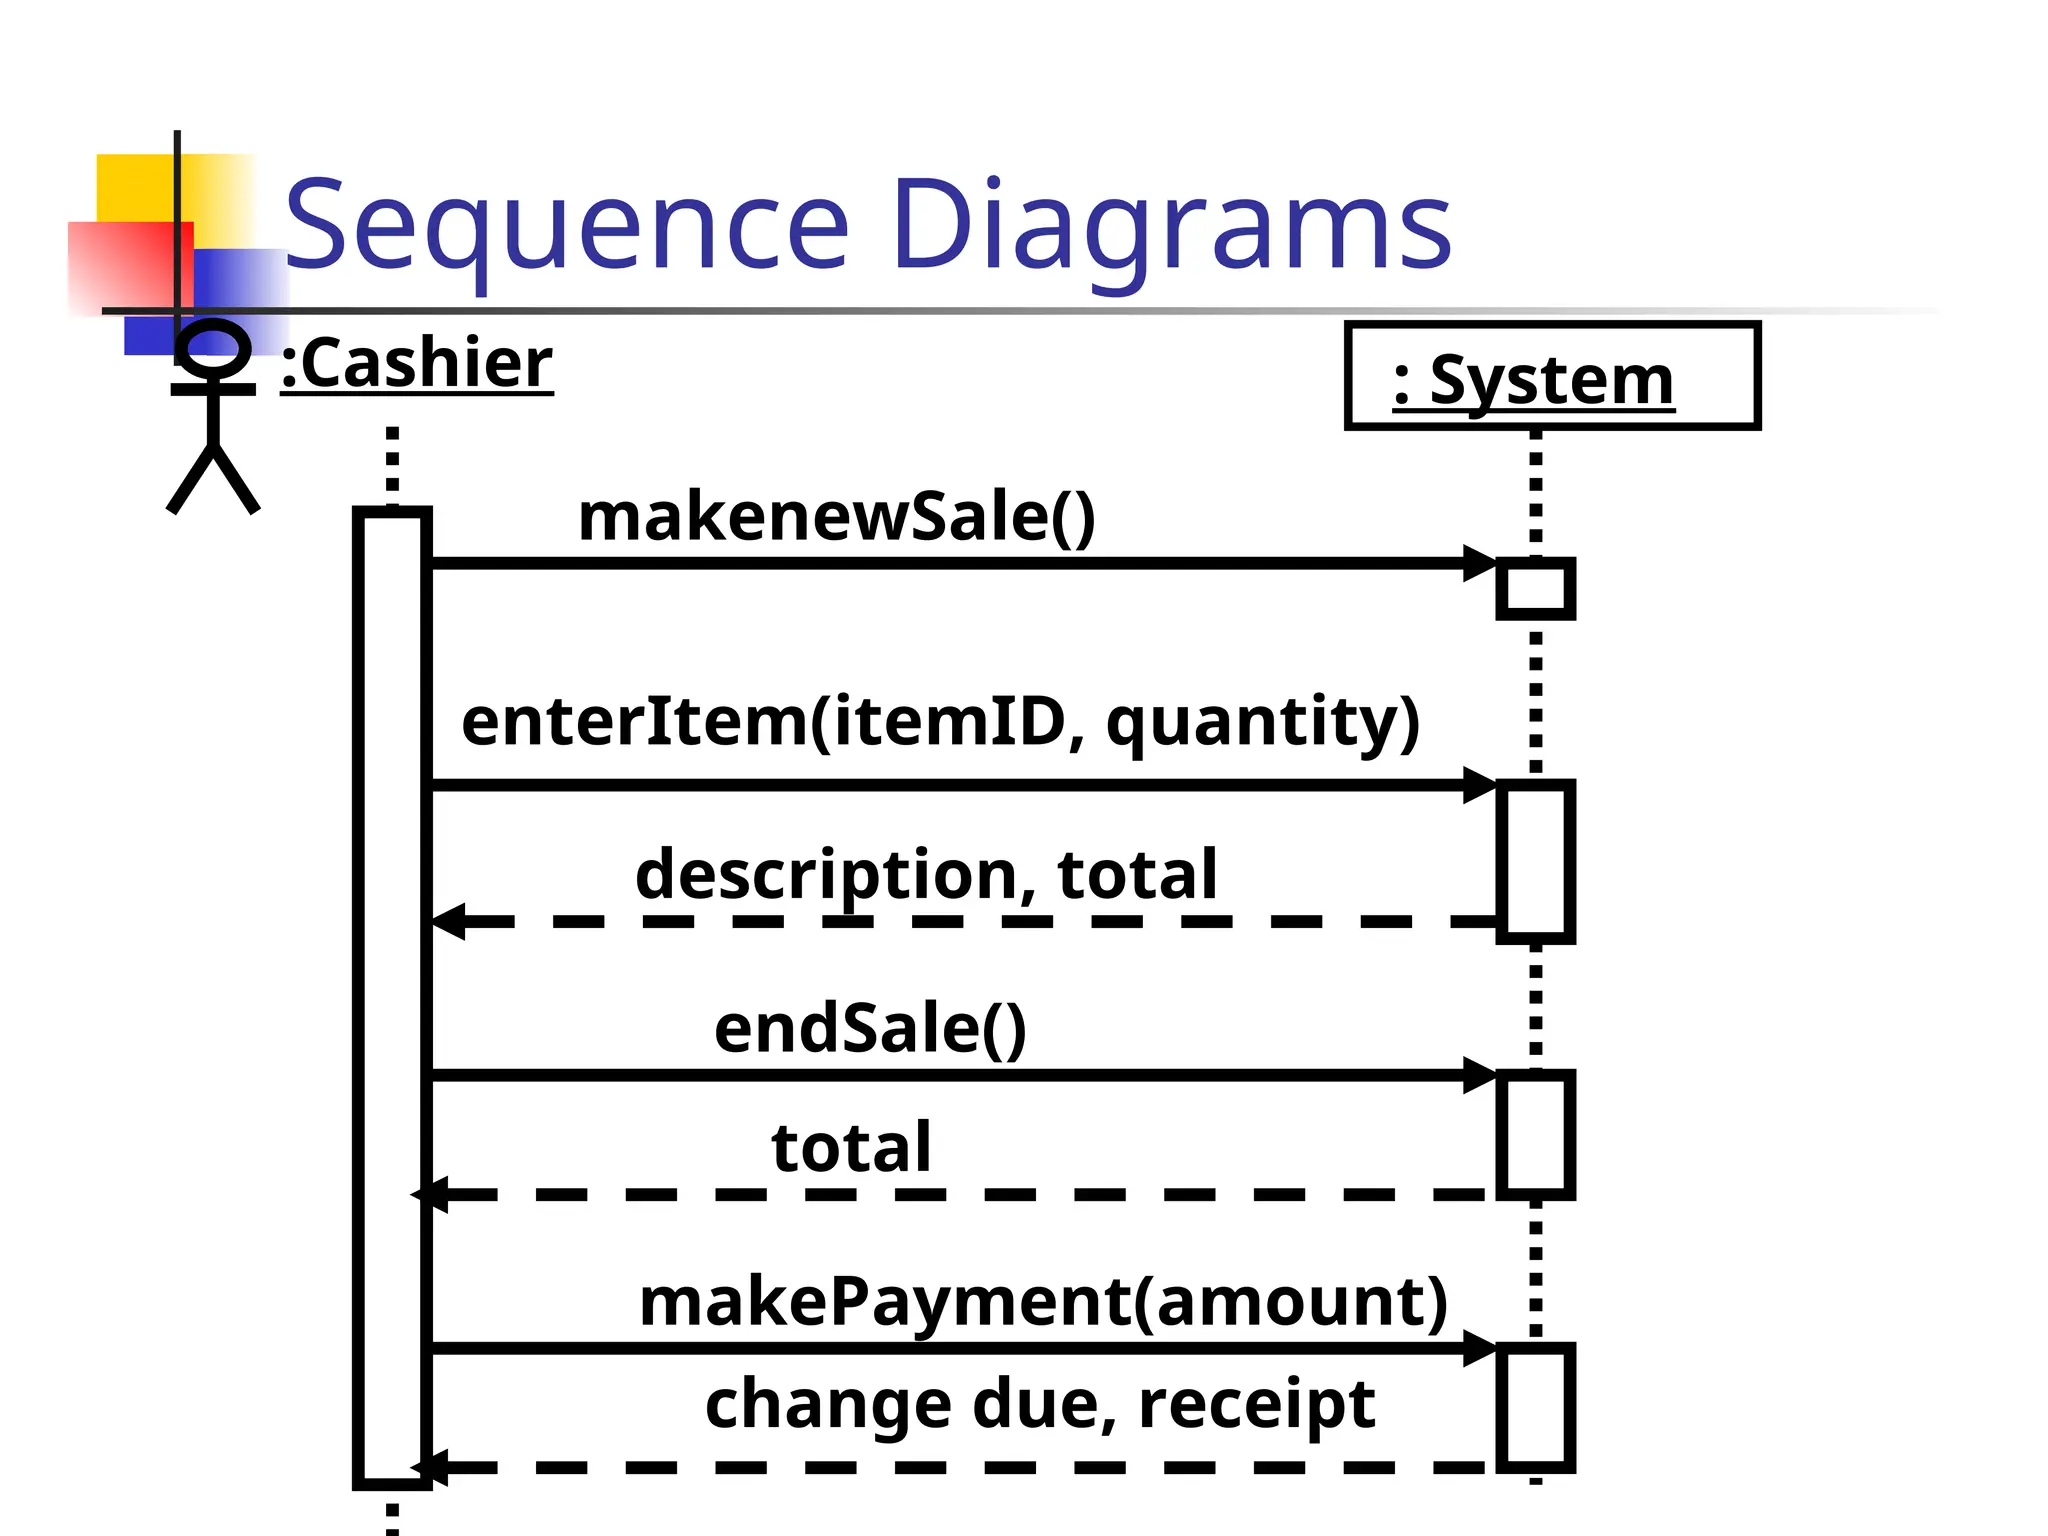
Sequence diagram - A diagram that shows object
interactions arranged in time sequence for a specific
use case or scenario.
A sequence diagram includes time but does not include
object relationships.
Sequence diagrams are used to describe use cases (i.e.,
all possible interactions between participating objects)
and scenarios (i.e., one possible interaction)
In other words: A sequence diagram is useful to model a
use case or scenario with its participating objects. It often
leads to the detection of new participating objects.
16.
Drawing Sequence
Diagrams
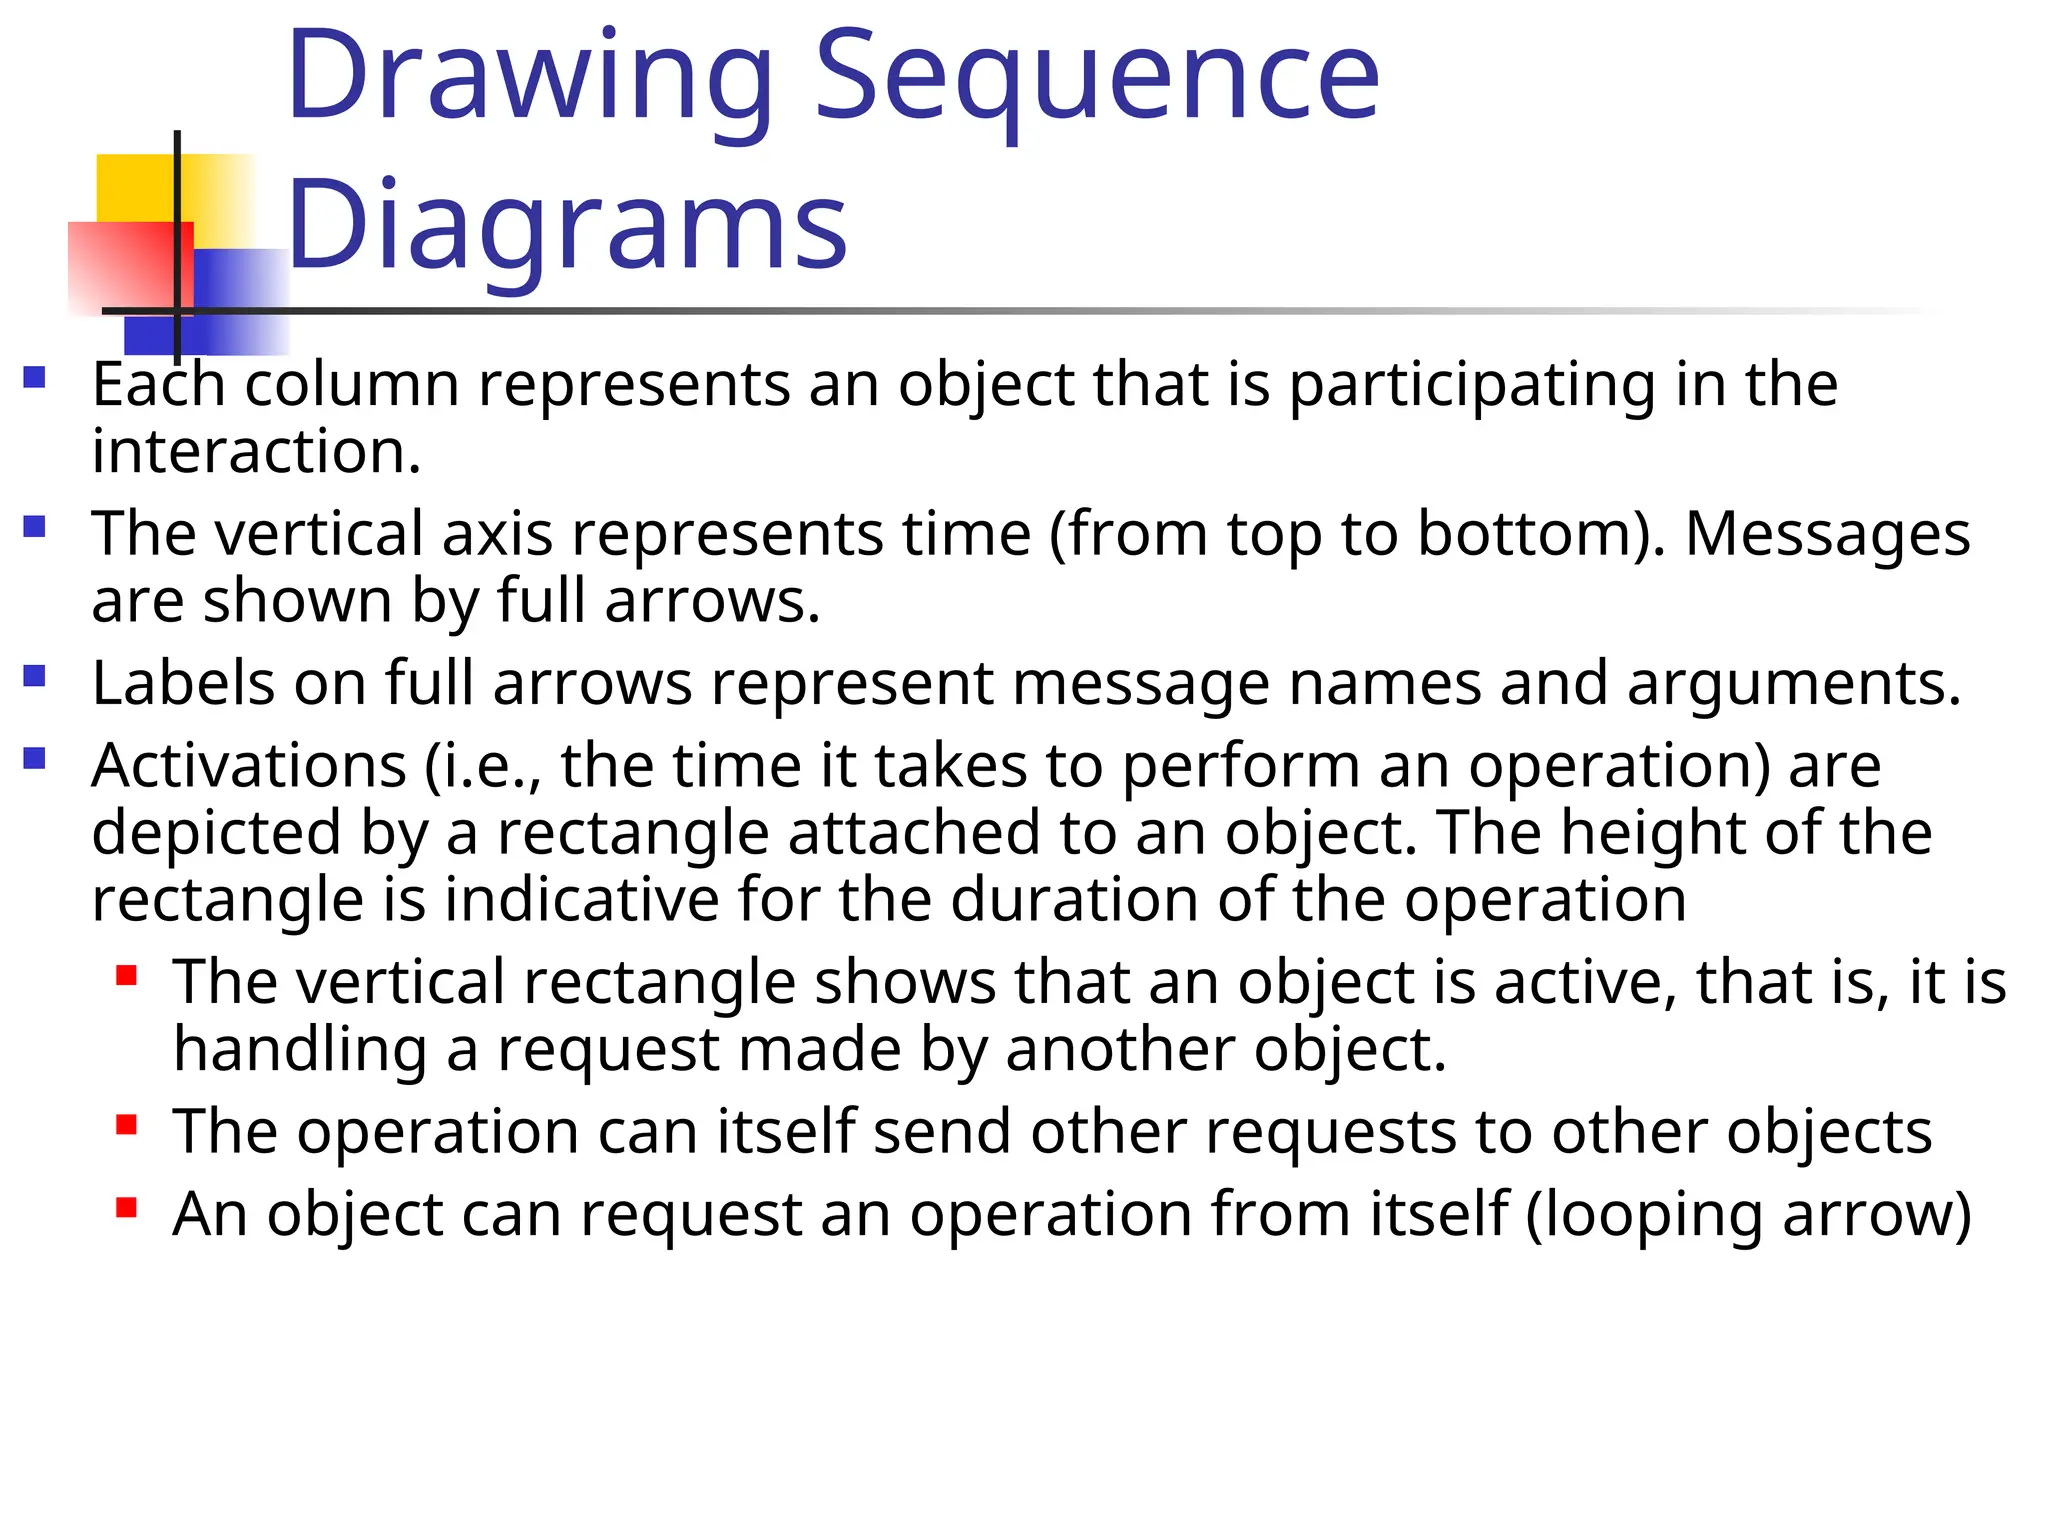
Eachcolumn represents an object that is participating in the
interaction.
The vertical axis represents time (from top to bottom). Messages
are shown by full arrows.
Labels on full arrows represent message names and arguments.
Activations (i.e., the time it takes to perform an operation) are
depicted by a rectangle attached to an object. The height of the
rectangle is indicative for the duration of the operation
The vertical rectangle shows that an object is active, that is, it is
handling a request made by another object.
The operation can itself send other requests to other objects
An object can request an operation from itself (looping arrow)
Sequence Diagrams
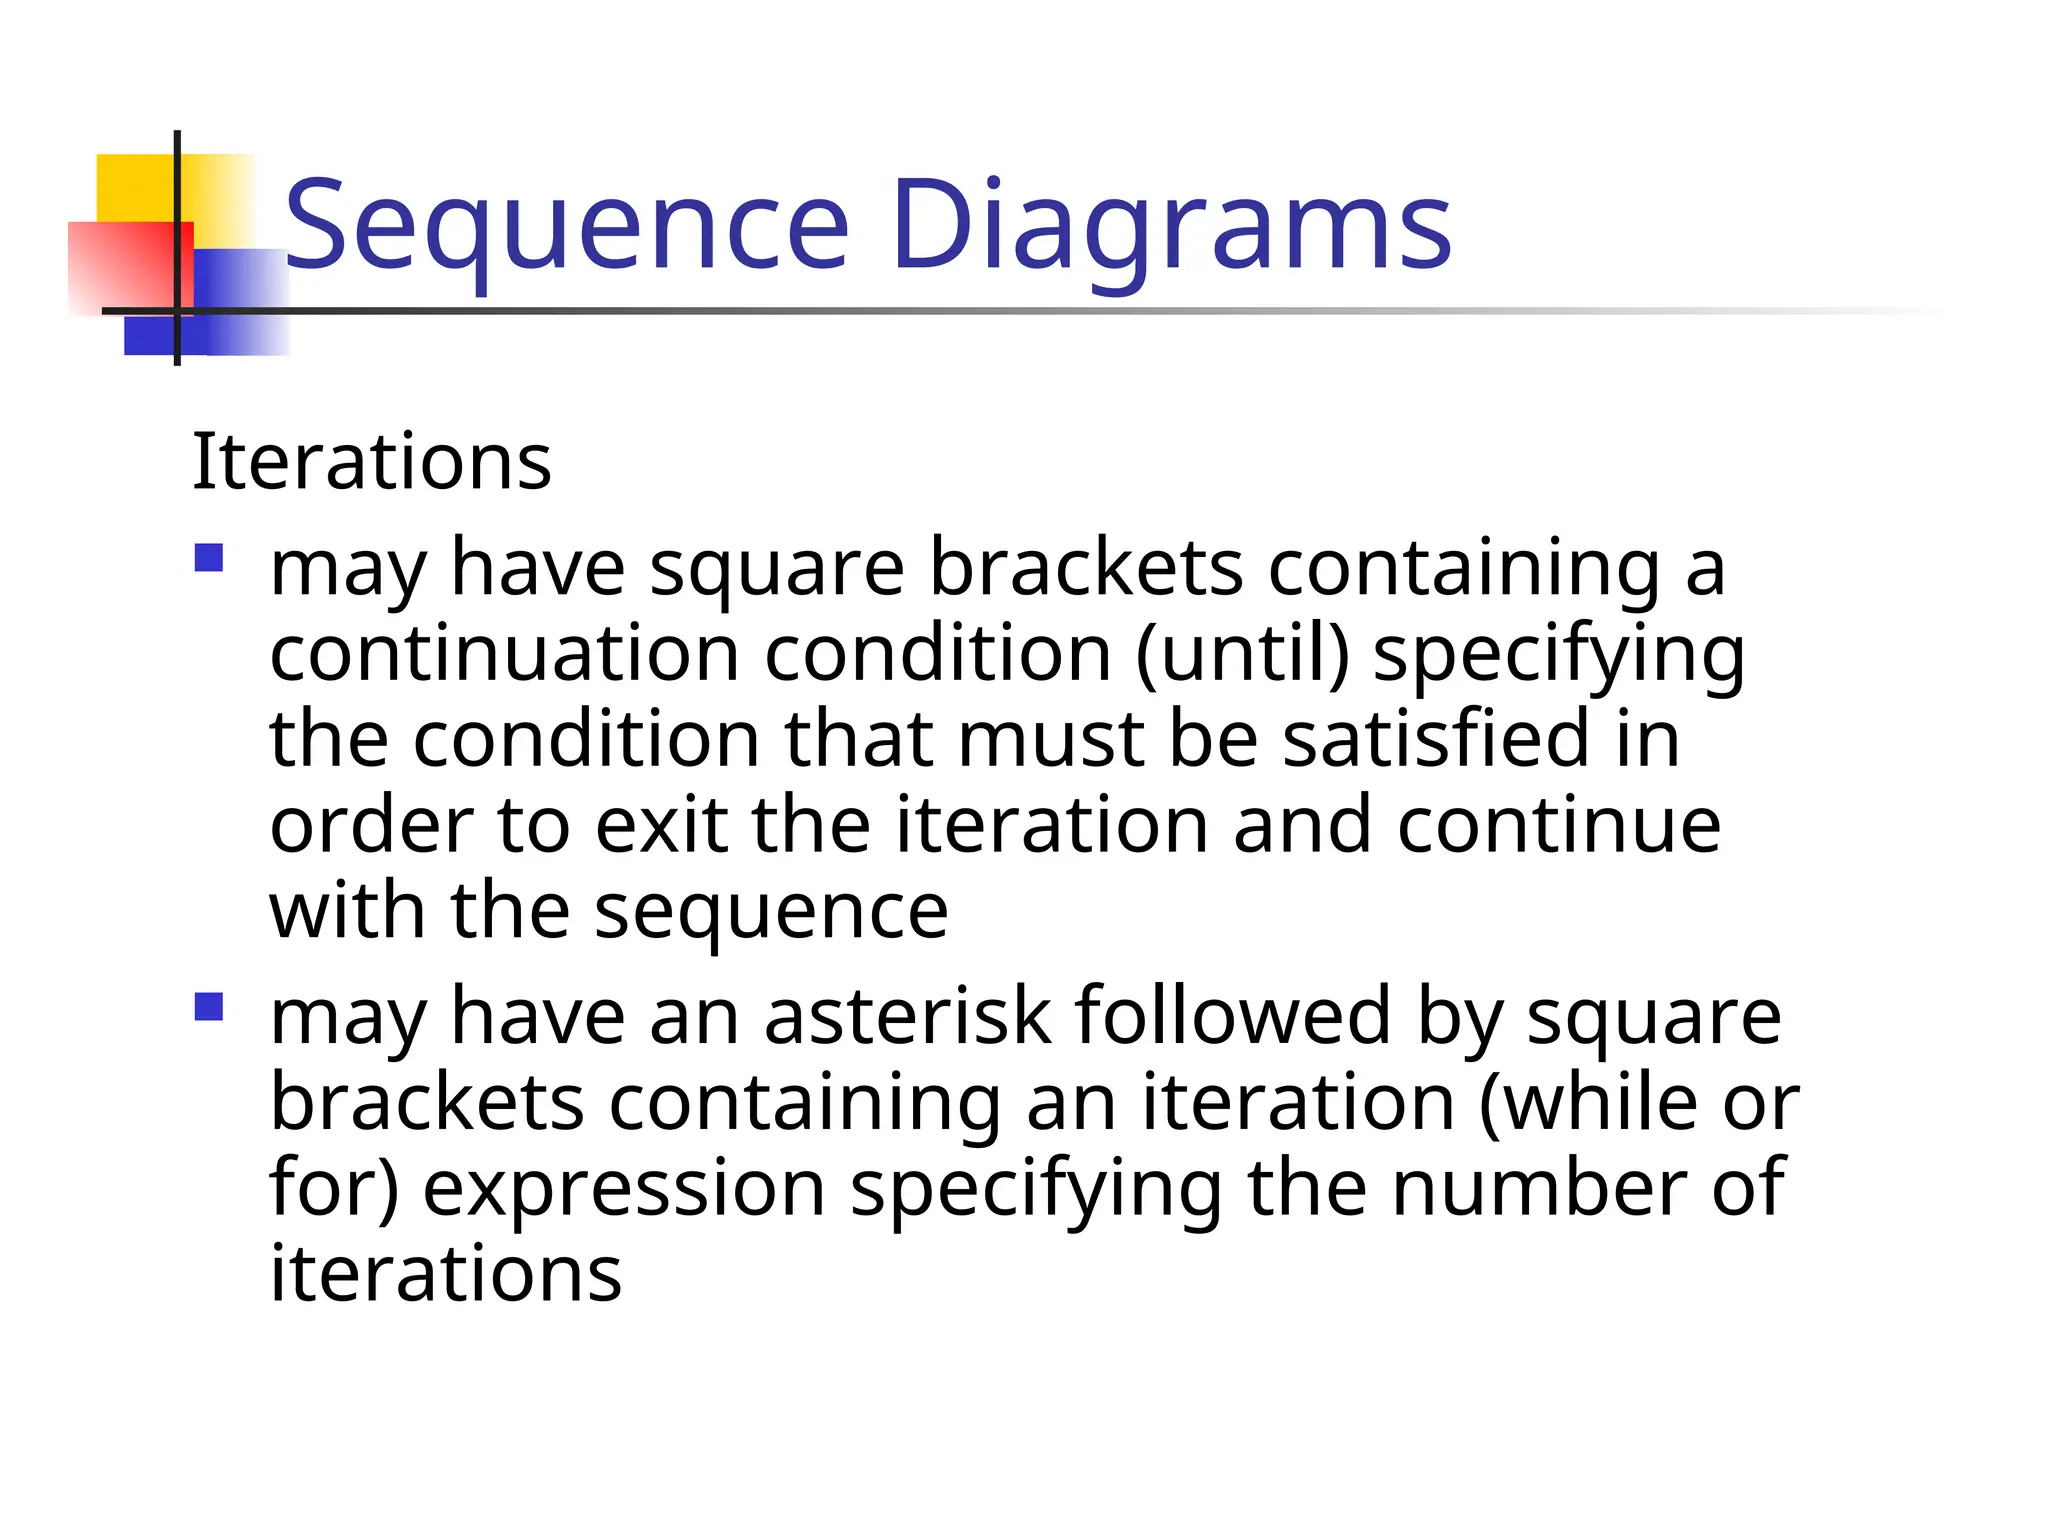
Iterations
mayhave square brackets containing a
continuation condition (until) specifying
the condition that must be satisfied in
order to exit the iteration and continue
with the sequence
may have an asterisk followed by square
brackets containing an iteration (while or
for) expression specifying the number of
iterations
19.
Sequence Diagrams
Iterationin sequence diagrams is denoted by
a box with an associated iteration expression.
:Cashier
makenewSale()
: System
enterItem(itemID, quantity)
description, total
*[more items]
20.
Sequence Diagrams
Iterationin sequence diagrams is denoted by
a box with an associated continuation
expression.
:Cashier
makenewSale()
: System
enterItem(itemID, quantity)
description, total
[no more items]
21.
Sequence Diagrams
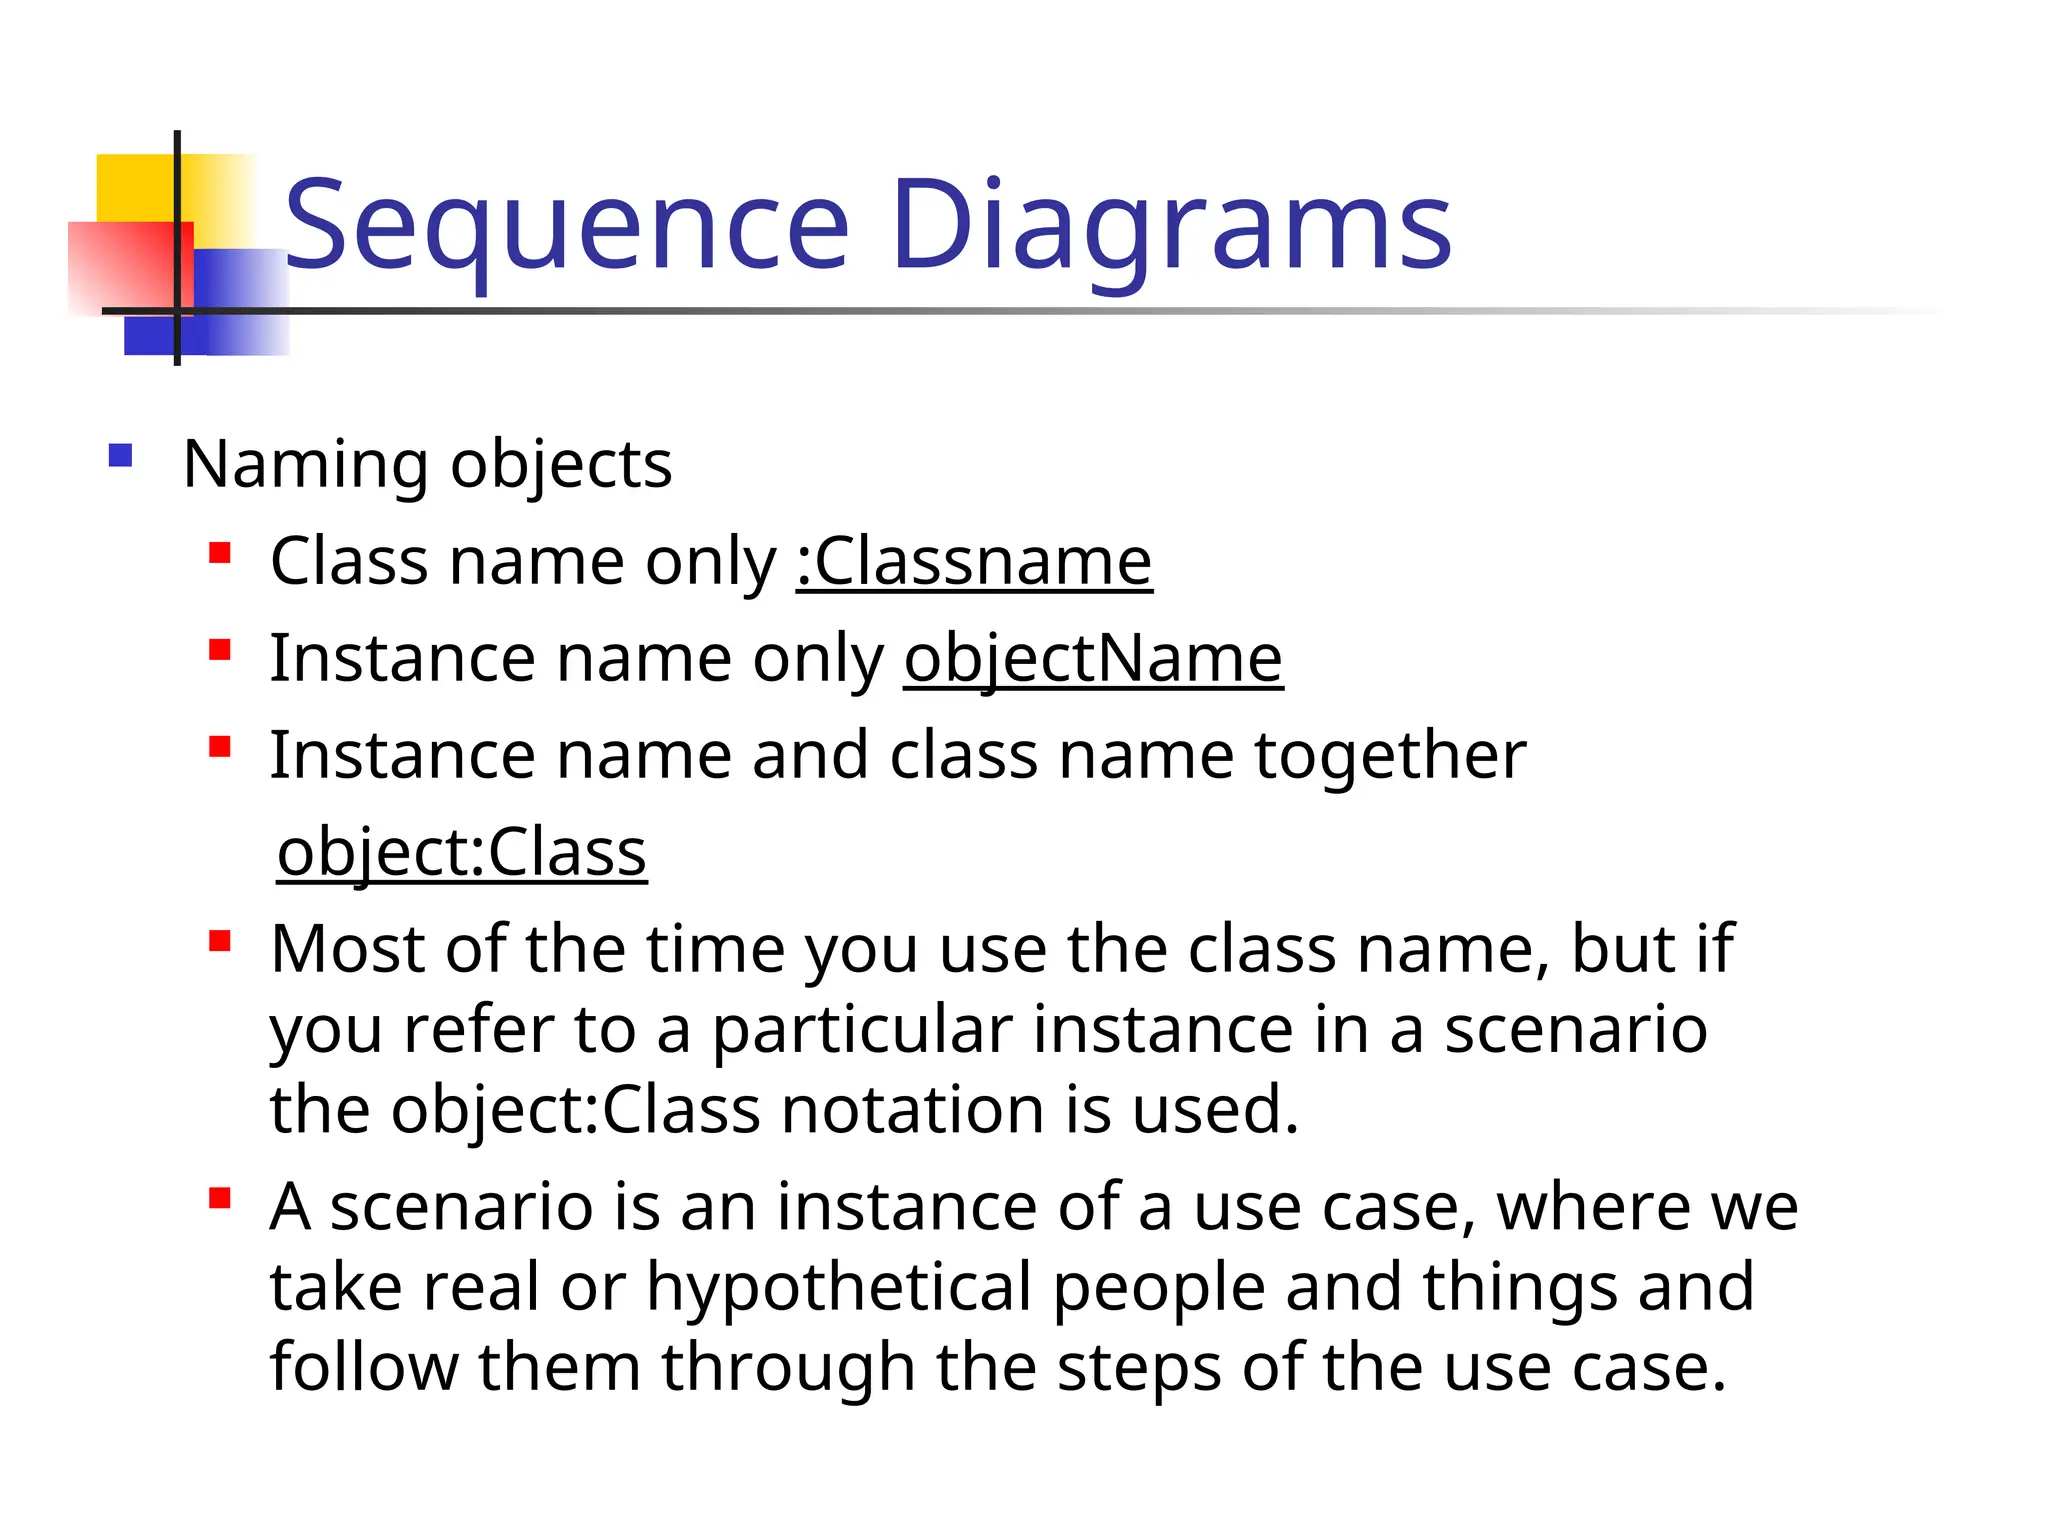
Namingobjects
Class name only :Classname
Instance name only objectName
Instance name and class name together
object:Class
Most of the time you use the class name, but if
you refer to a particular instance in a scenario
the object:Class notation is used.
A scenario is an instance of a use case, where we
take real or hypothetical people and things and
follow them through the steps of the use case.
22.
Sequence Diagrams
Conditionalmessages: A message might
contain a guard condition denoted in
square brackets
obj1:Class
[x < 15] calculate()
obj2: Class
message()
23.
Sequence Diagrams
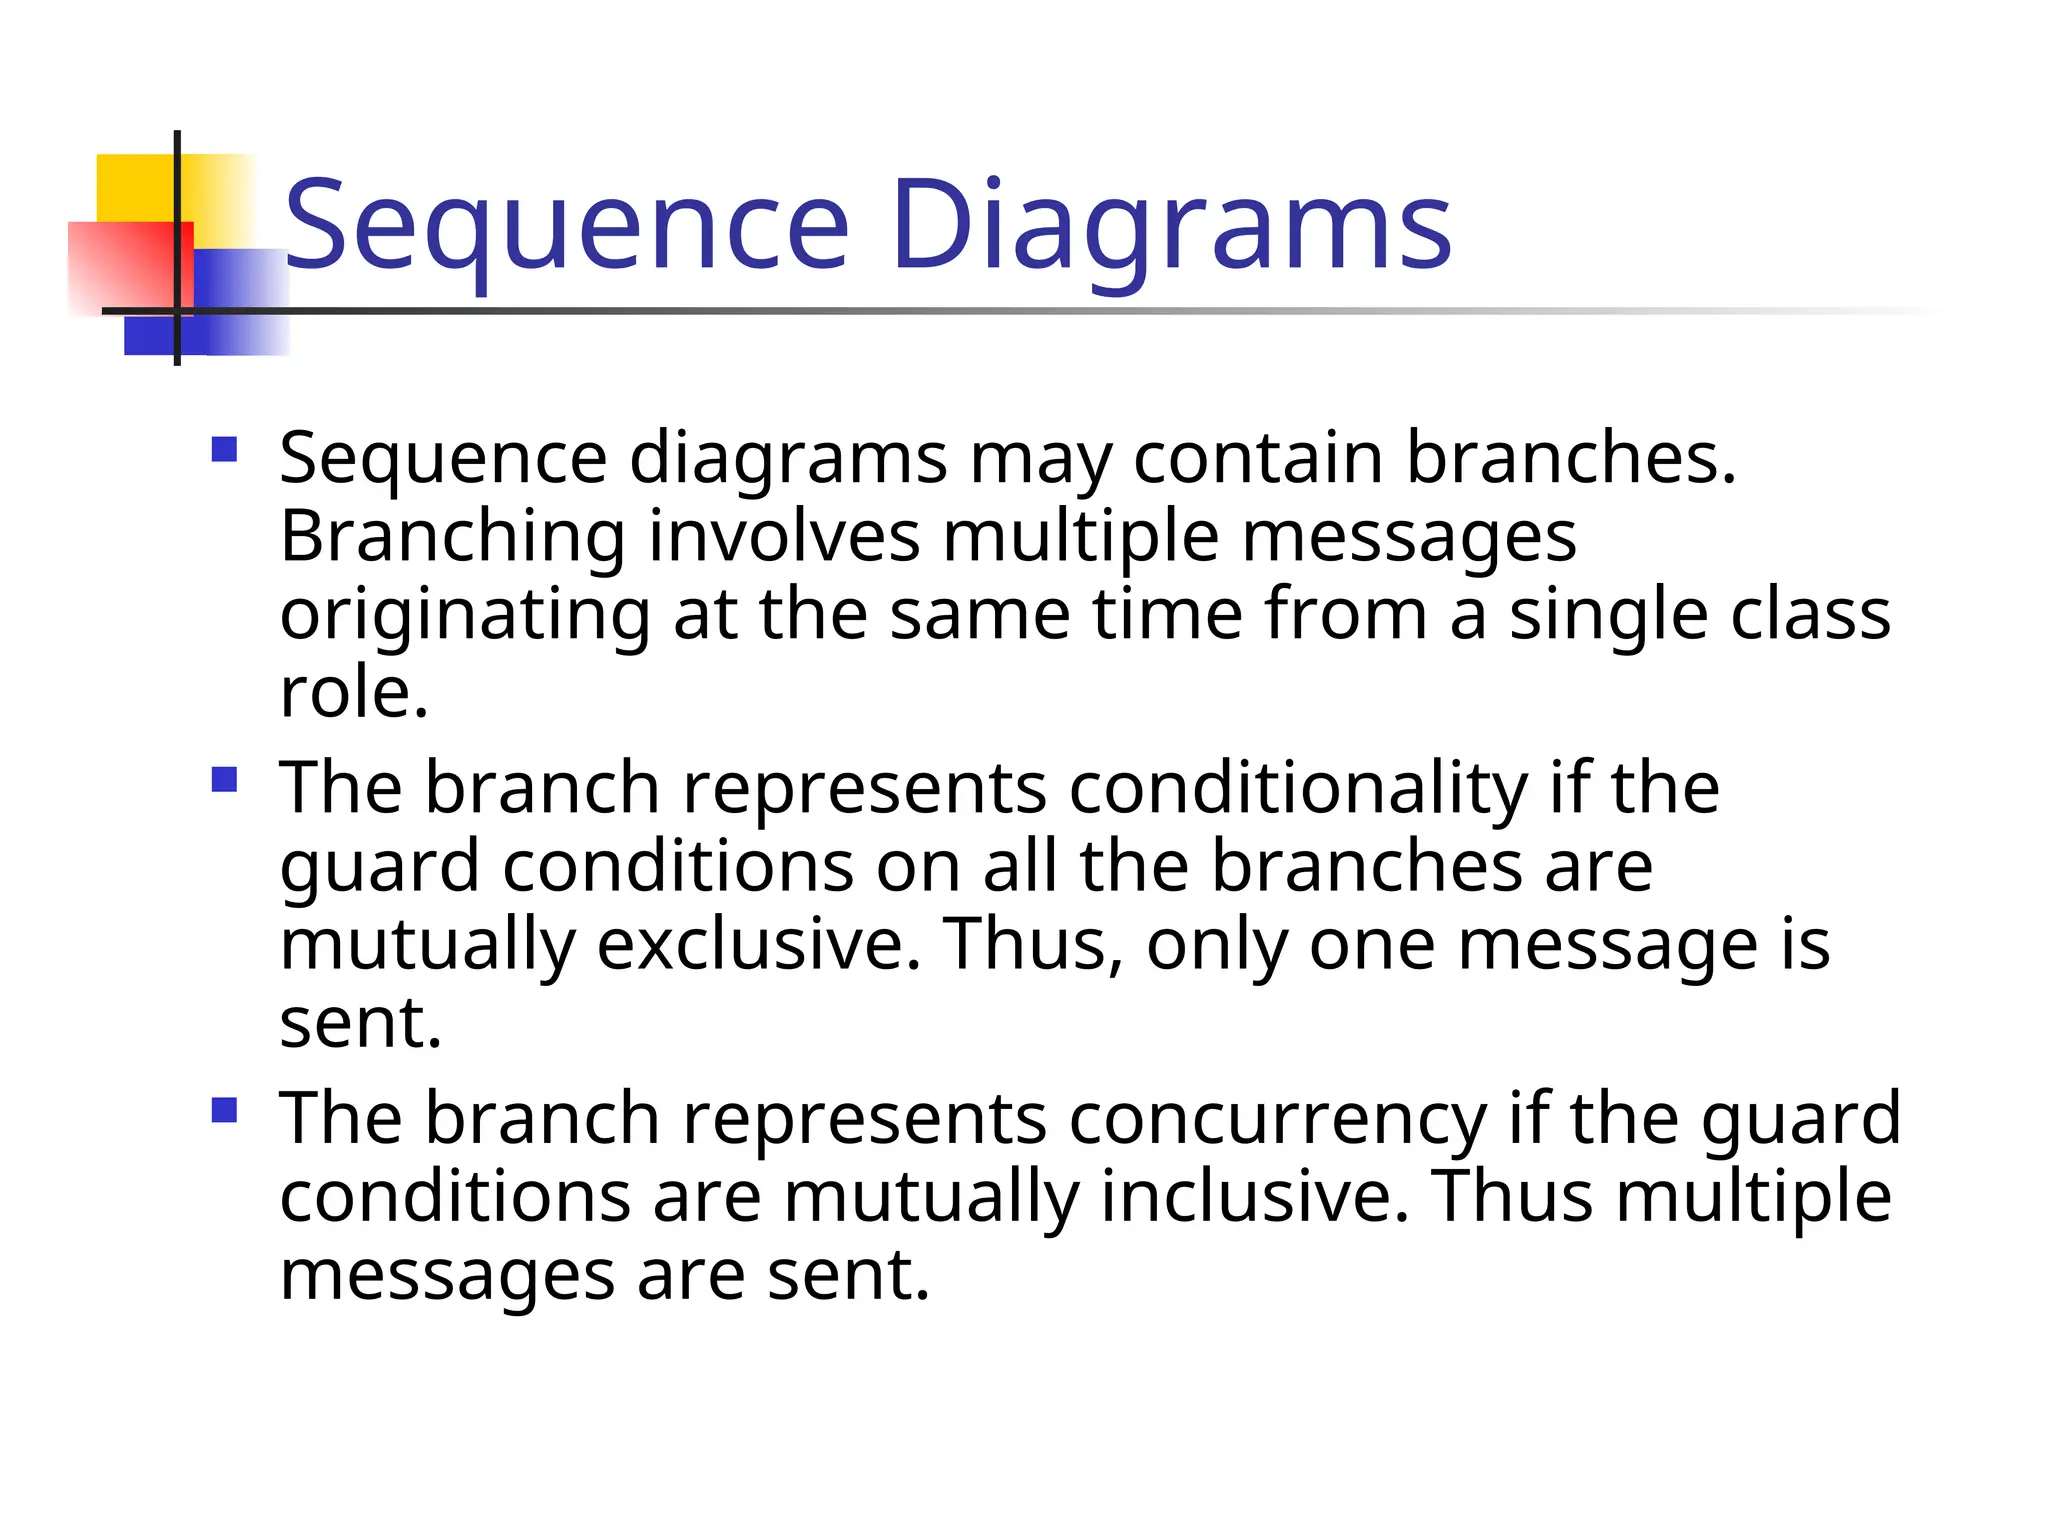
Sequencediagrams may contain branches.
Branching involves multiple messages
originating at the same time from a single class
role.
The branch represents conditionality if the
guard conditions on all the branches are
mutually exclusive. Thus, only one message is
sent.
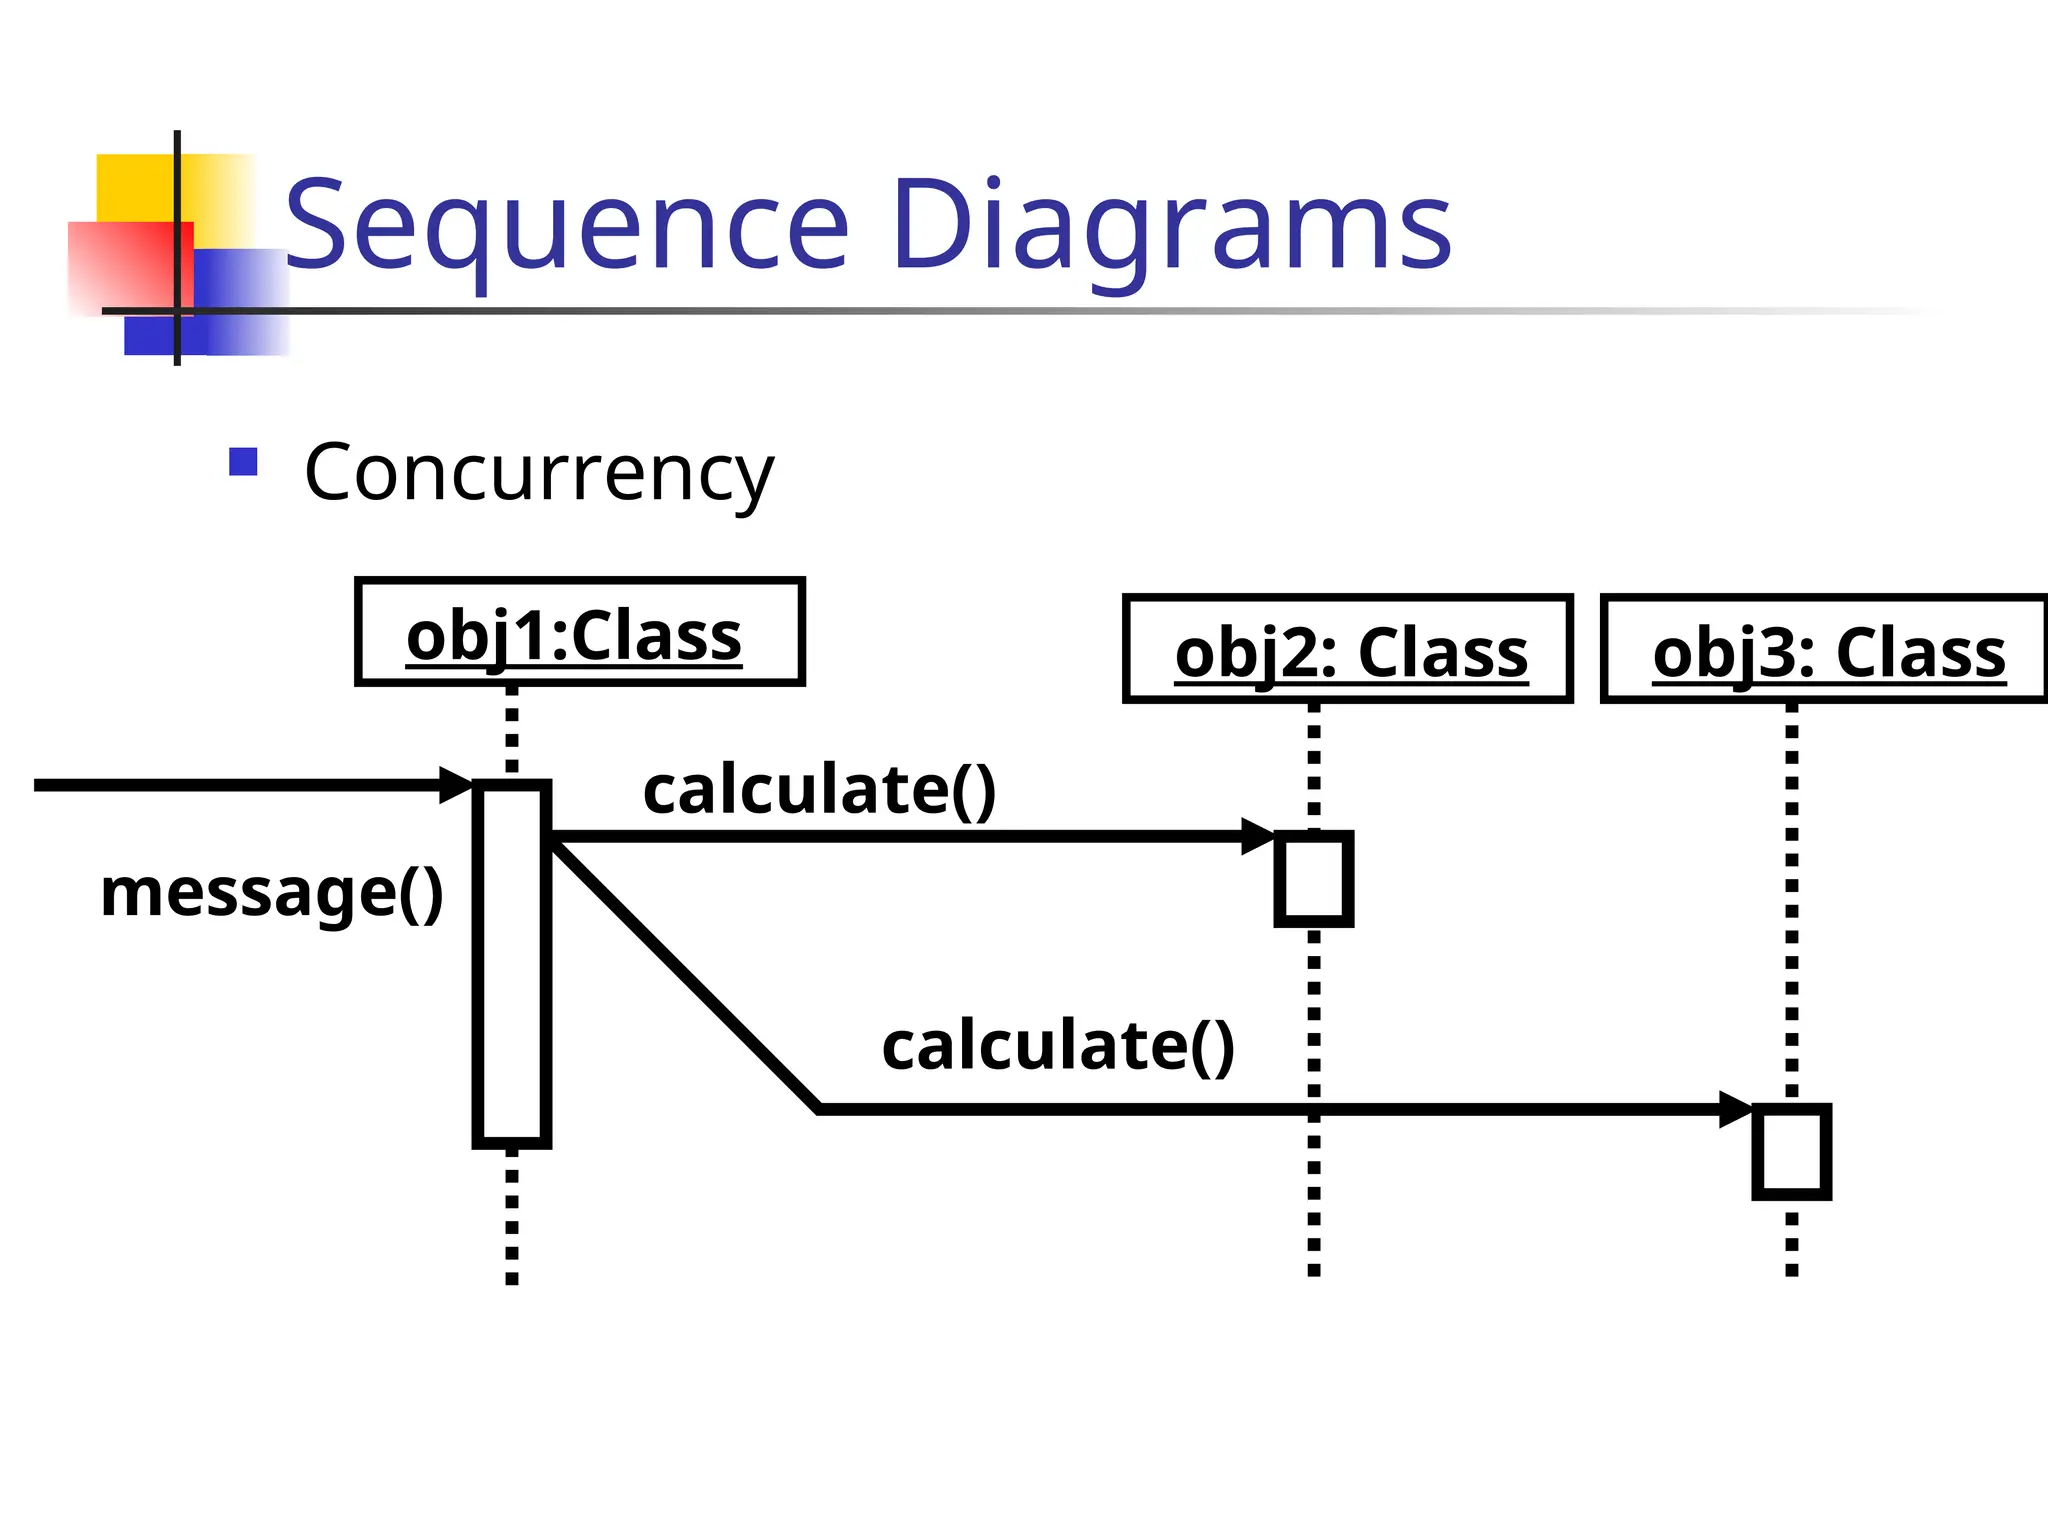
The branch represents concurrency if the guard
conditions are mutually inclusive. Thus multiple
messages are sent.
Sequence Diagrams
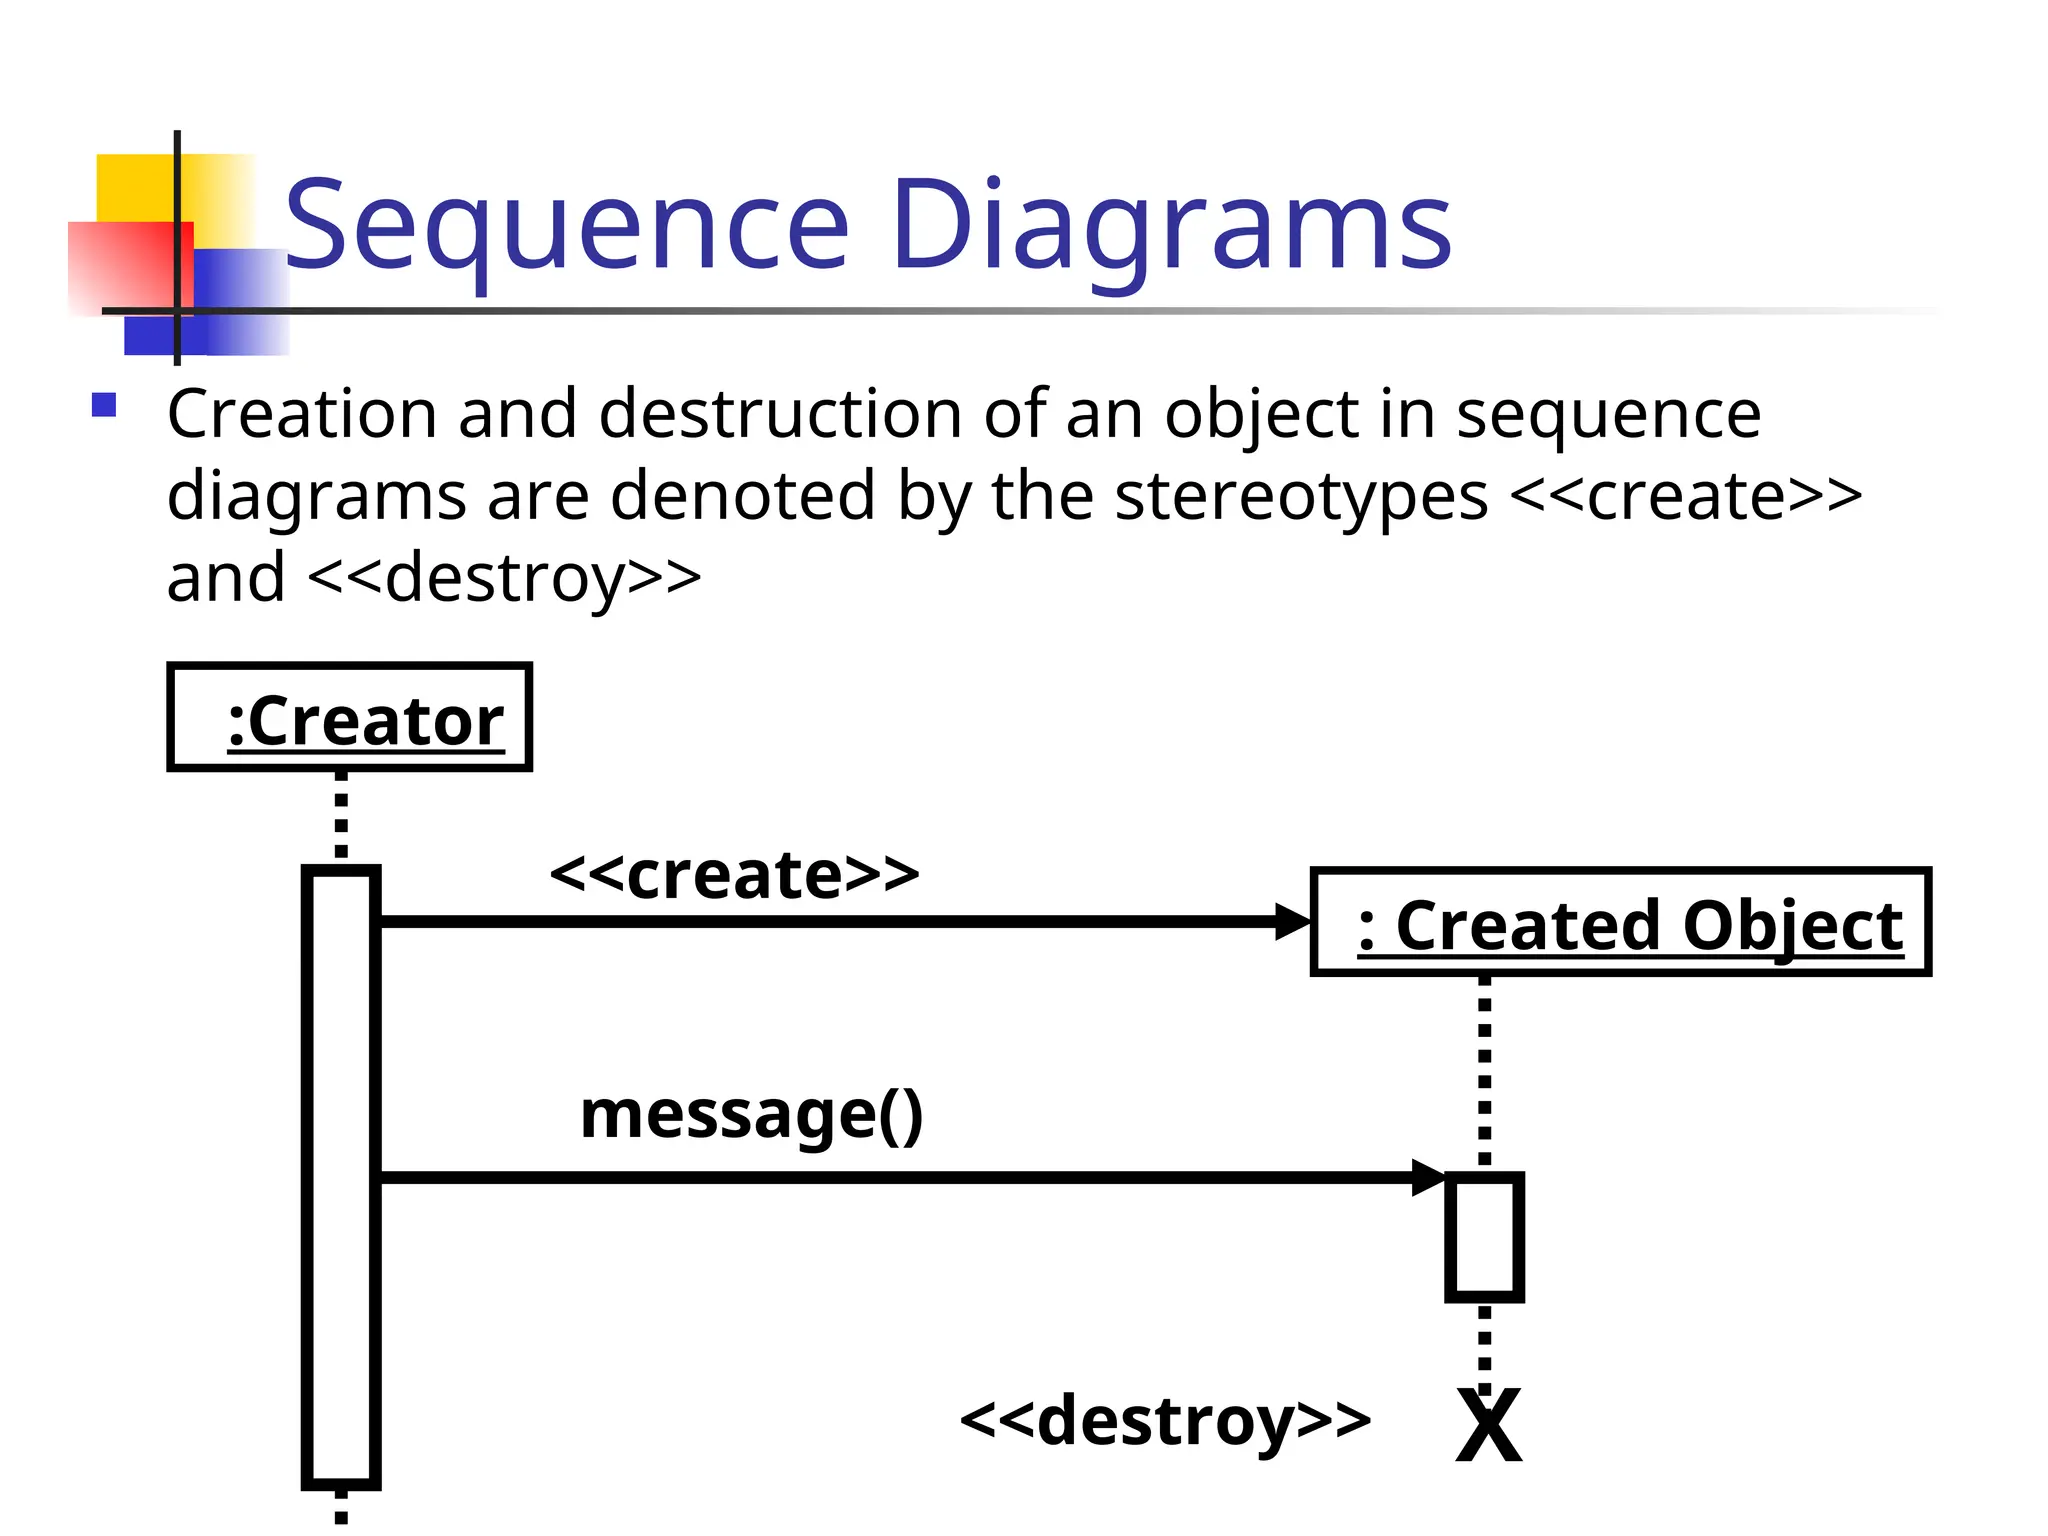
Creationand destruction of an object in sequence
diagrams are denoted by the stereotypes <<create>>
and <<destroy>>
:Creator
<<create>>
: Created Object
message()
<<destroy>> X
27.
Sequence Diagrams
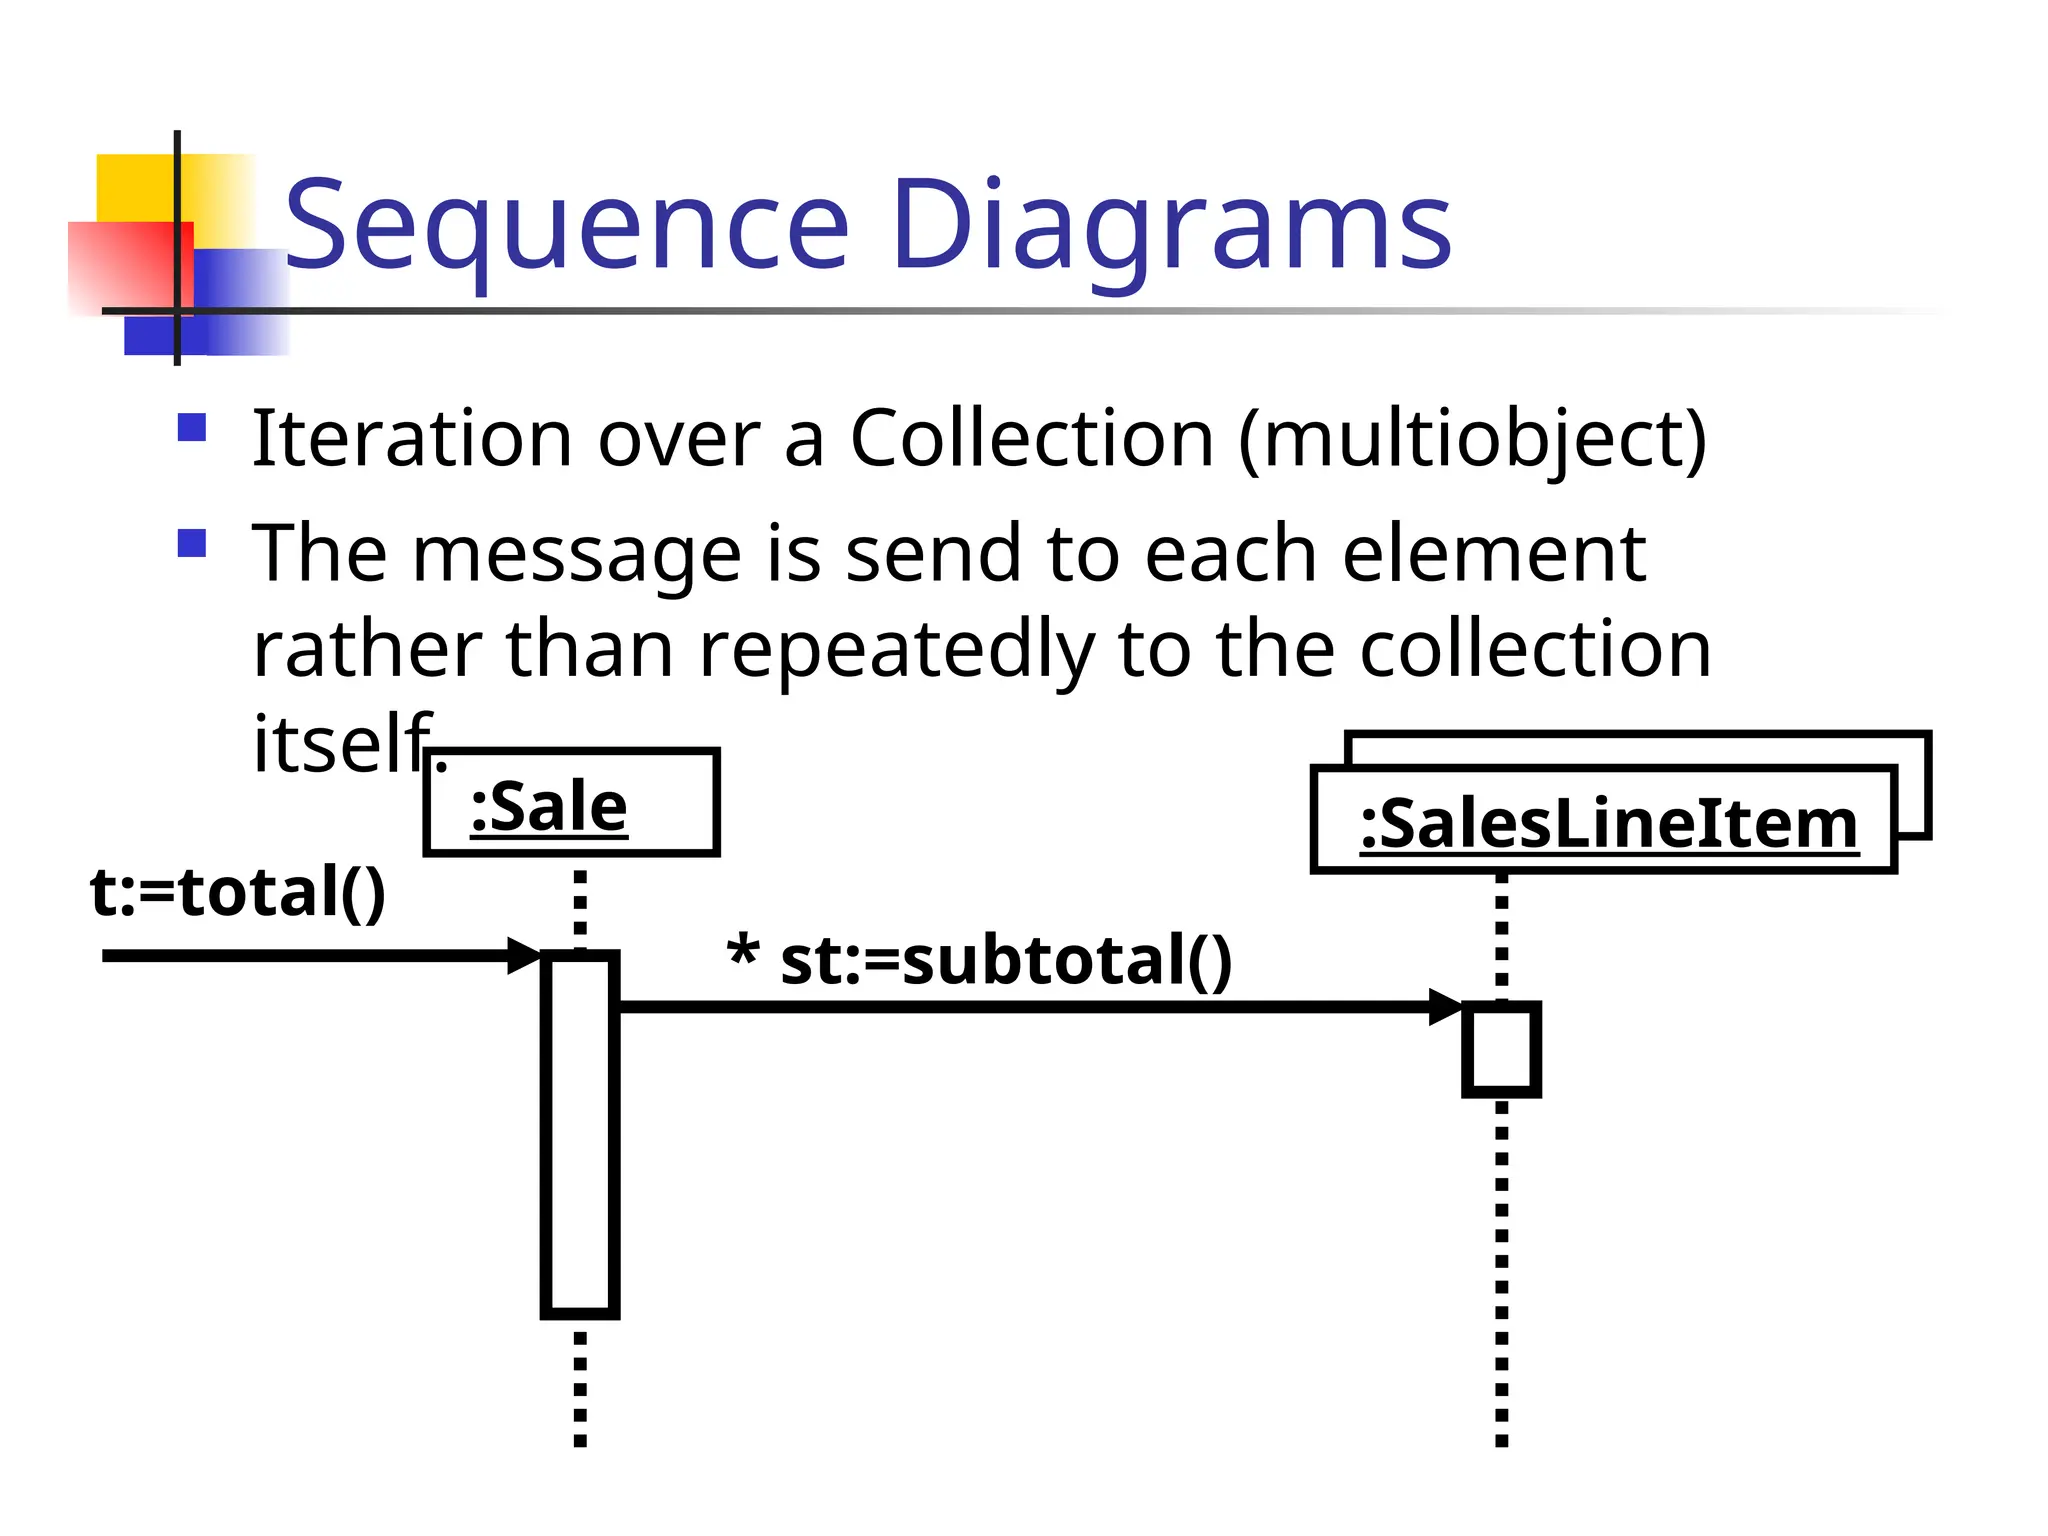
Iterationover a Collection (multiobject)
The message is send to each element
rather than repeatedly to the collection
itself.
:Sale
* st:=subtotal()
:SalesLineItem
t:=total()
28.
Collaboration Diagrams
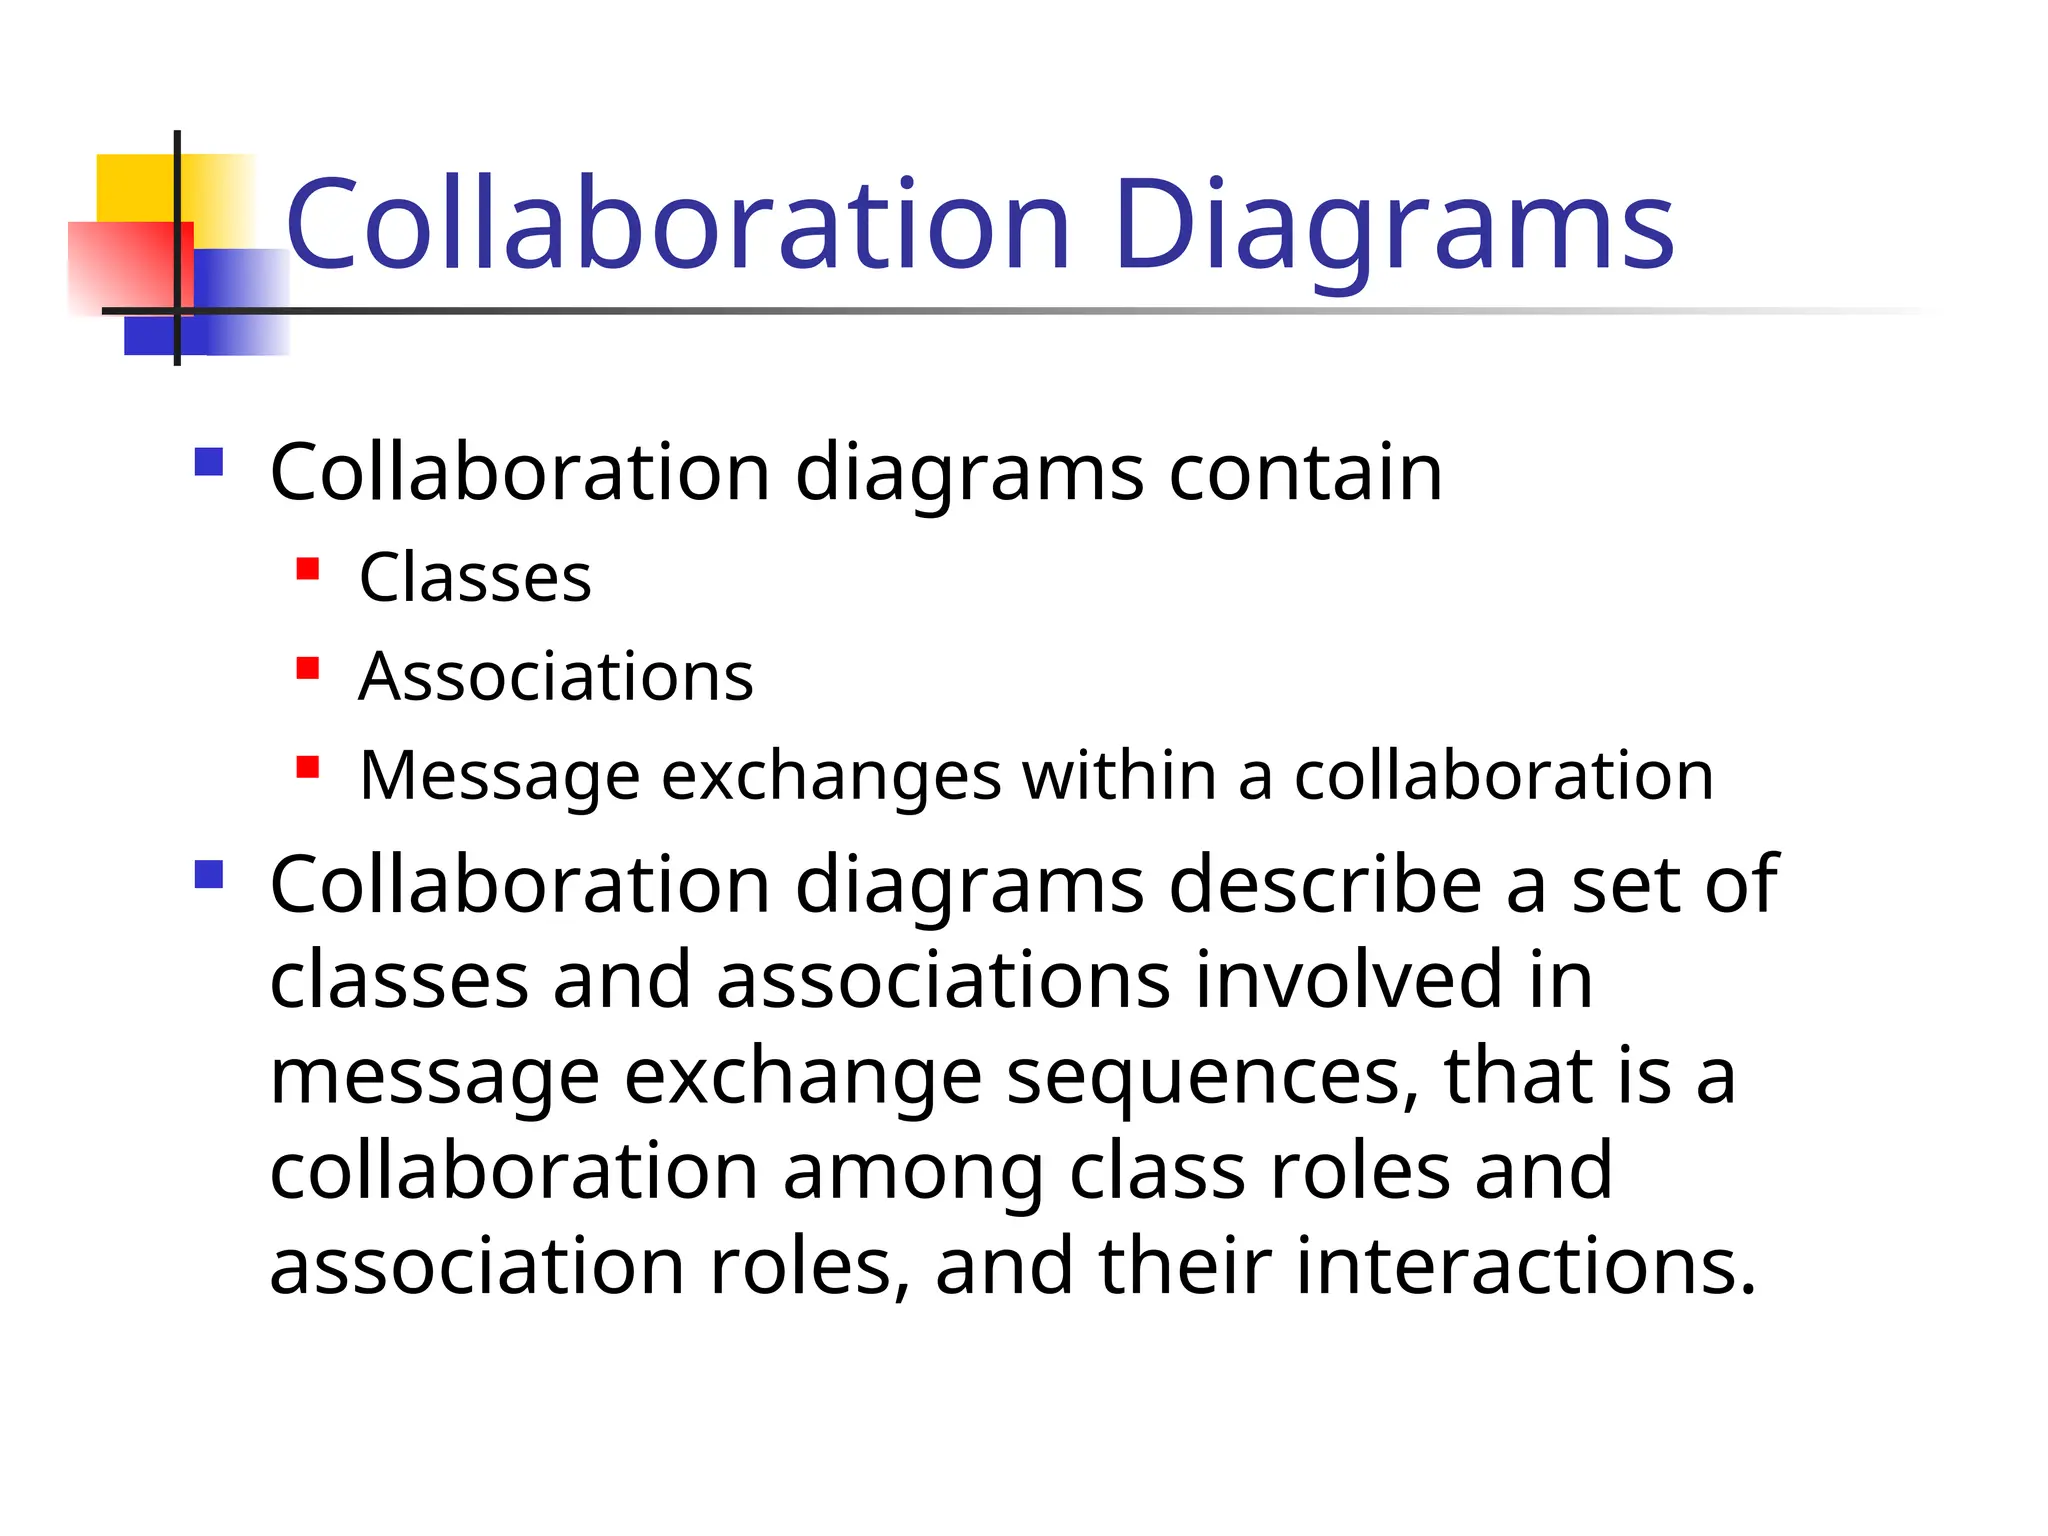
Collaborationdiagrams contain
Classes
Associations
Message exchanges within a collaboration
Collaboration diagrams describe a set of
classes and associations involved in
message exchange sequences, that is a
collaboration among class roles and
association roles, and their interactions.
29.
Collaboration Diagrams
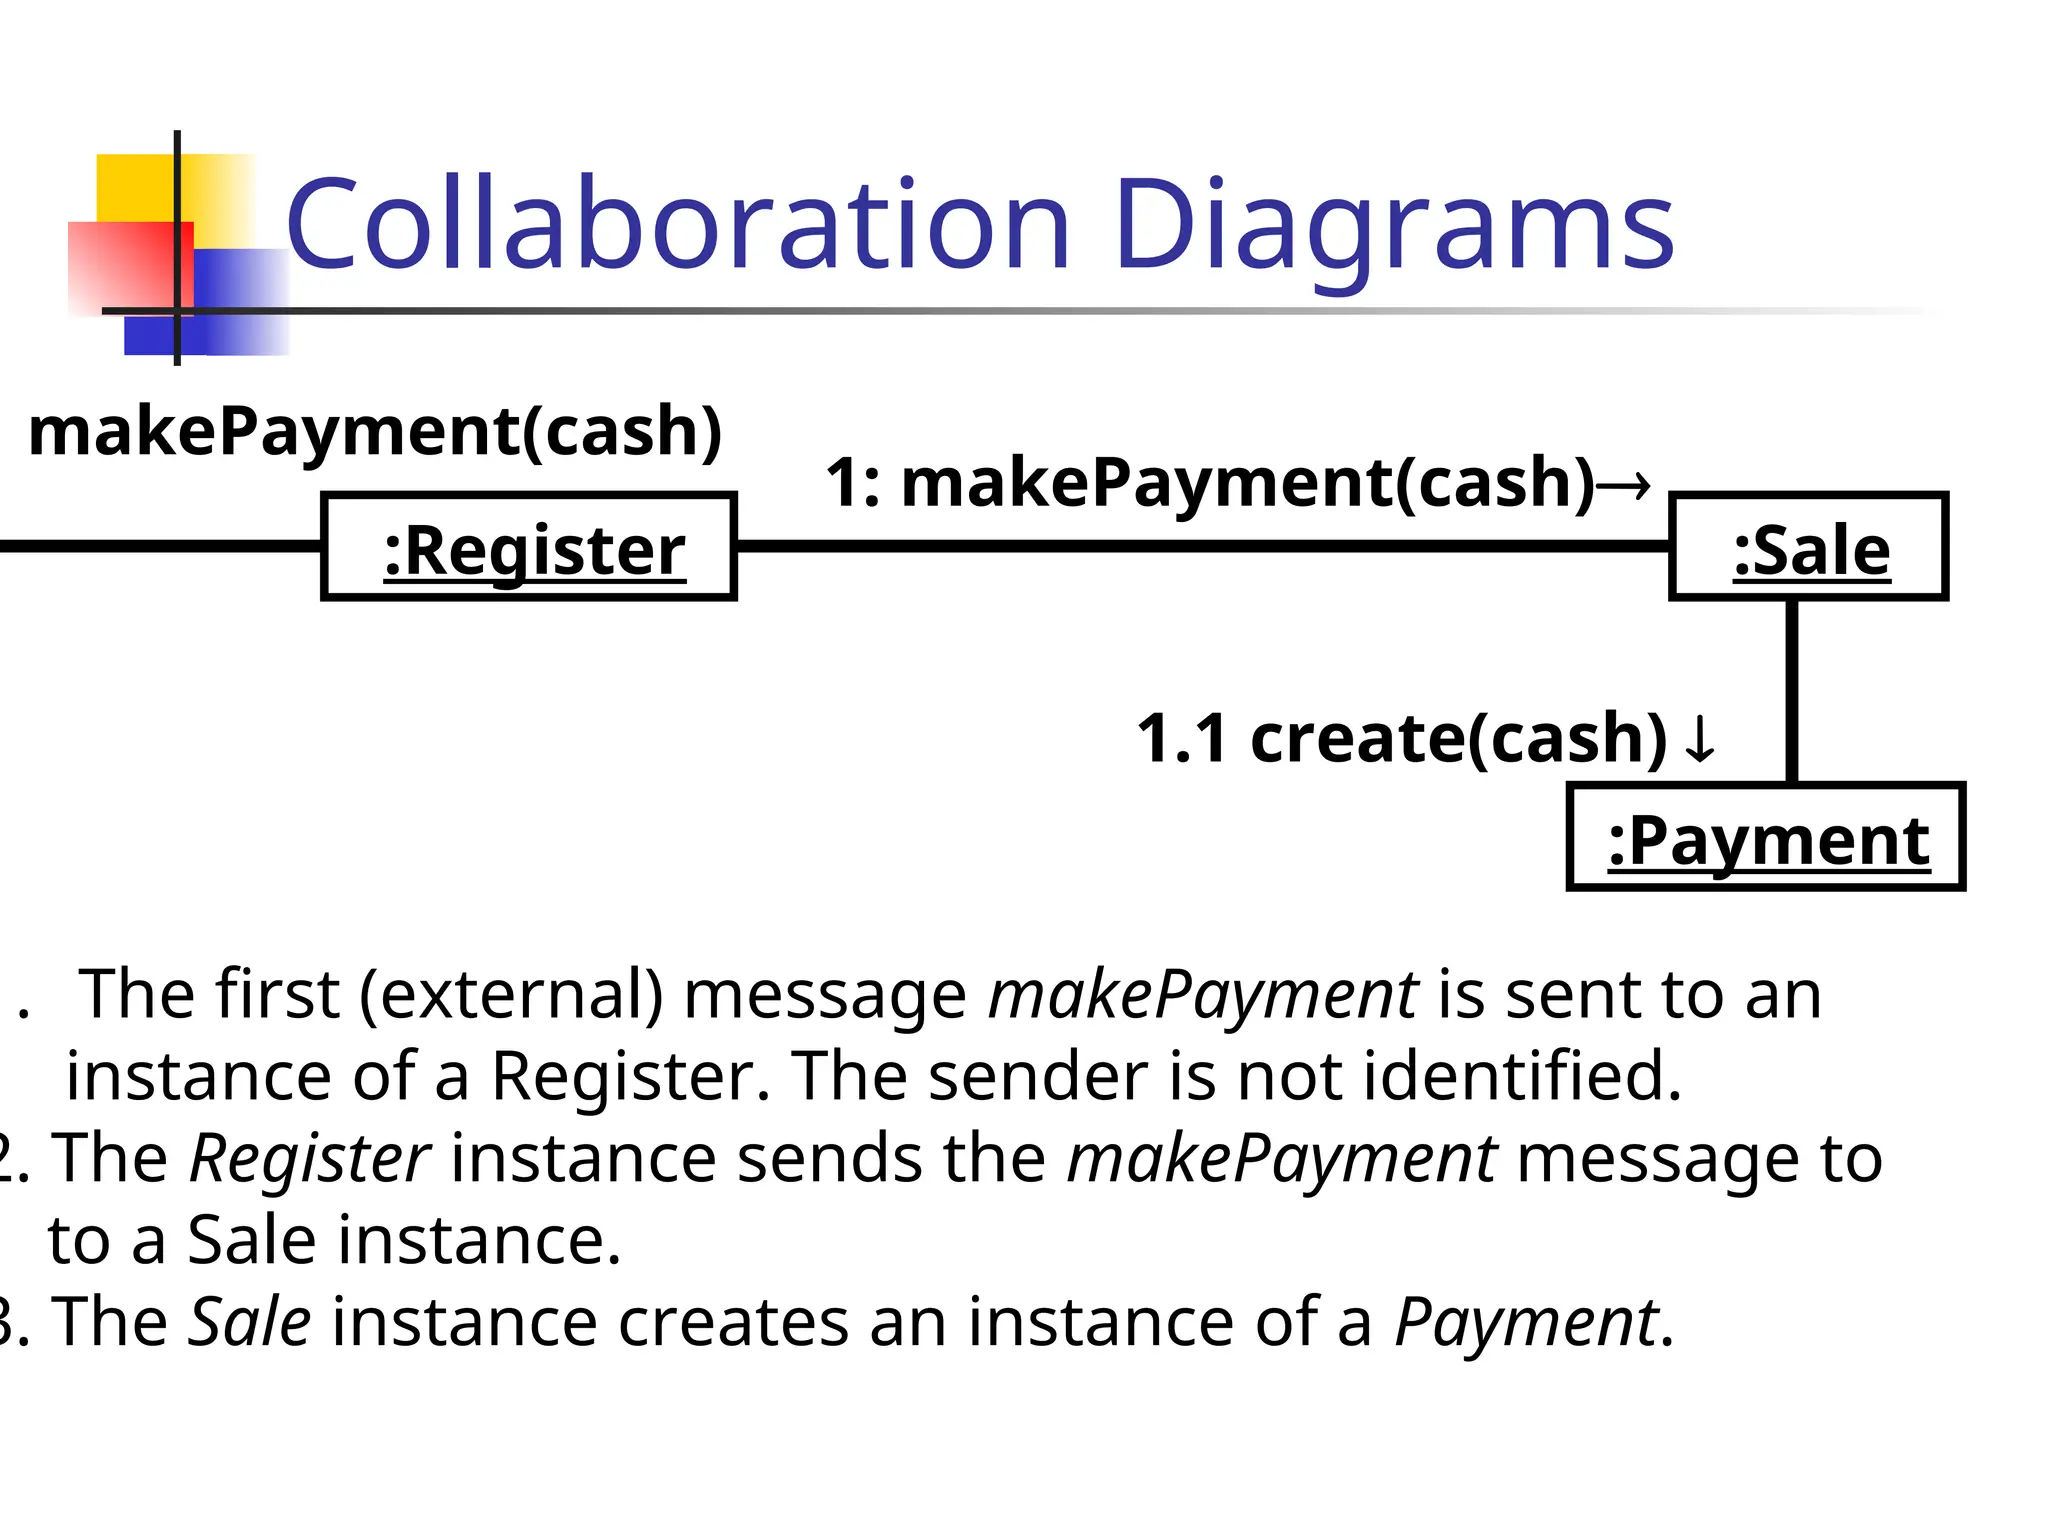
:Register
:Payment
1: makePayment(cash)
1.1create(cash)
:Sale
makePayment(cash)
1. The first (external) message makePayment is sent to an
instance of a Register. The sender is not identified.
2. The Register instance sends the makePayment message to
to a Sale instance.
3. The Sale instance creates an instance of a Payment.
30.
Collaboration Diagrams
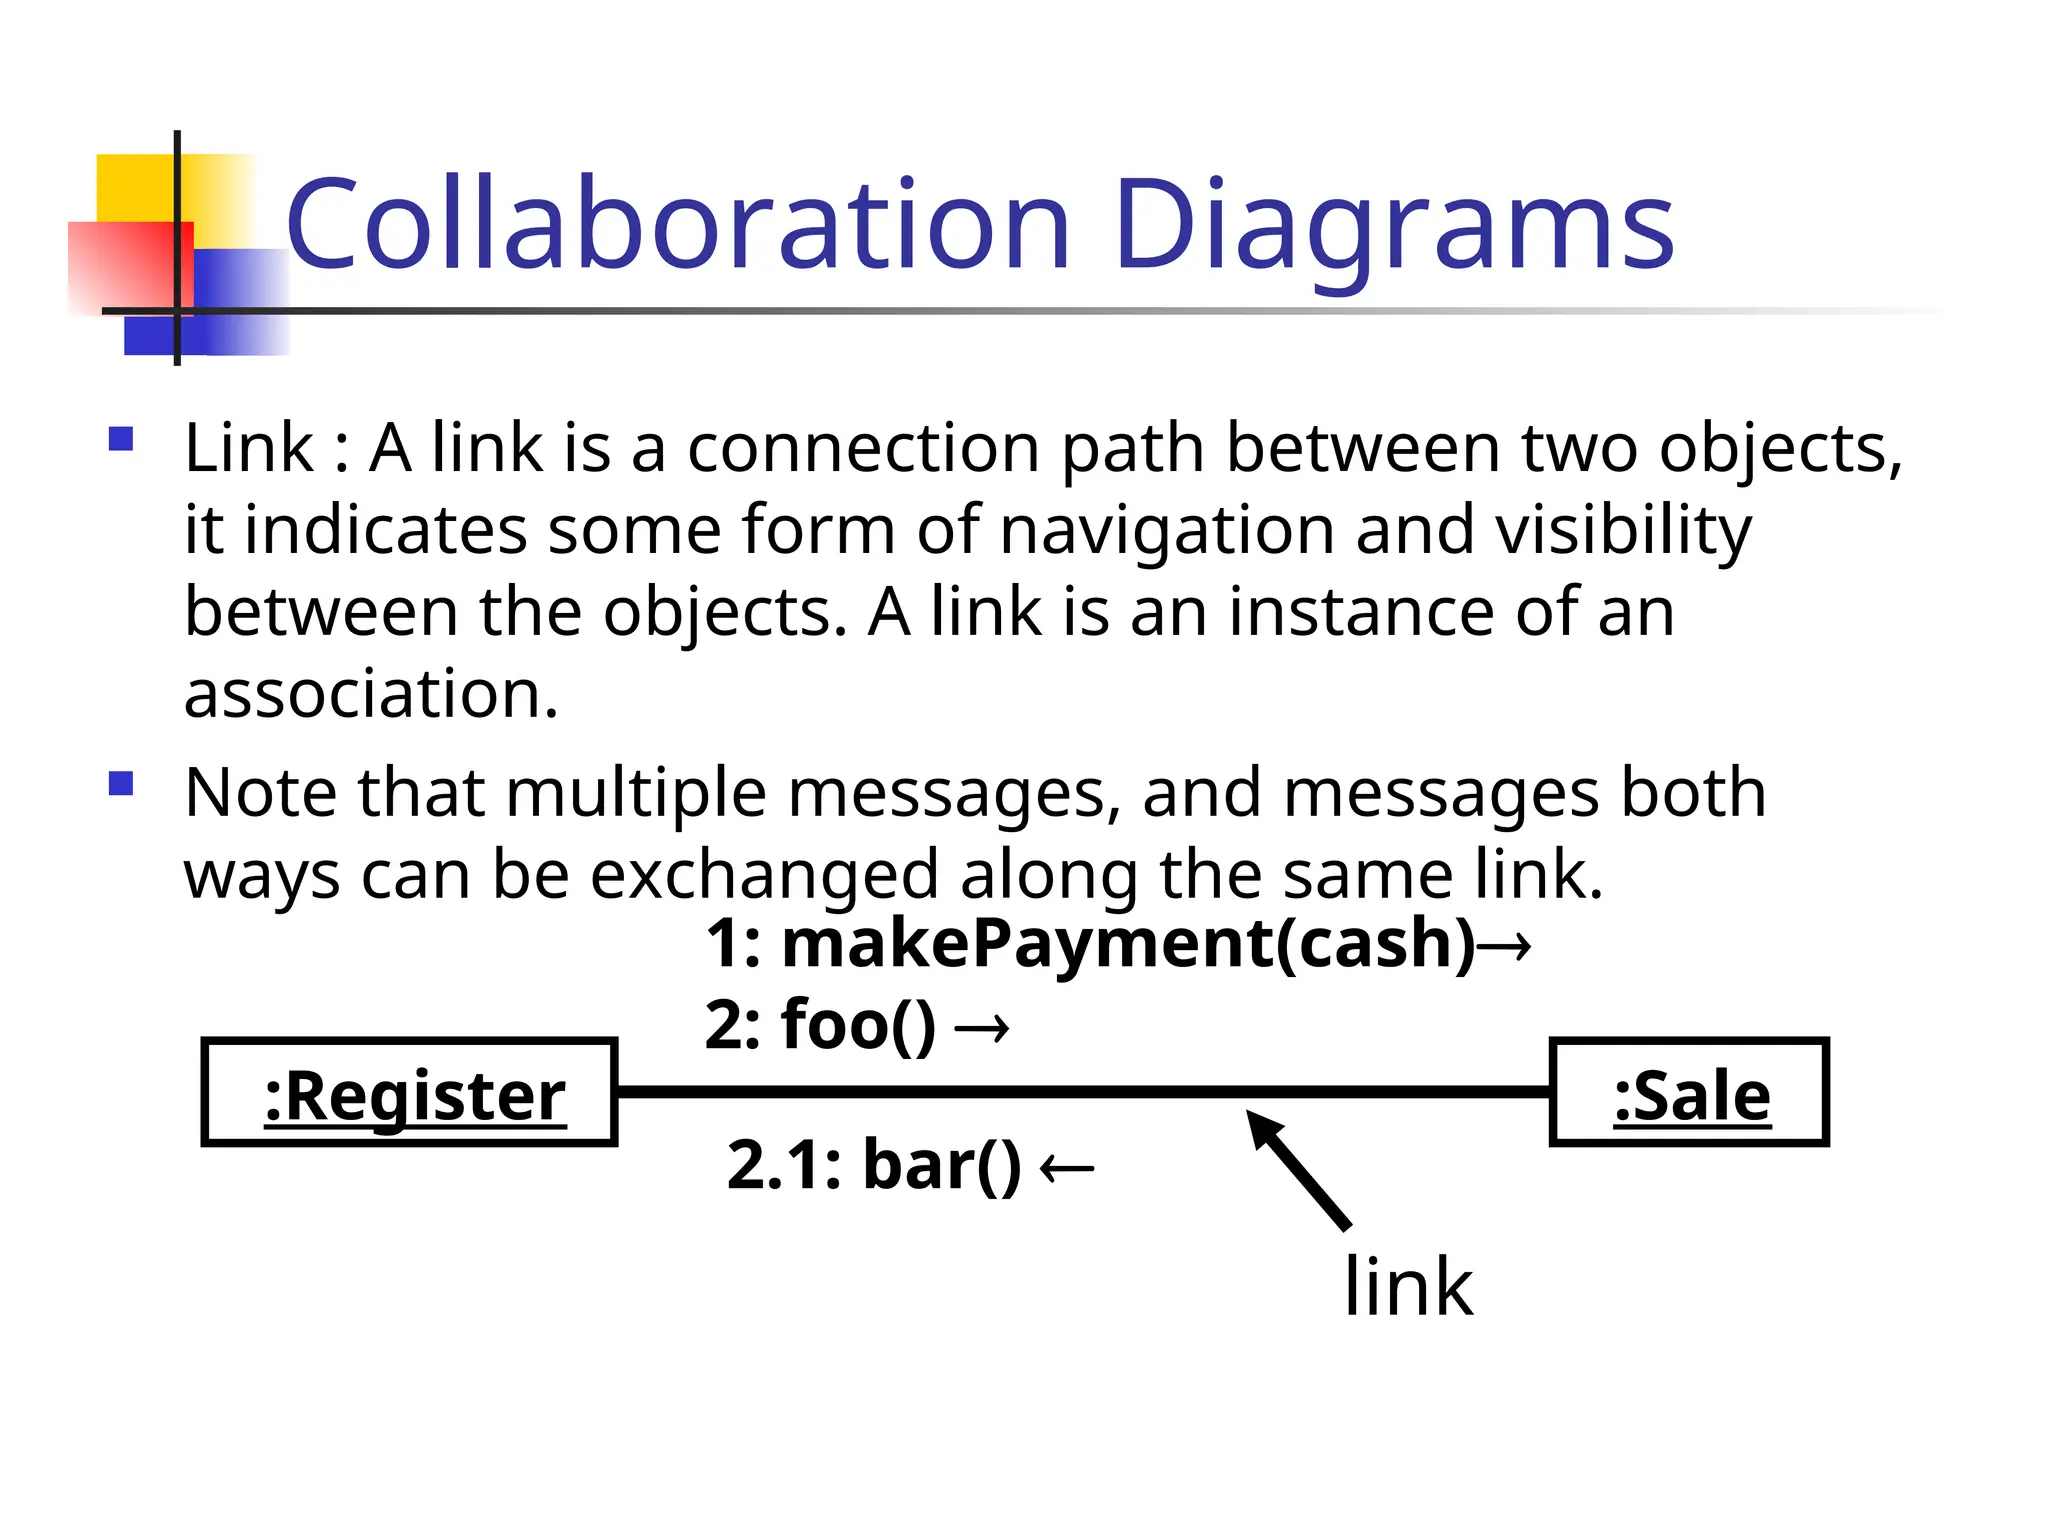
Link: A link is a connection path between two objects,
it indicates some form of navigation and visibility
between the objects. A link is an instance of an
association.
Note that multiple messages, and messages both
ways can be exchanged along the same link.
:Register
1: makePayment(cash)
2: foo()
:Sale
2.1: bar()
link
31.
Collaboration Diagrams
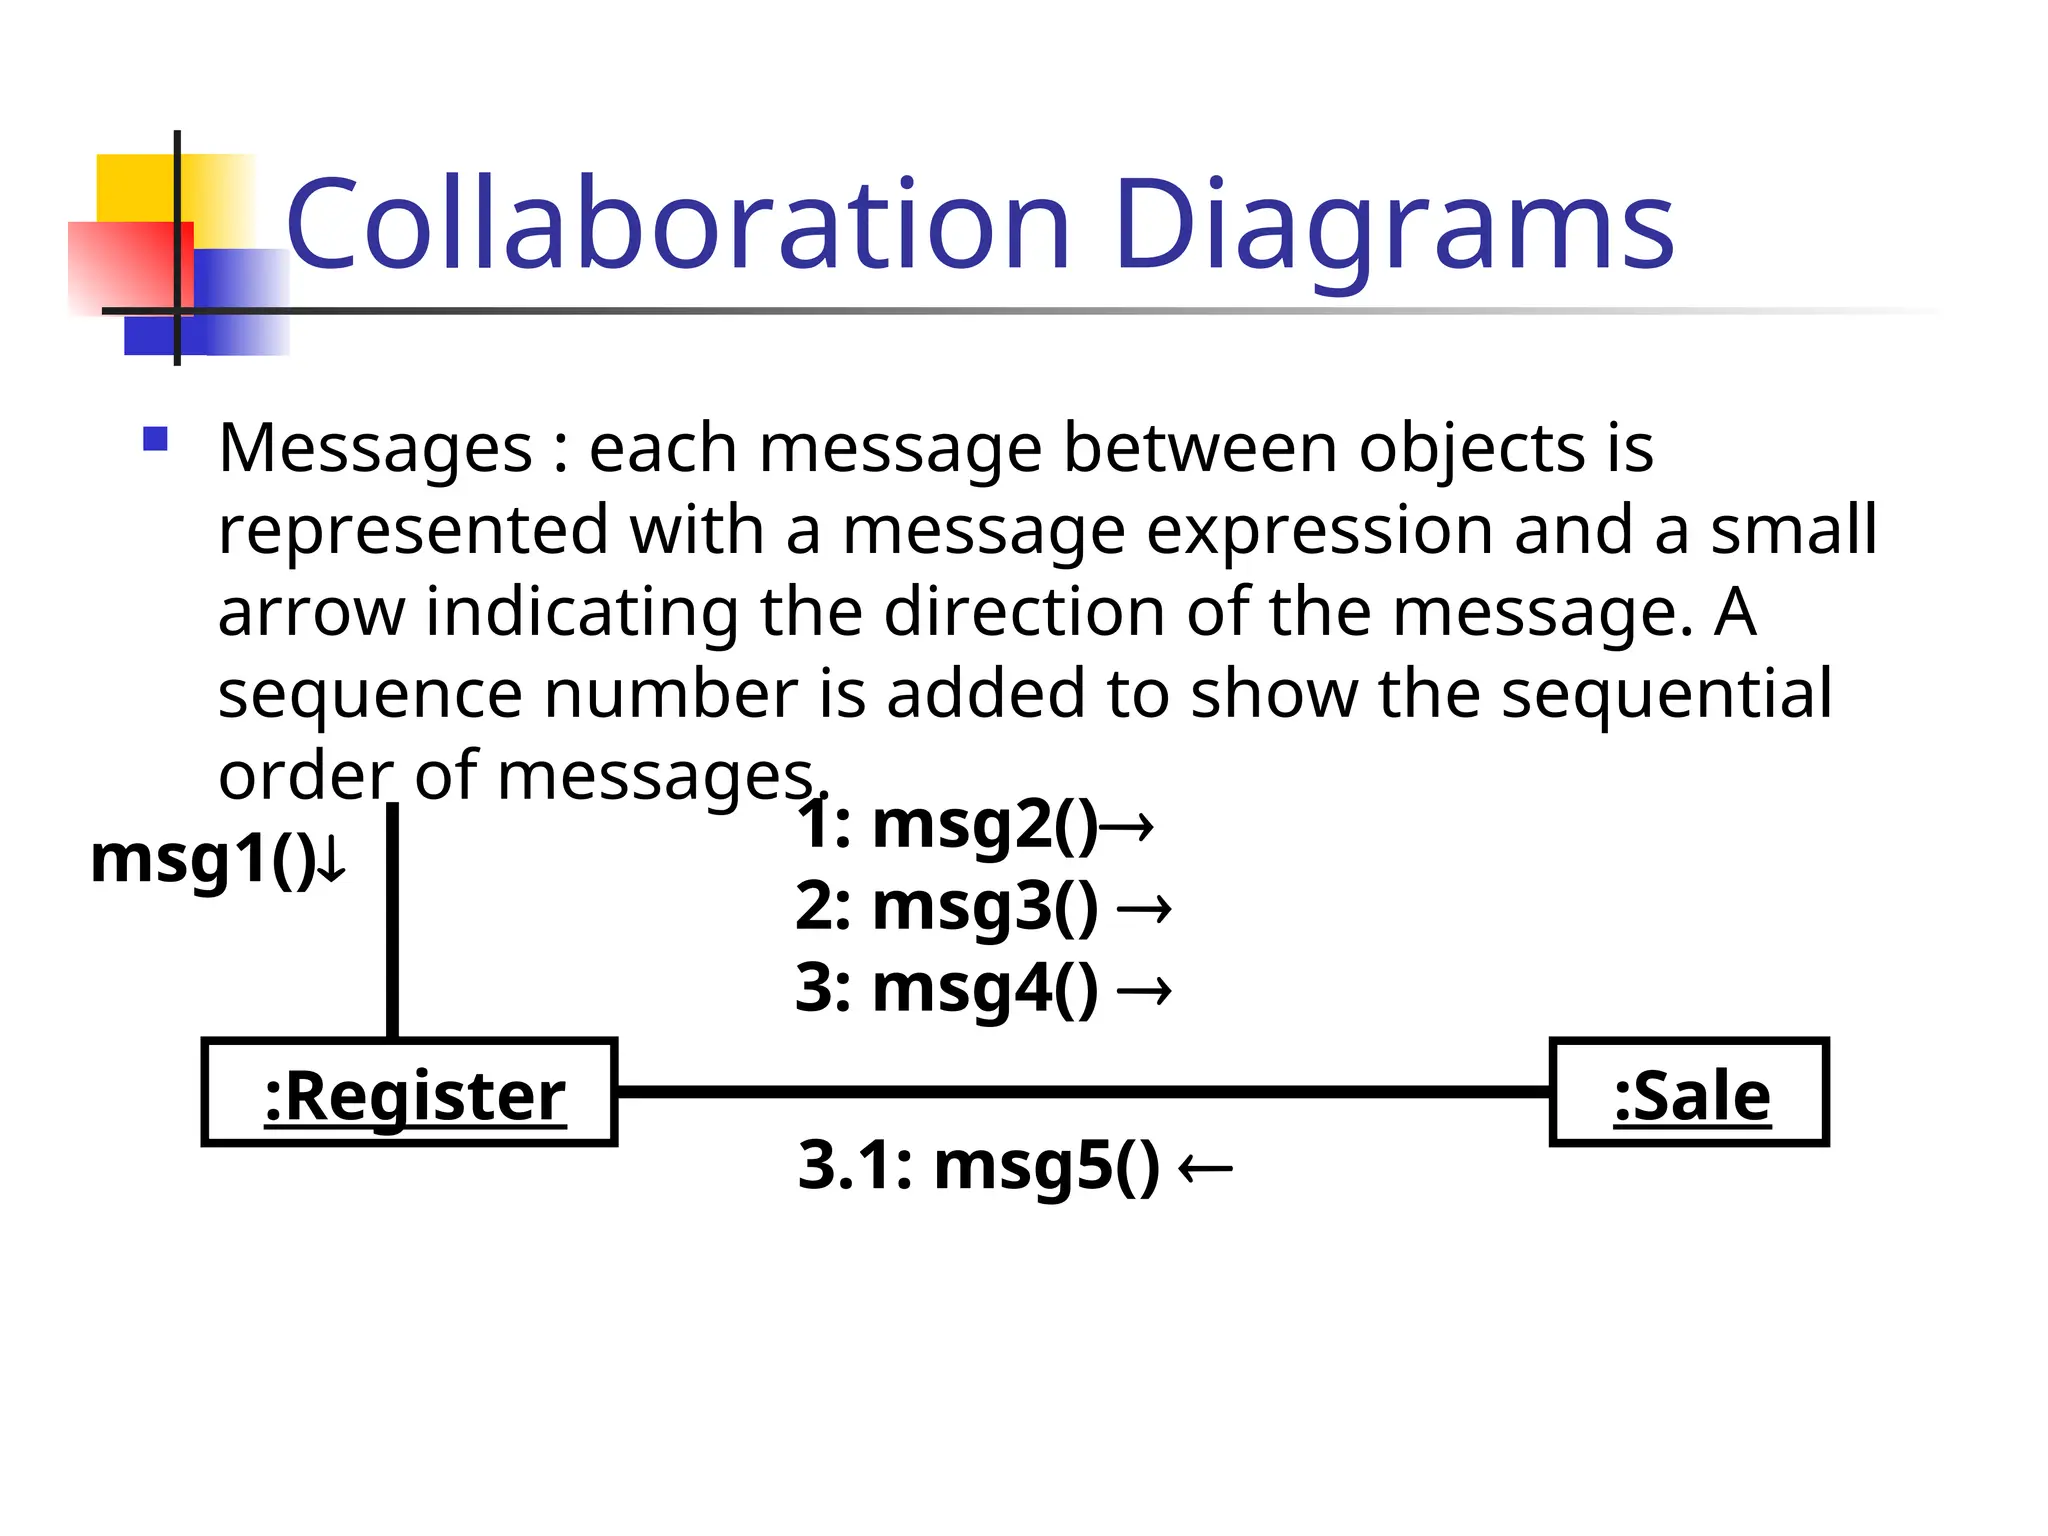
Messages: each message between objects is
represented with a message expression and a small
arrow indicating the direction of the message. A
sequence number is added to show the sequential
order of messages.
:Register
1: msg2()
2: msg3()
3: msg4()
:Sale
3.1: msg5()
msg1()
32.
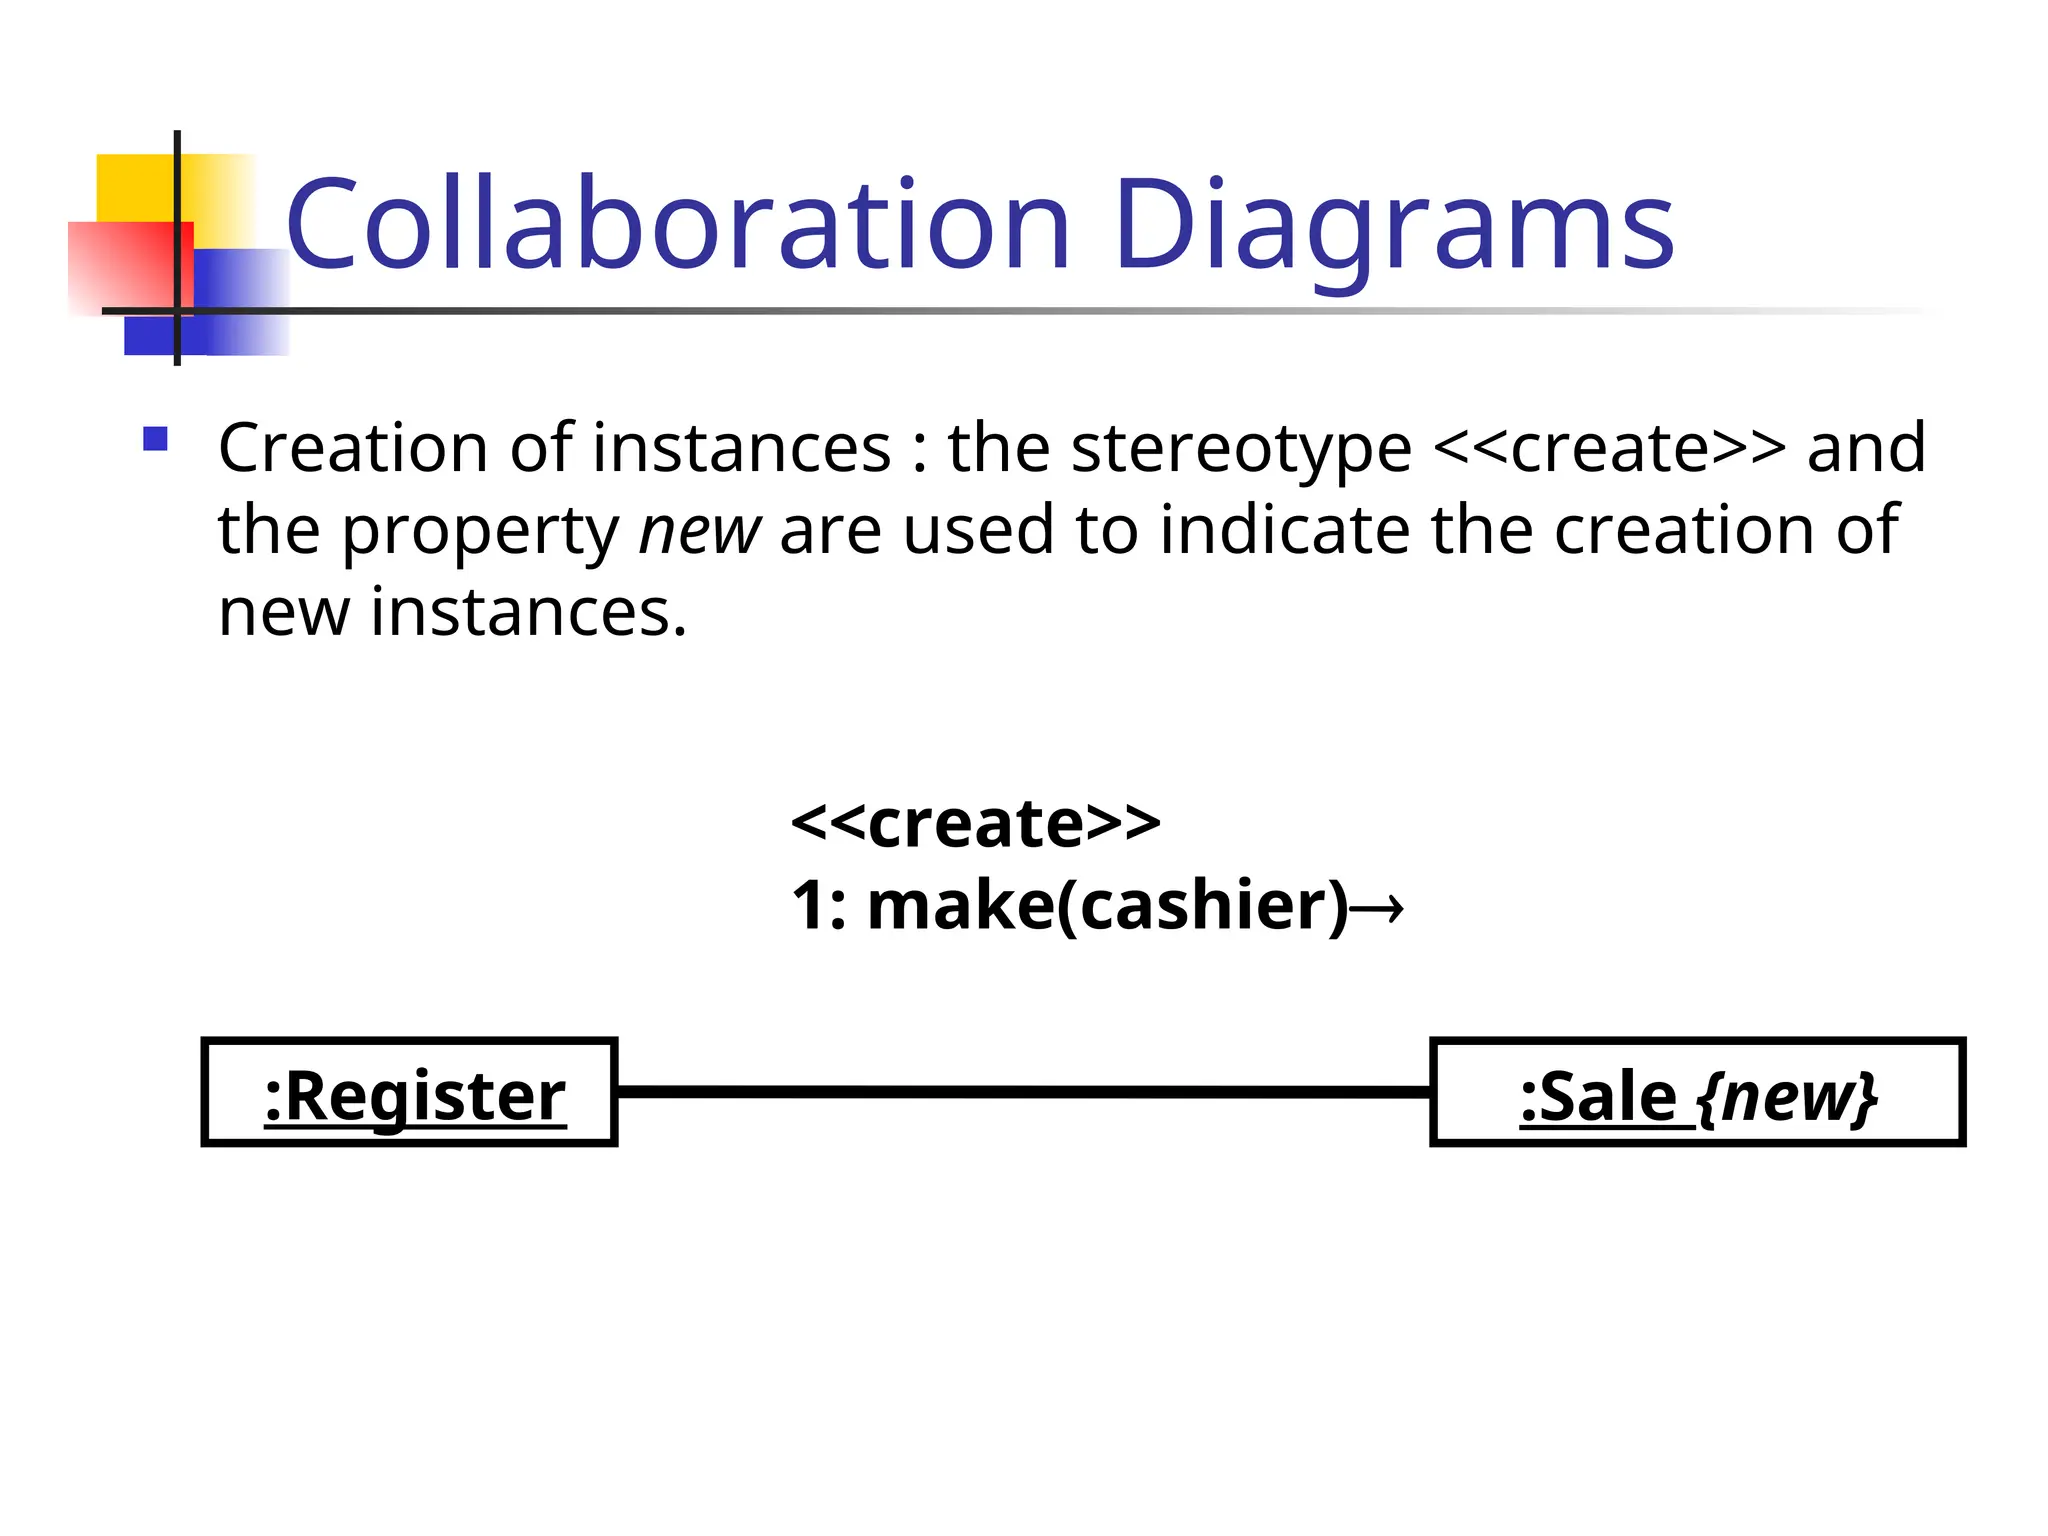
Collaboration Diagrams
Creationof instances : the stereotype <<create>> and
the property new are used to indicate the creation of
new instances.
:Register
<<create>>
1: make(cashier)
:Sale {new}
33.
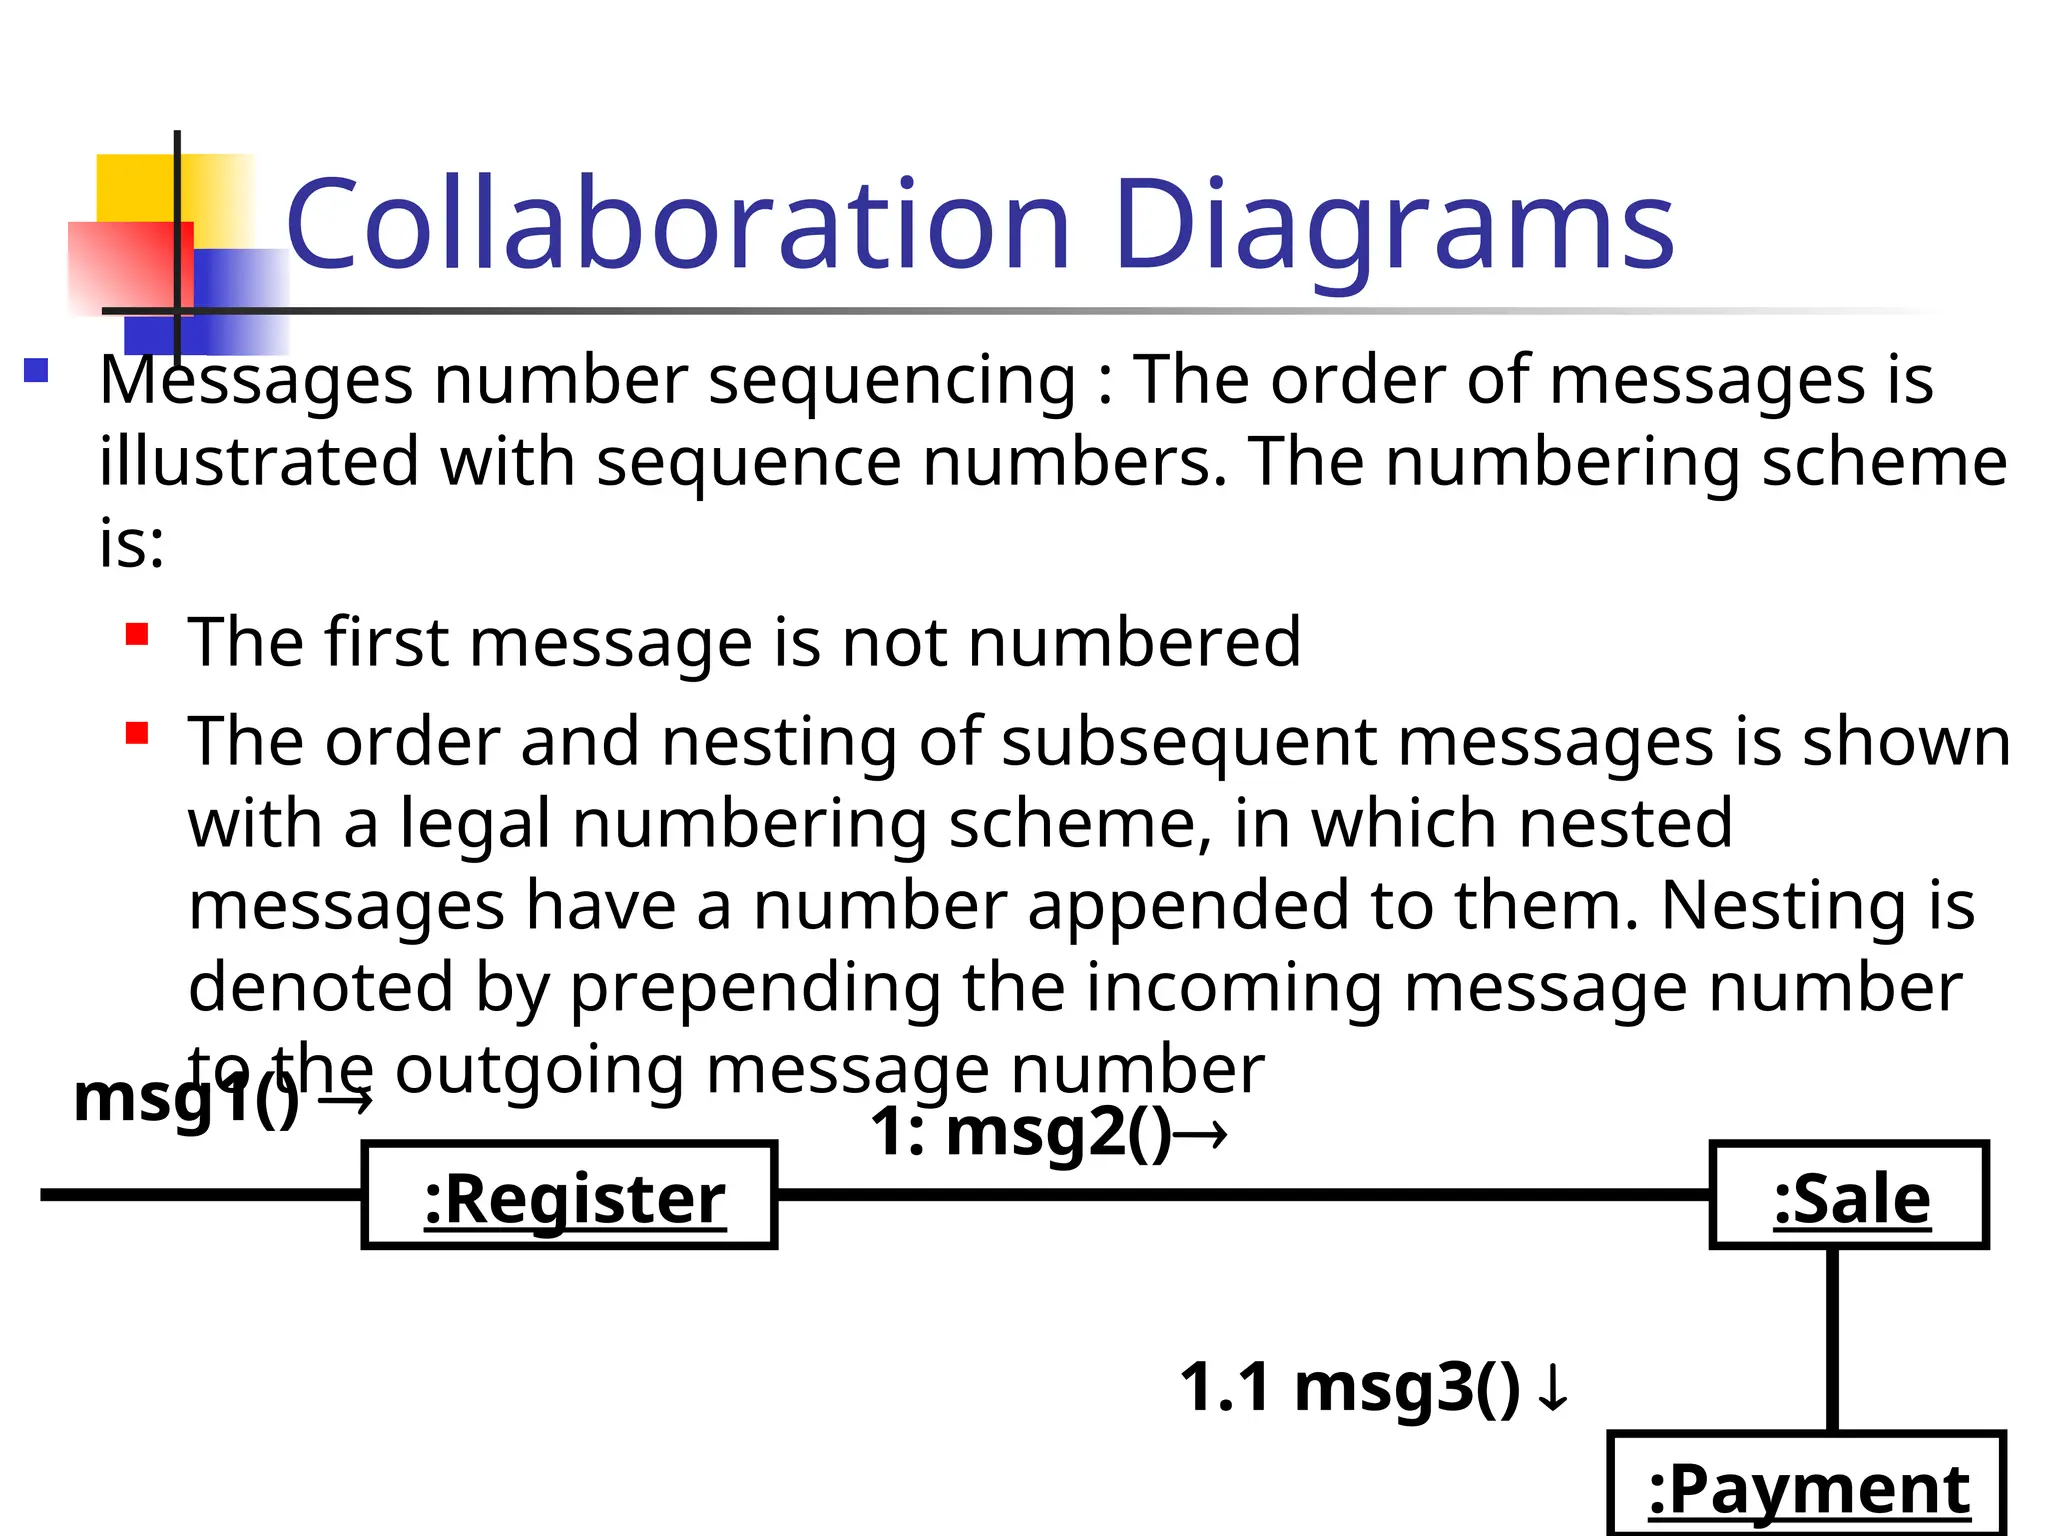
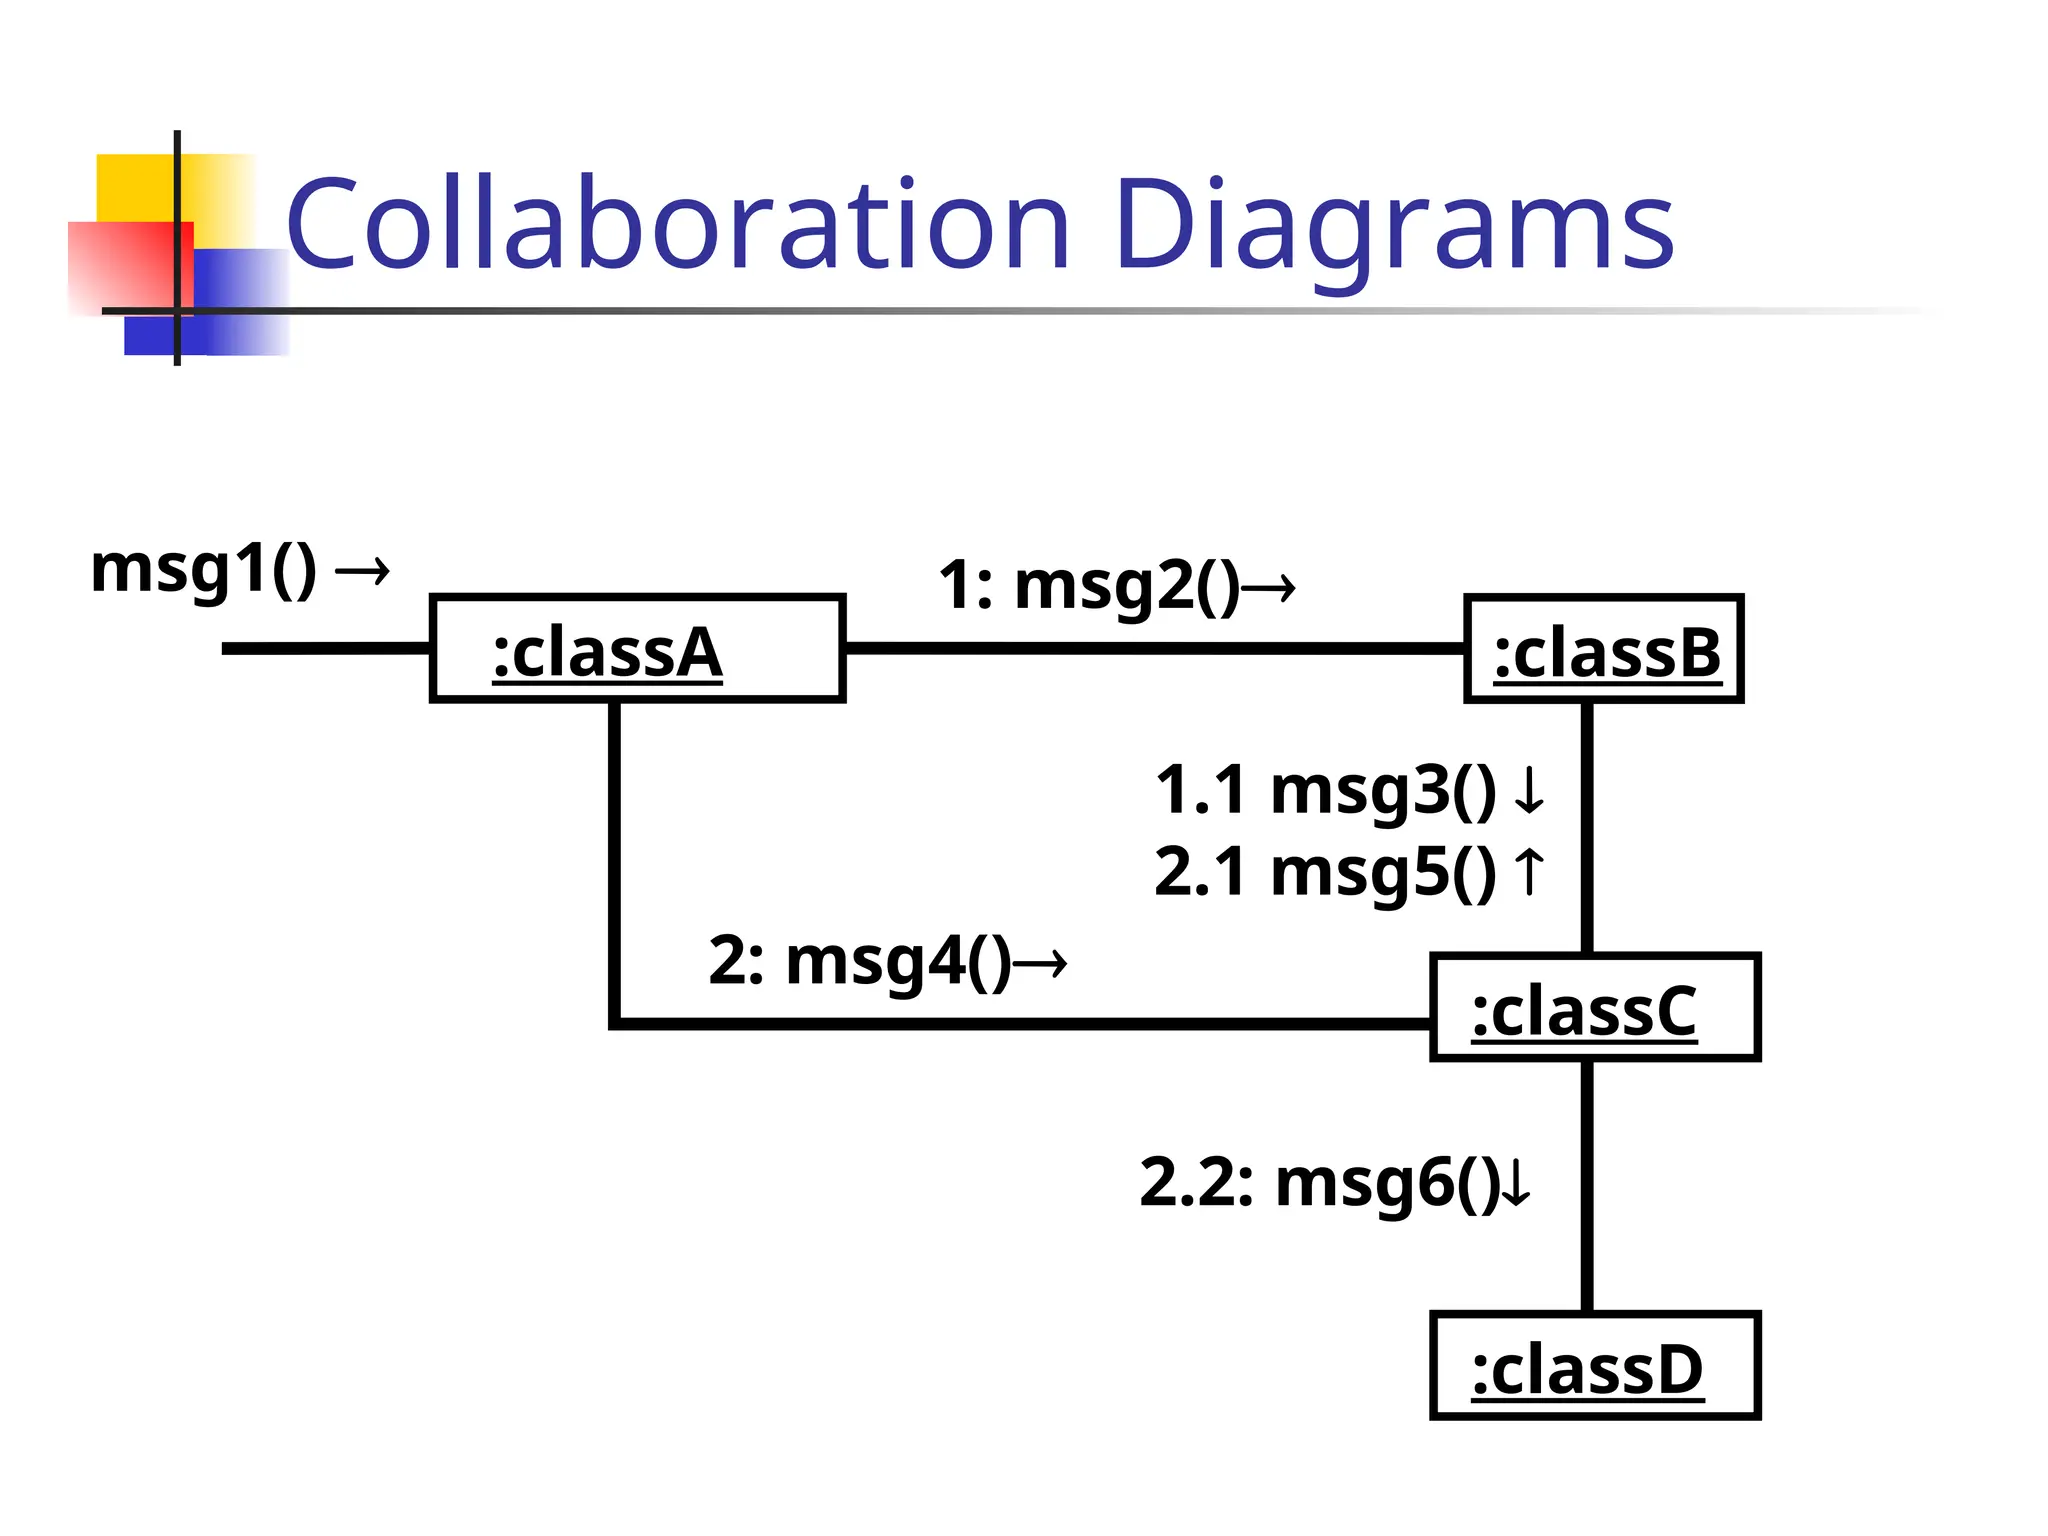
Collaboration Diagrams
Messagesnumber sequencing : The order of messages is
illustrated with sequence numbers. The numbering scheme
is:
The first message is not numbered
The order and nesting of subsequent messages is shown
with a legal numbering scheme, in which nested
messages have a number appended to them. Nesting is
denoted by prepending the incoming message number
to the outgoing message number
:Register
:Payment
1: msg2()
1.1 msg3()
:Sale
msg1()
Collaboration Diagrams
ConditionalMessages : A conditional message is
shown by following a sequence number with a
conditional clause in square brackets.
:Foo
1 [color=red]: msg2()
:Bar
msg1()
State Chart Diagrams
The state of an object is defined by the set of
values currently held by its attributes.
At any moment in time, an object exists in a
certain manner or conditon, which we say is a
state.
Source
State
Entry and
Exit actions
Target
State
Event [Guard] / Action
38.
State Chart Diagrams
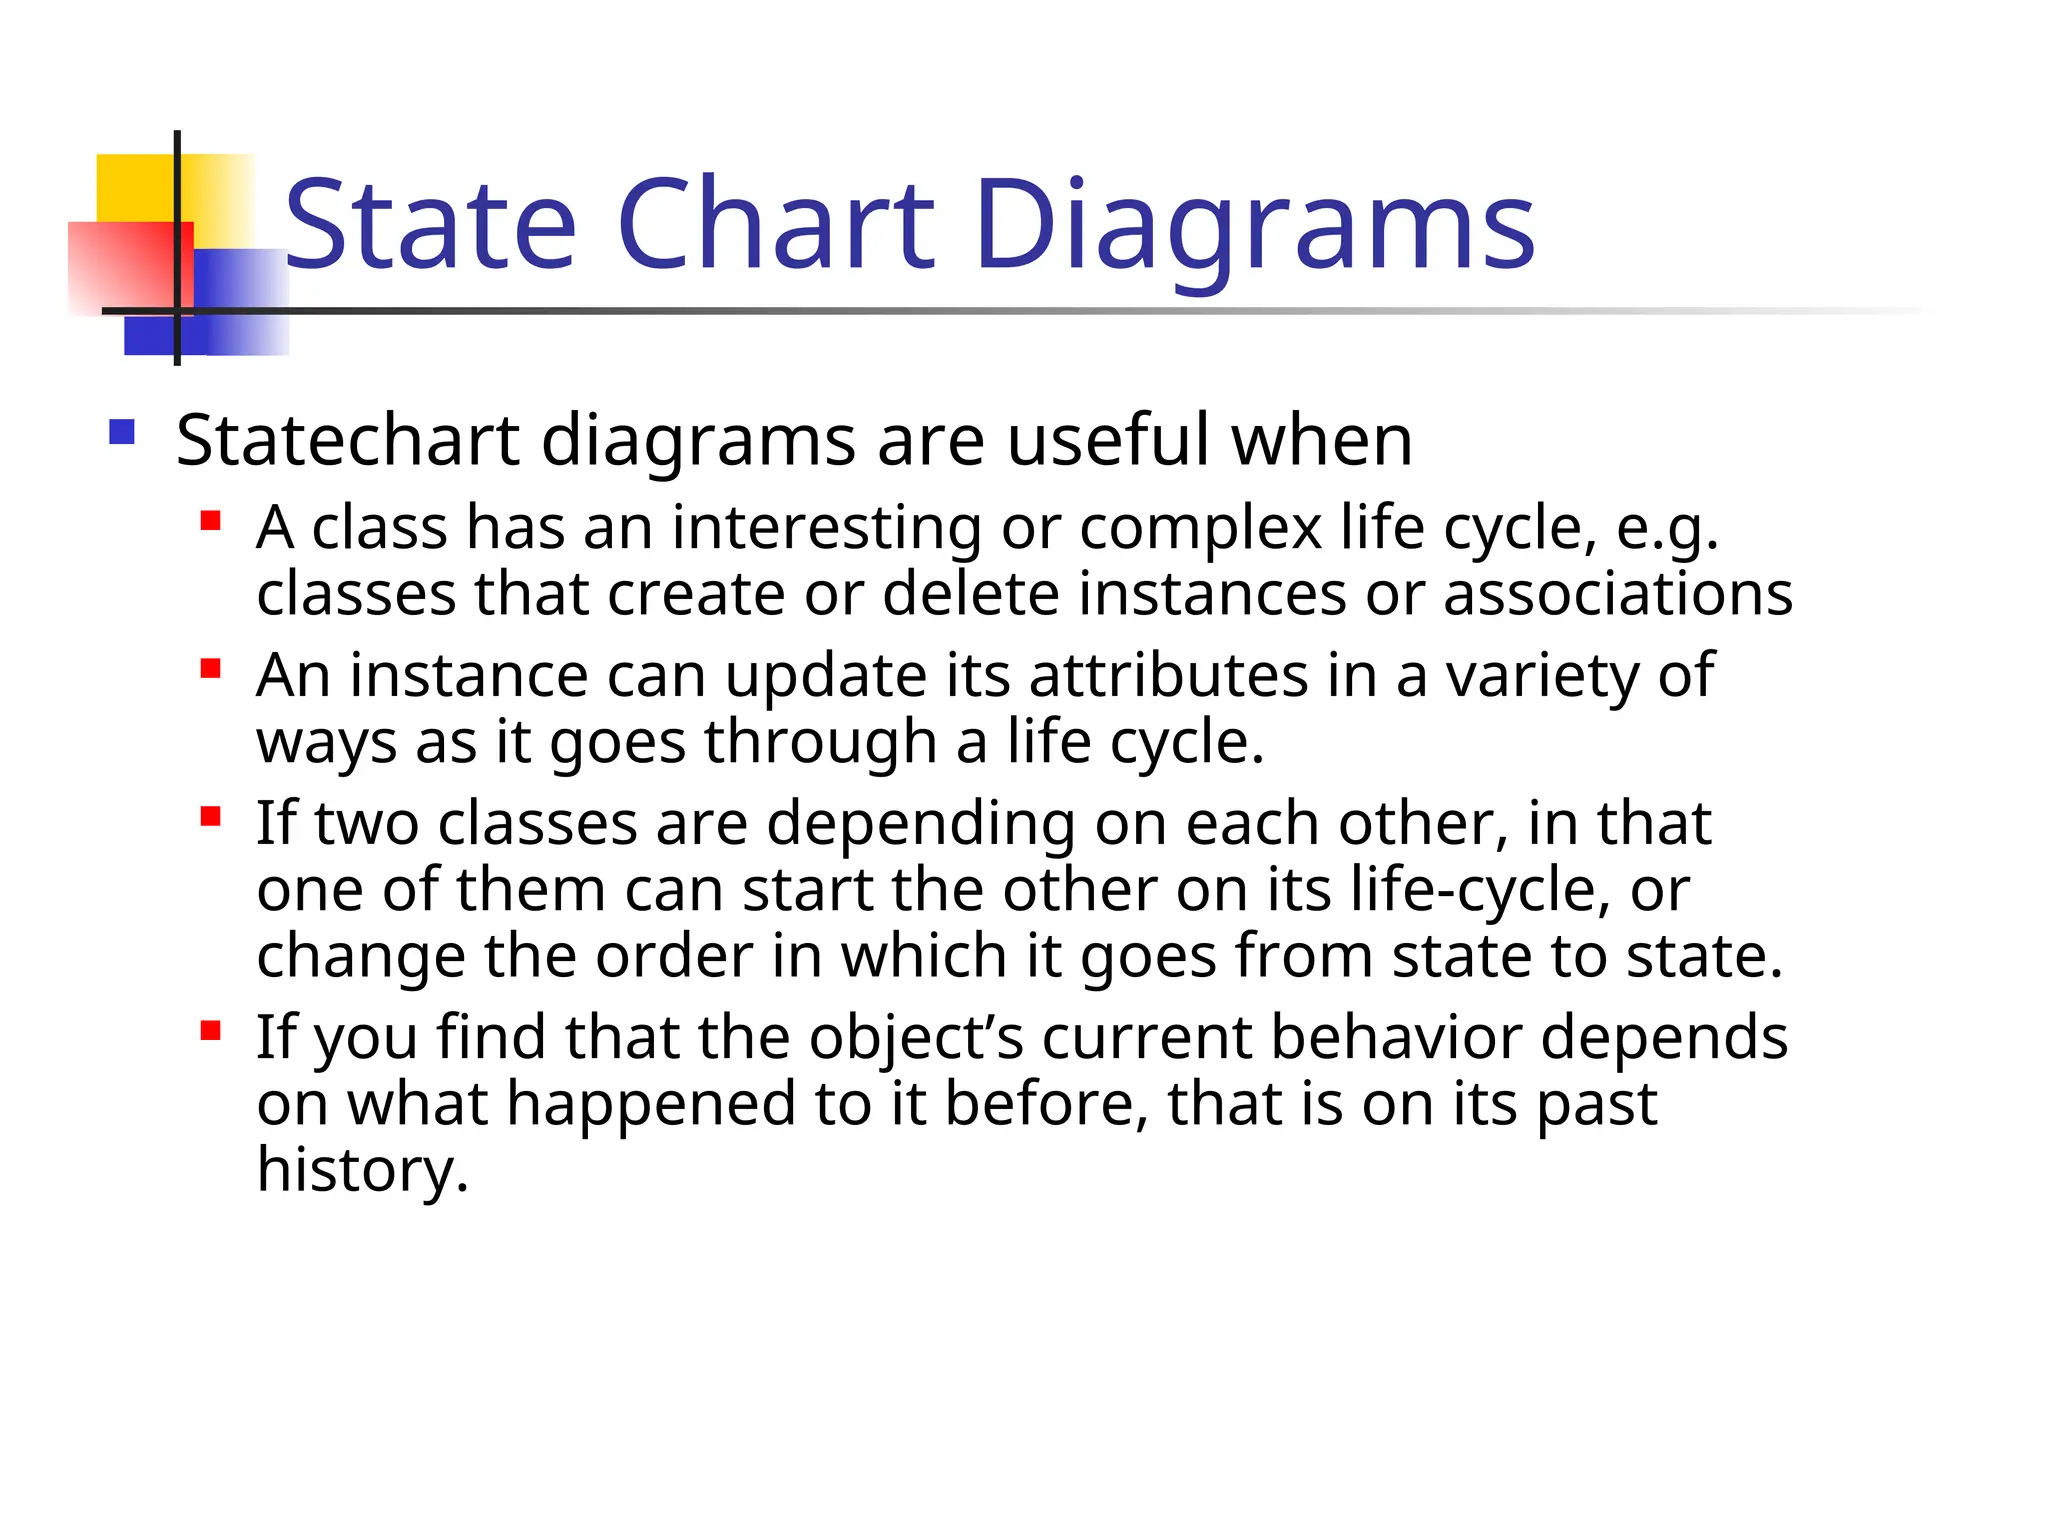
Statechart diagrams are useful when
A class has an interesting or complex life cycle, e.g.
classes that create or delete instances or associations
An instance can update its attributes in a variety of
ways as it goes through a life cycle.
If two classes are depending on each other, in that
one of them can start the other on its life-cycle, or
change the order in which it goes from state to state.
If you find that the object’s current behavior depends
on what happened to it before, that is on its past
history.
39.
Statechart Diagrams
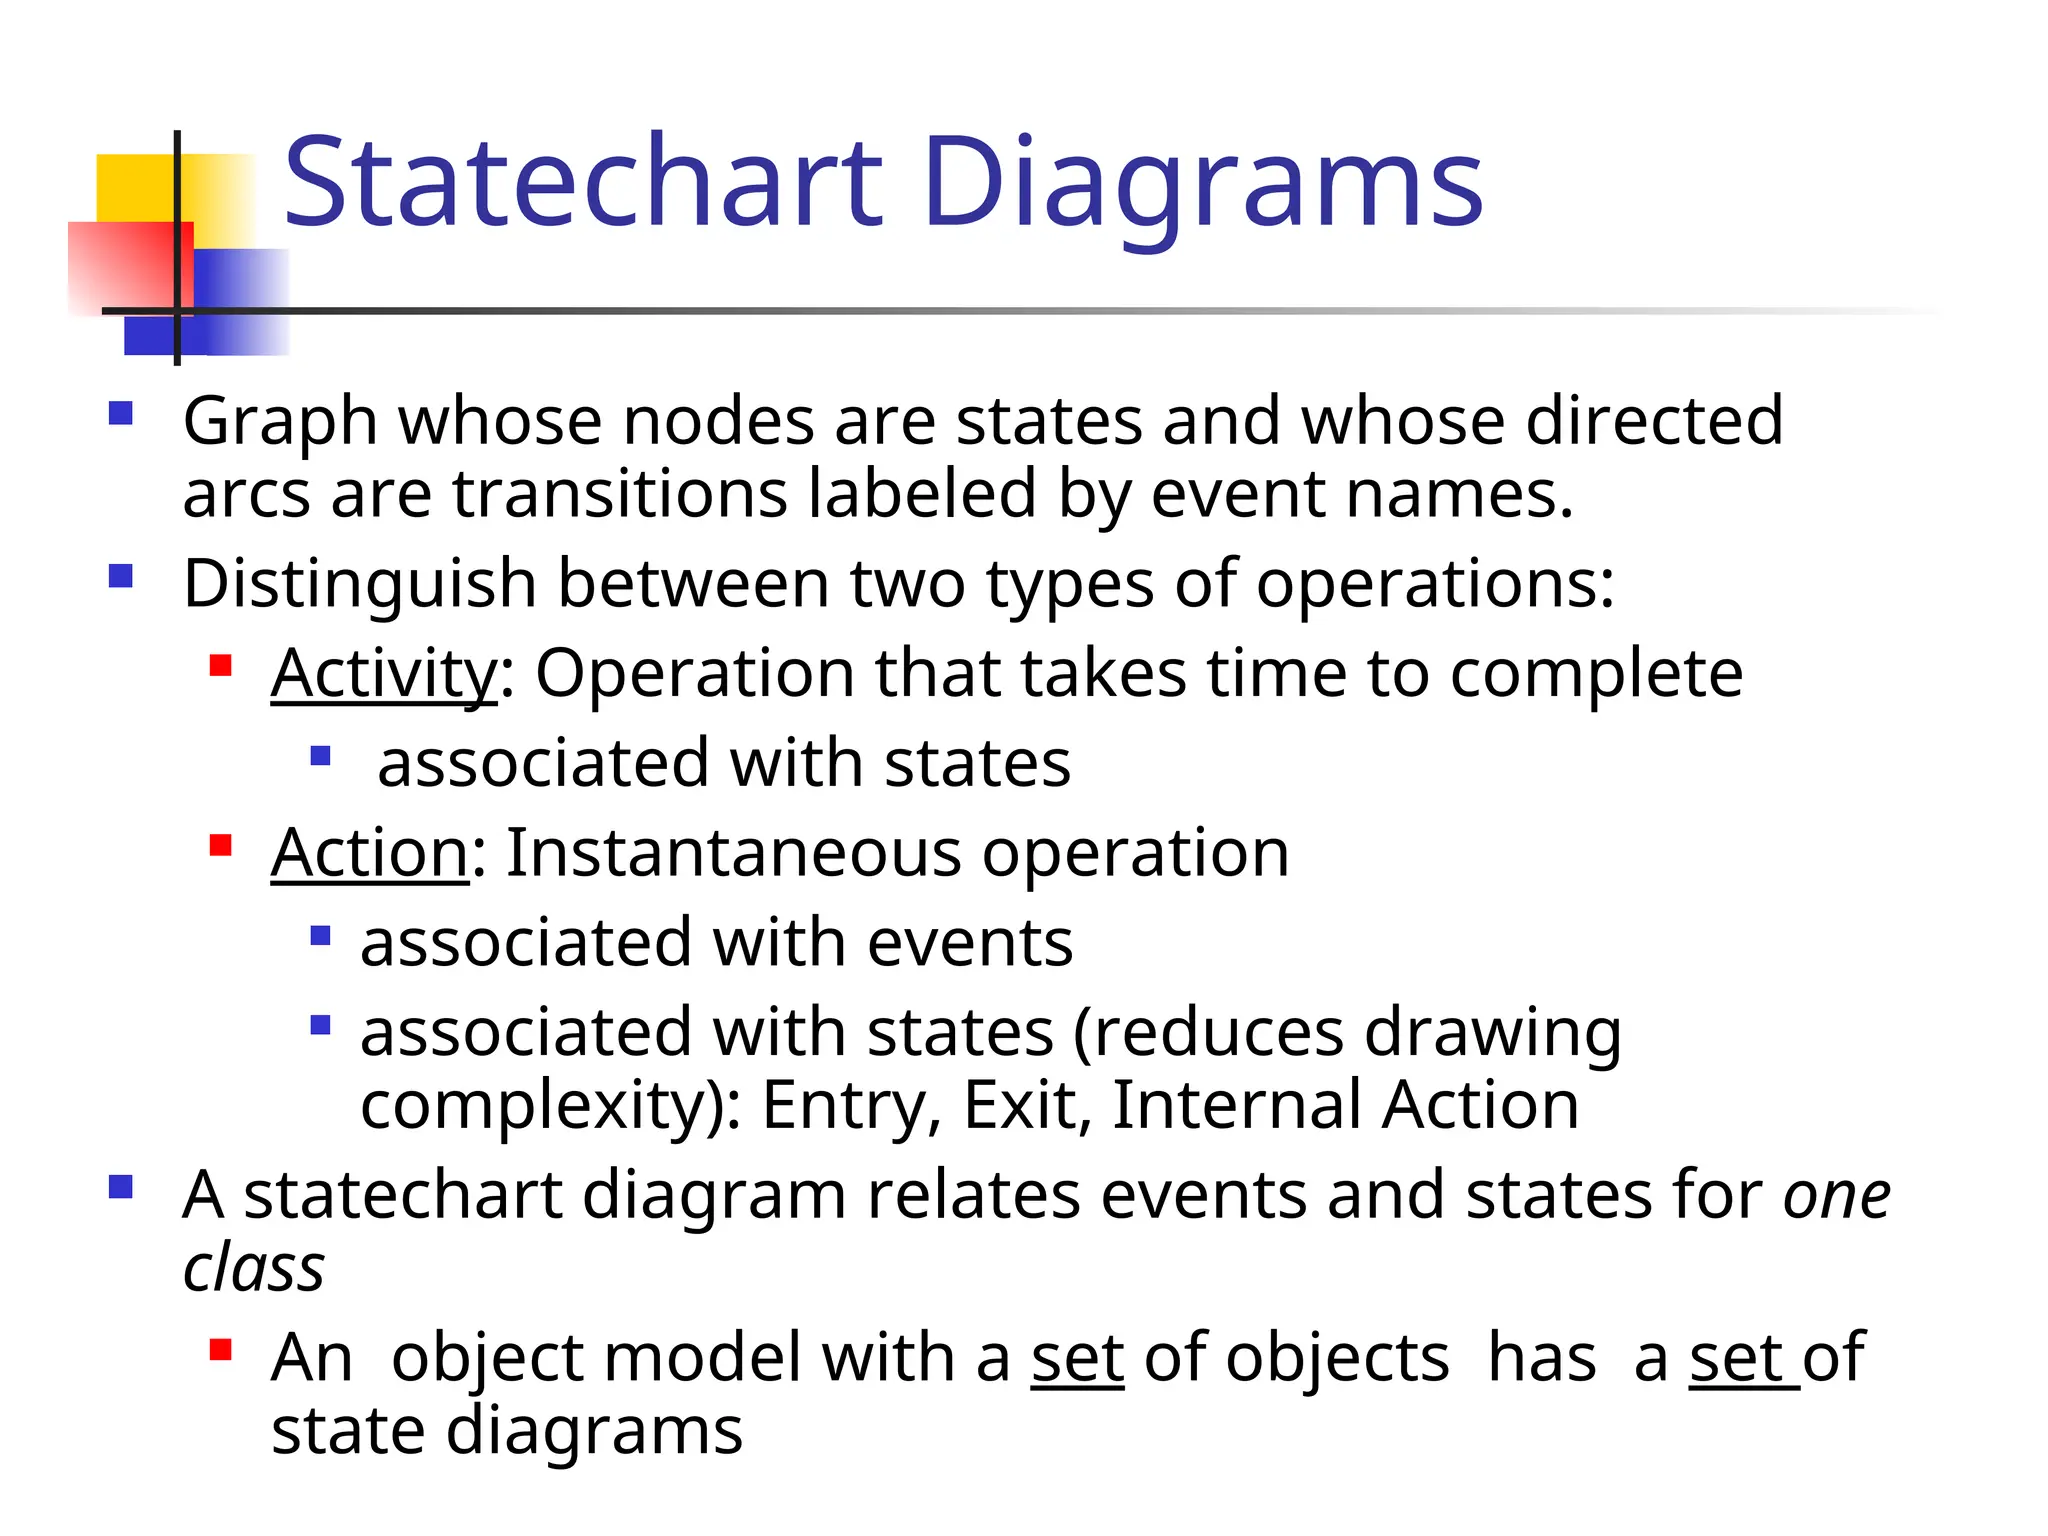
Graphwhose nodes are states and whose directed
arcs are transitions labeled by event names.
Distinguish between two types of operations:
Activity: Operation that takes time to complete
associated with states
Action: Instantaneous operation
associated with events
associated with states (reduces drawing
complexity): Entry, Exit, Internal Action
A statechart diagram relates events and states for one
class
An object model with a set of objects has a set of
state diagrams
40.
Statechart Diagrams
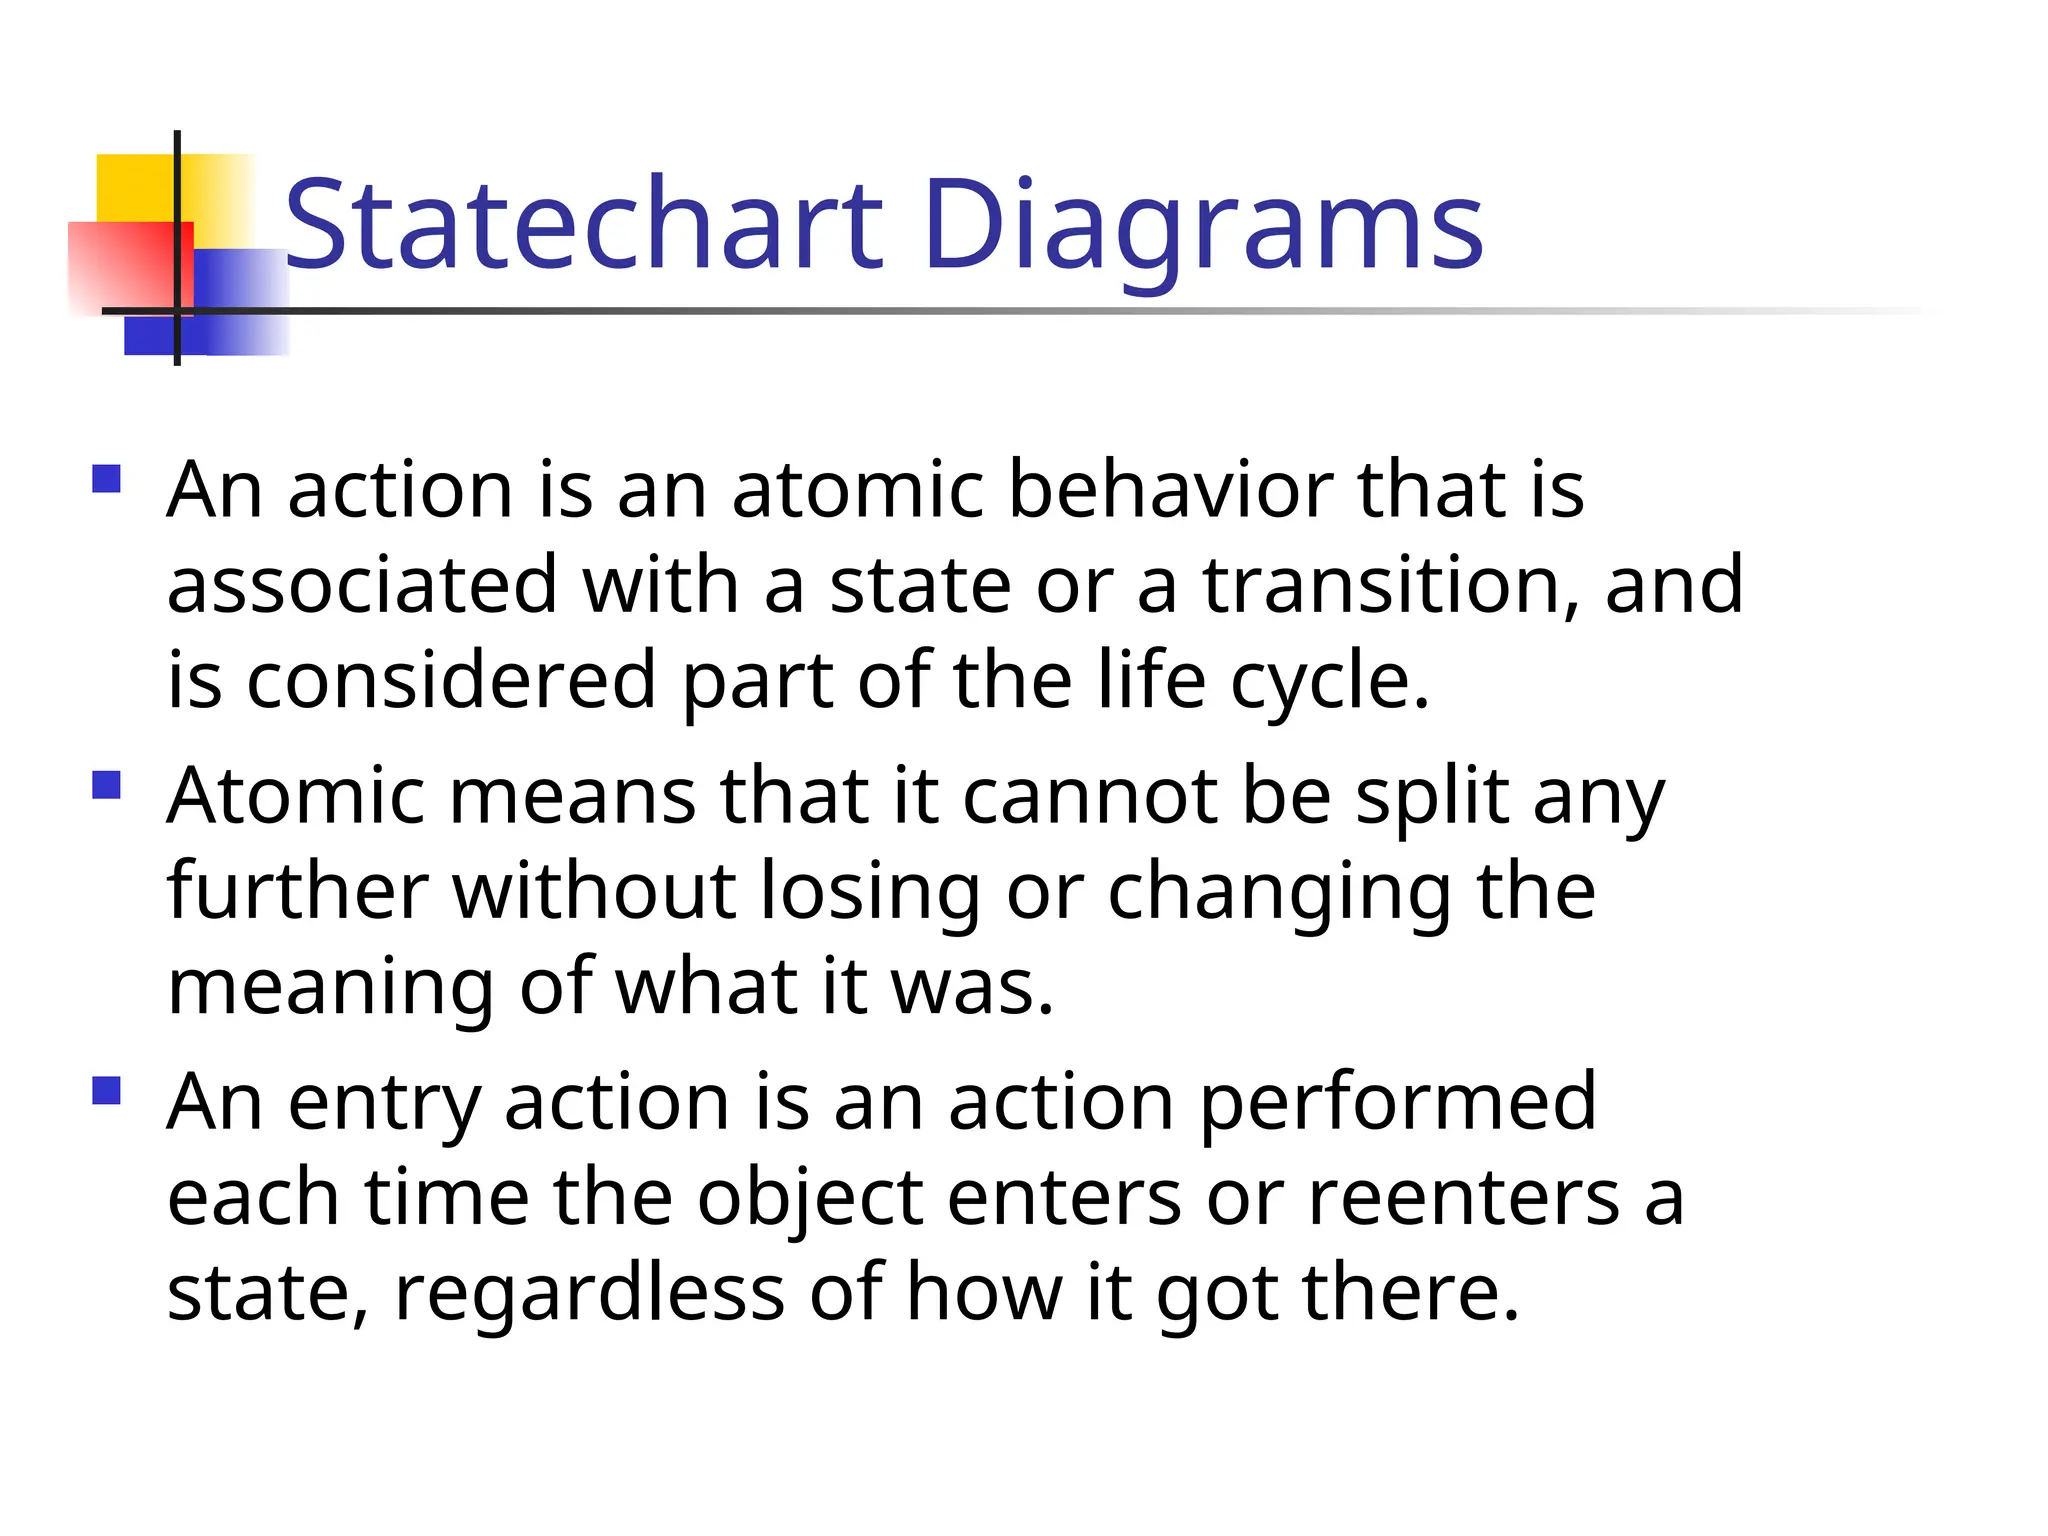
Anaction is an atomic behavior that is
associated with a state or a transition, and
is considered part of the life cycle.
Atomic means that it cannot be split any
further without losing or changing the
meaning of what it was.
An entry action is an action performed
each time the object enters or reenters a
state, regardless of how it got there.
41.
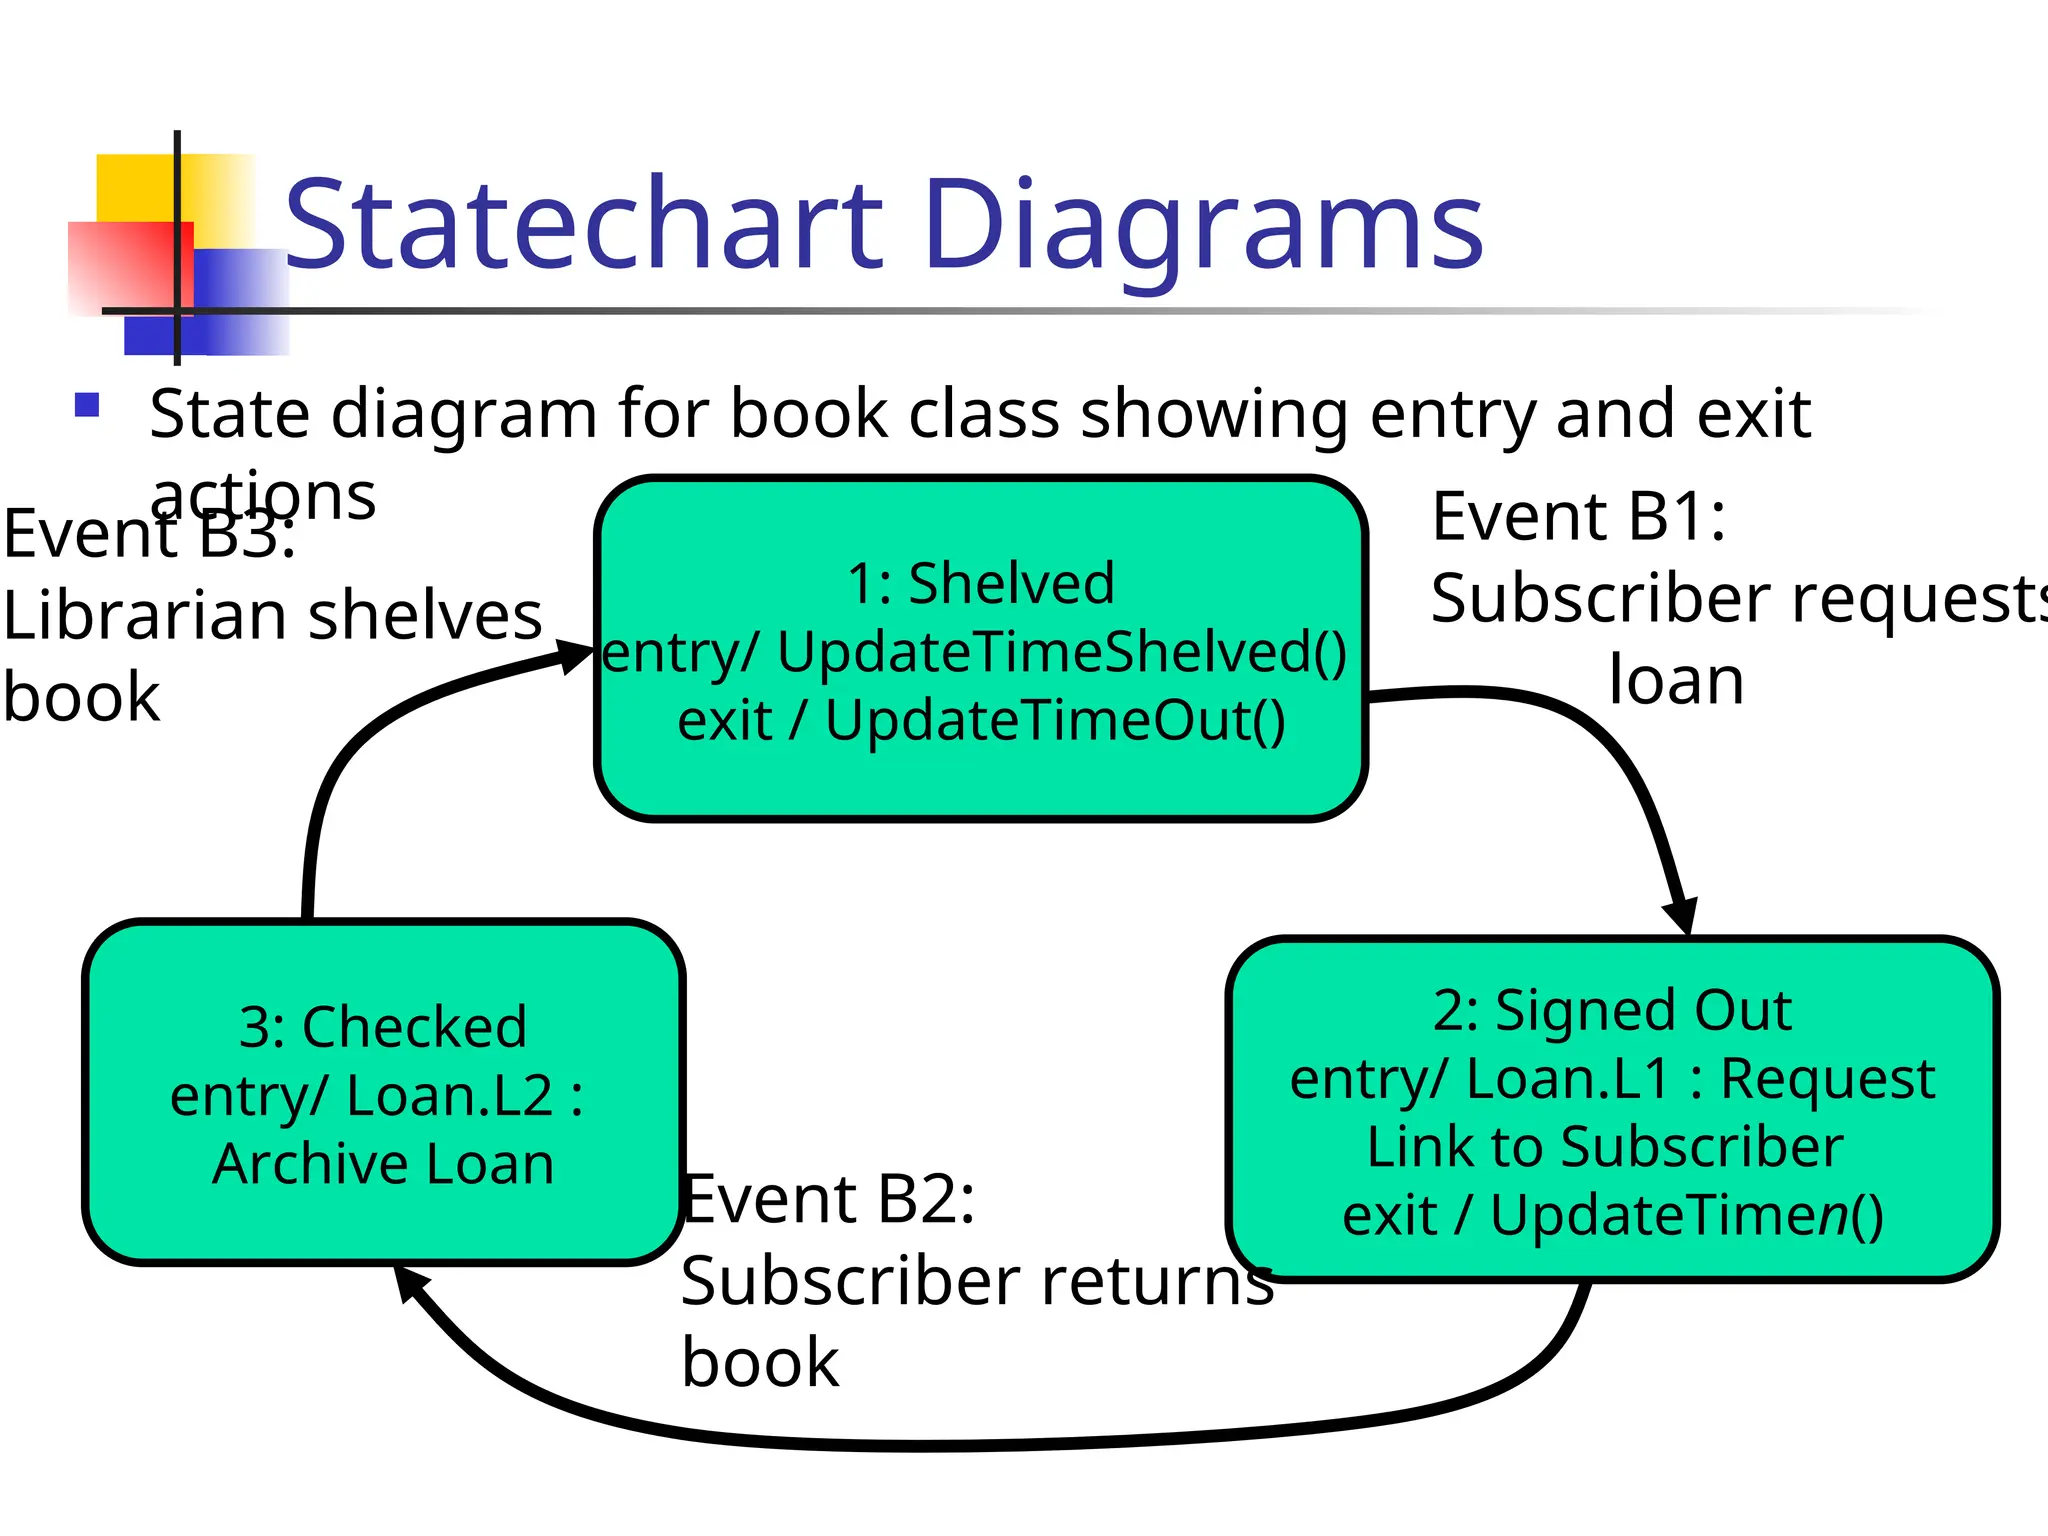
Statechart Diagrams
Statediagram for book class showing entry and exit
actions
3: Checked
entry/ Loan.L2 :
Archive Loan
1: Shelved
entry/ UpdateTimeShelved()
exit / UpdateTimeOut()
2: Signed Out
entry/ Loan.L1 : Request
Link to Subscriber
exit / UpdateTimen()
Event B3:
Librarian shelves
book
Event B1:
Subscriber requests
loan
Event B2:
Subscriber returns
book
42.
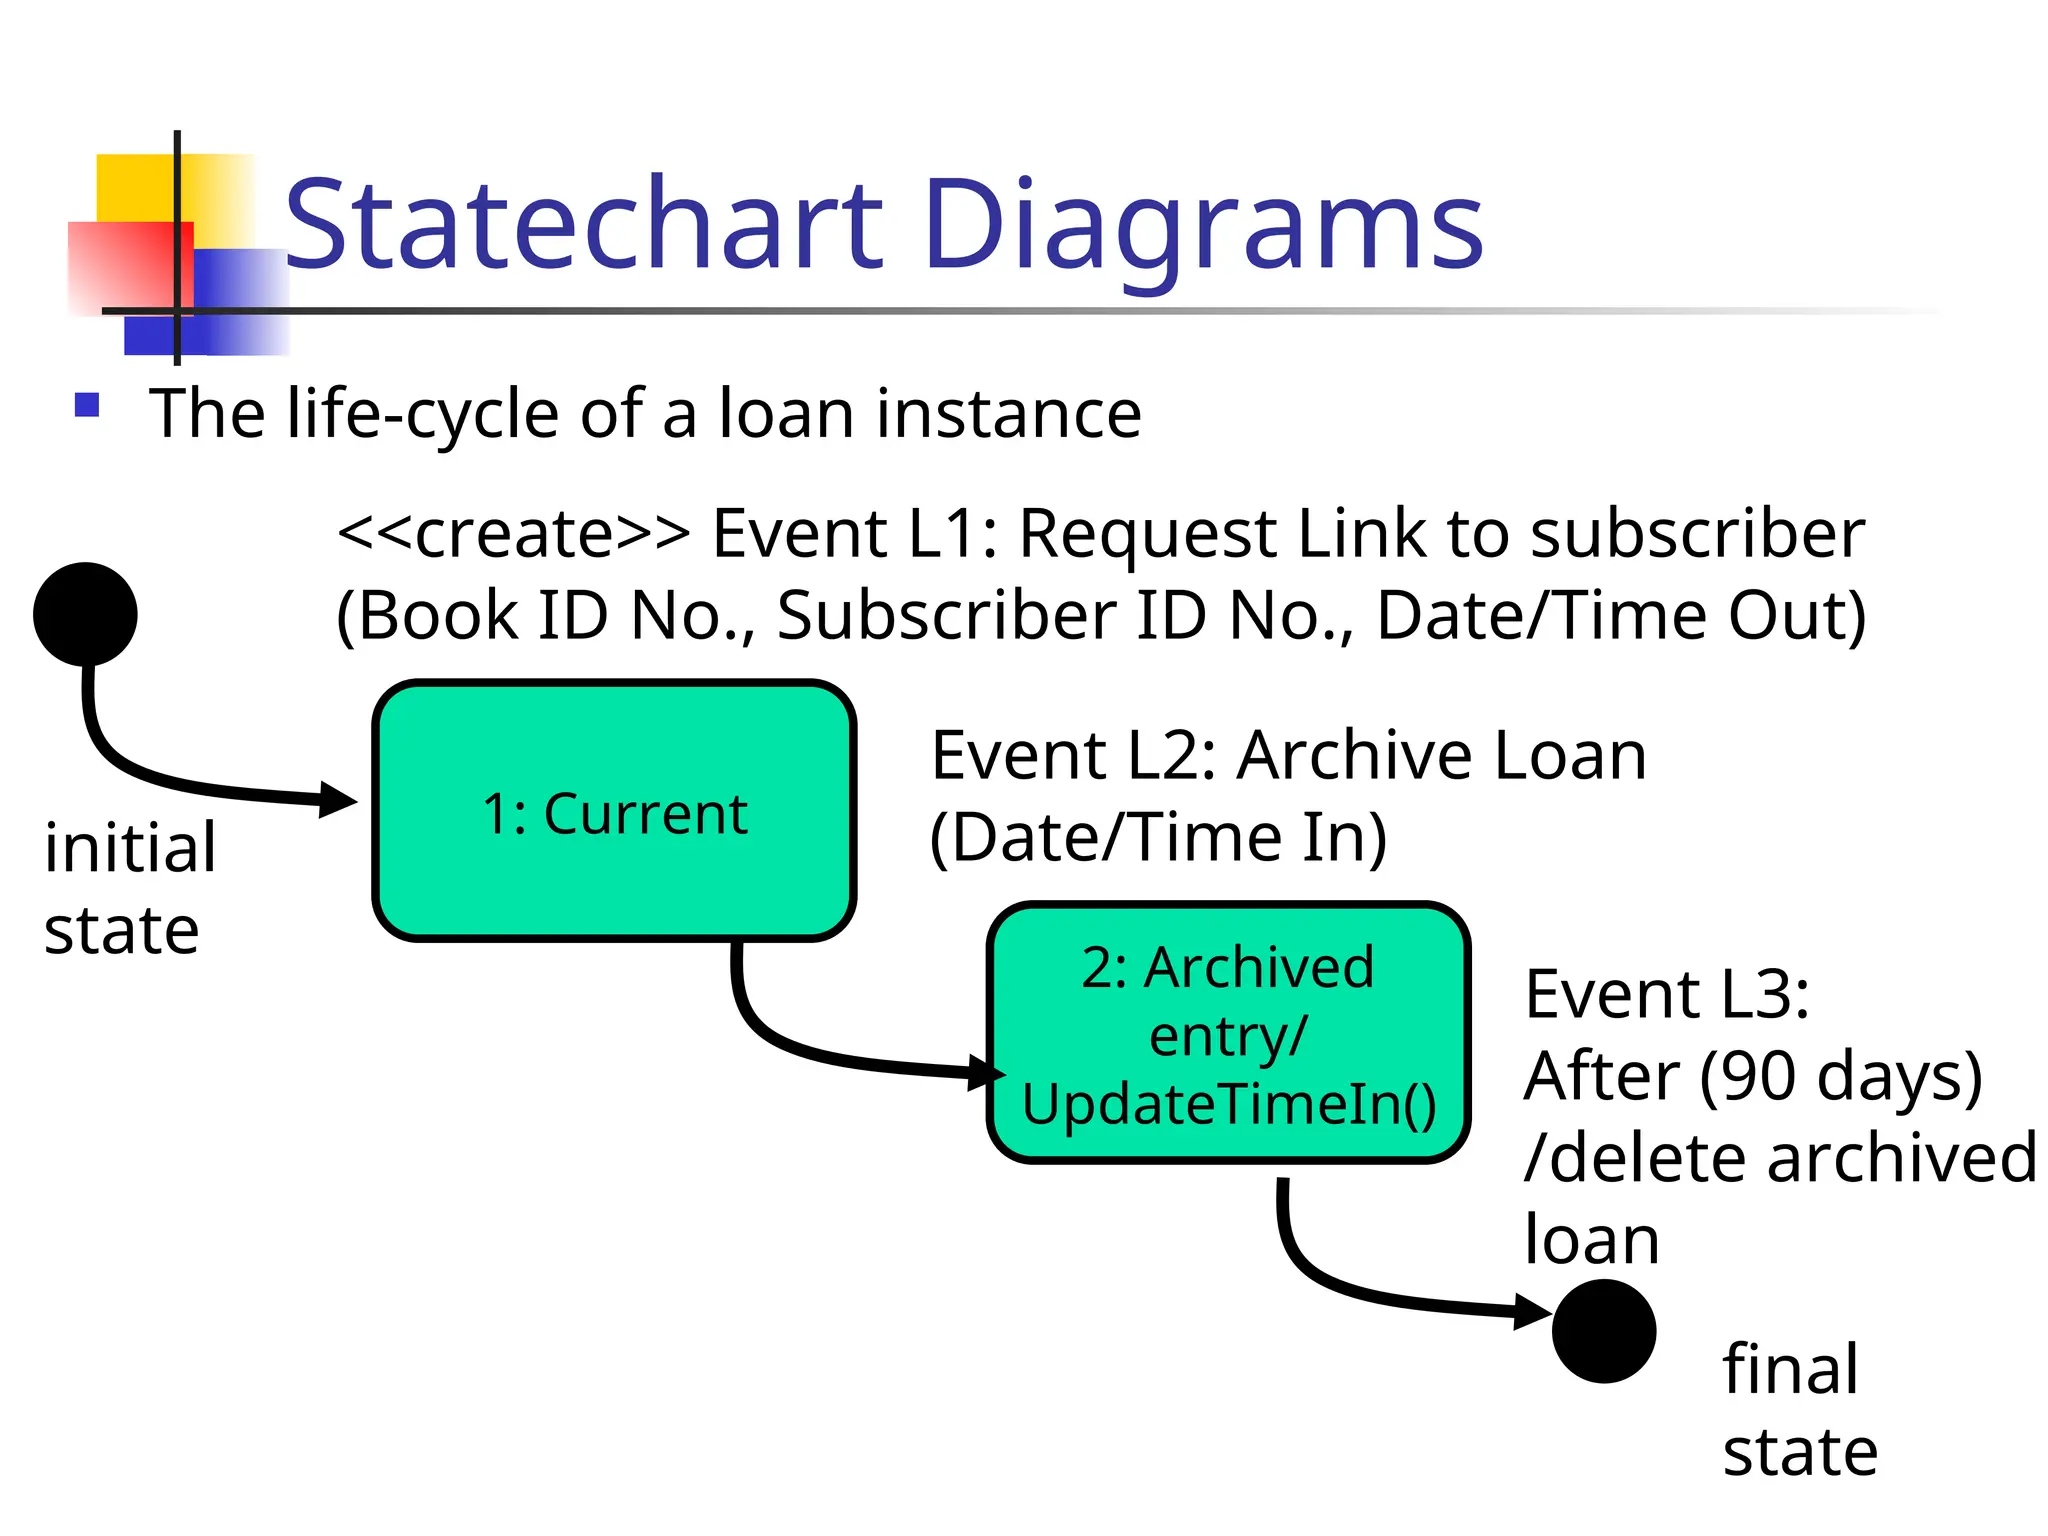
Statechart Diagrams
Thelife-cycle of a loan instance
1: Current
<<create>> Event L1: Request Link to subscriber
(Book ID No., Subscriber ID No., Date/Time Out)
2: Archived
entry/
UpdateTimeIn()
Event L2: Archive Loan
(Date/Time In)
initial
state
final
state
Event L3:
After (90 days)
/delete archived
loan
43.
CRC cards
Class-Responsibility-Collaborators(CRC) cards
are a useful tool to assign responsibilities to
classes
Not part of UML
Use 10x15 cm index cards
Use one card for each class
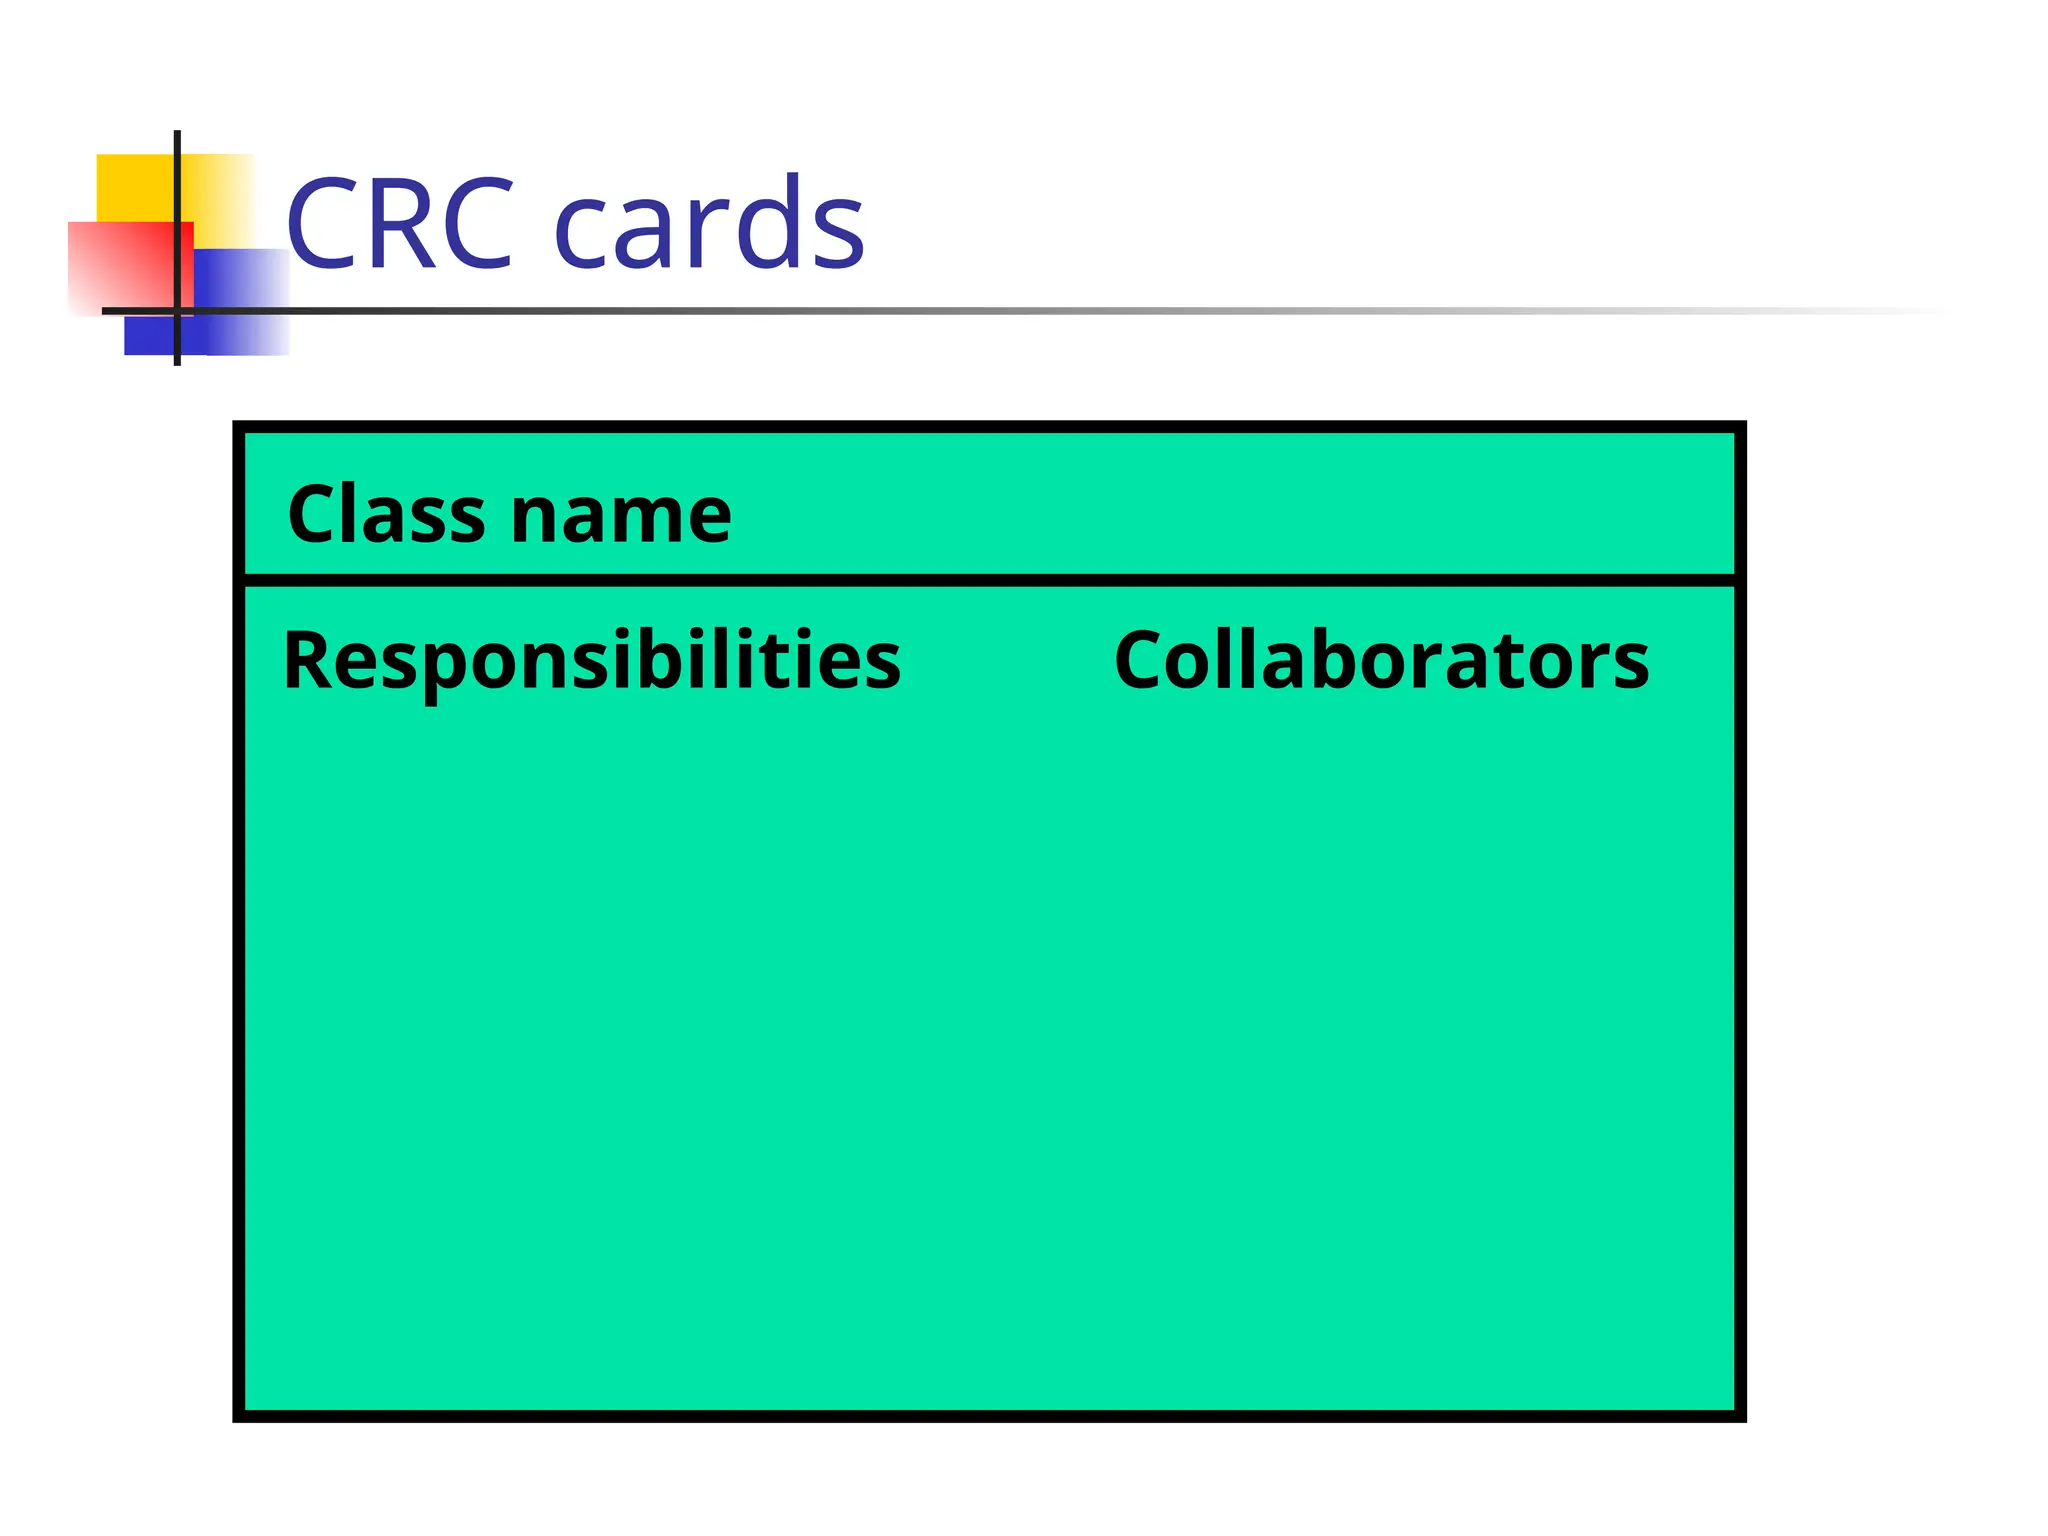
A CRC card contains:
Class name
Responsibilities
Collaborations
CRC cards
CRCmodeling is carried out by a
team of people
The goal of CRC modeling is:
to identify the classes that are
appropriate for modeling the problem
(similar to domain class model)
To identify their responsibilities and
collaborations
46.
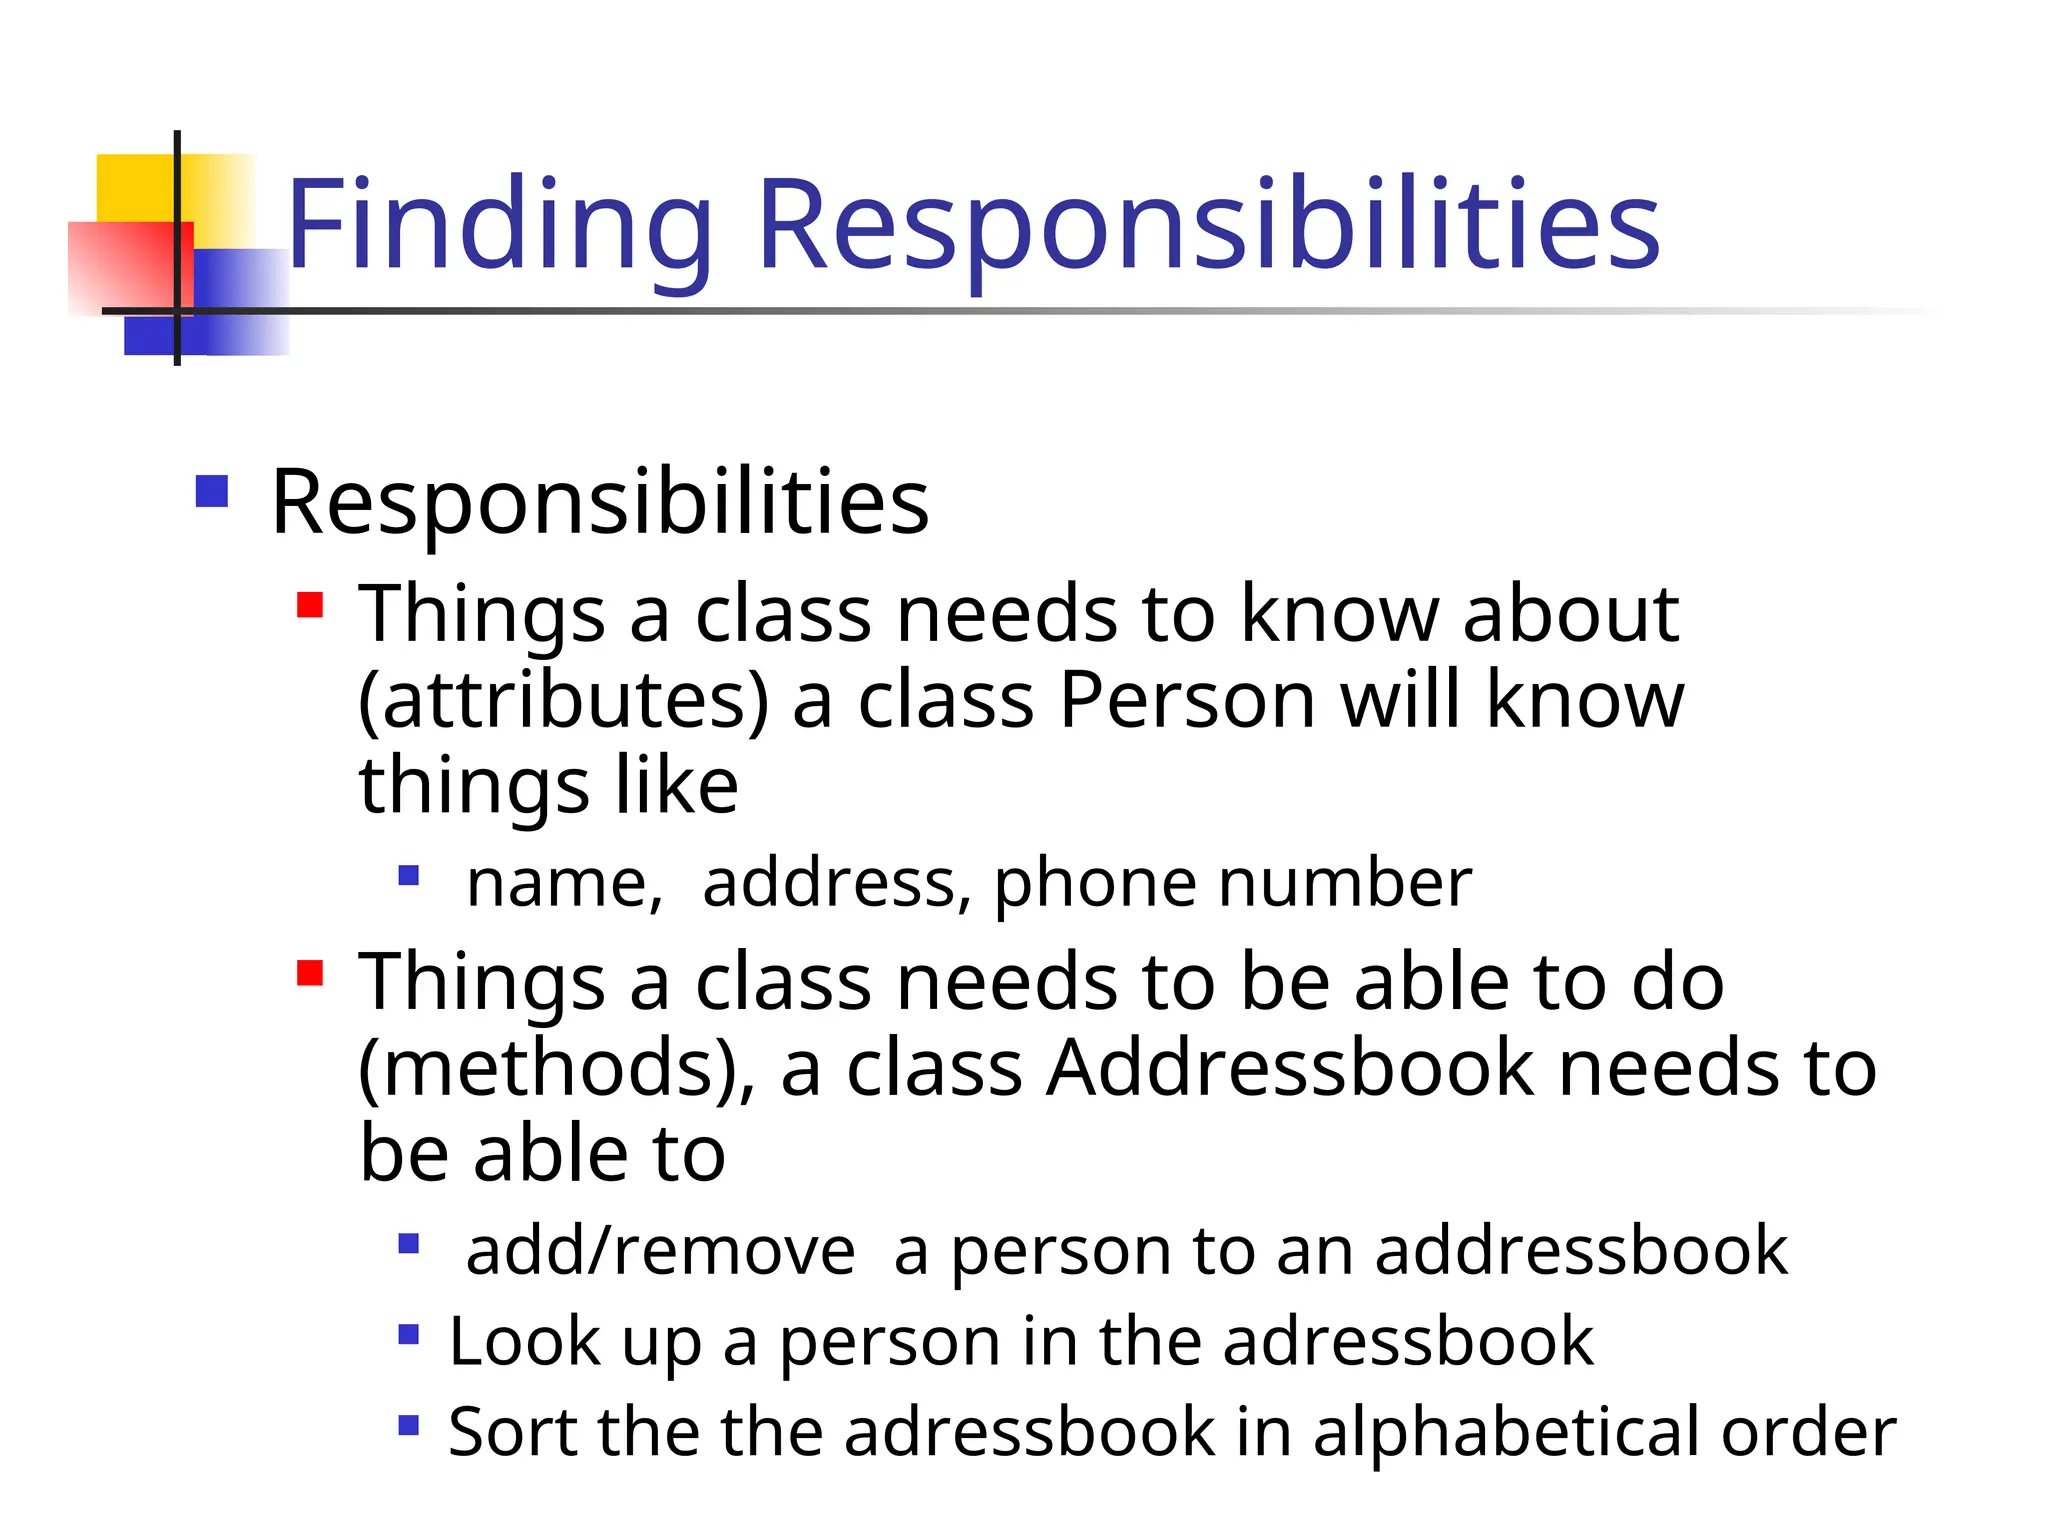
Finding Responsibilities
Responsibilities
Things a class needs to know about
(attributes) a class Person will know
things like
name, address, phone number
Things a class needs to be able to do
(methods), a class Addressbook needs to
be able to
add/remove a person to an addressbook
Look up a person in the adressbook
Sort the the adressbook in alphabetical order
47.
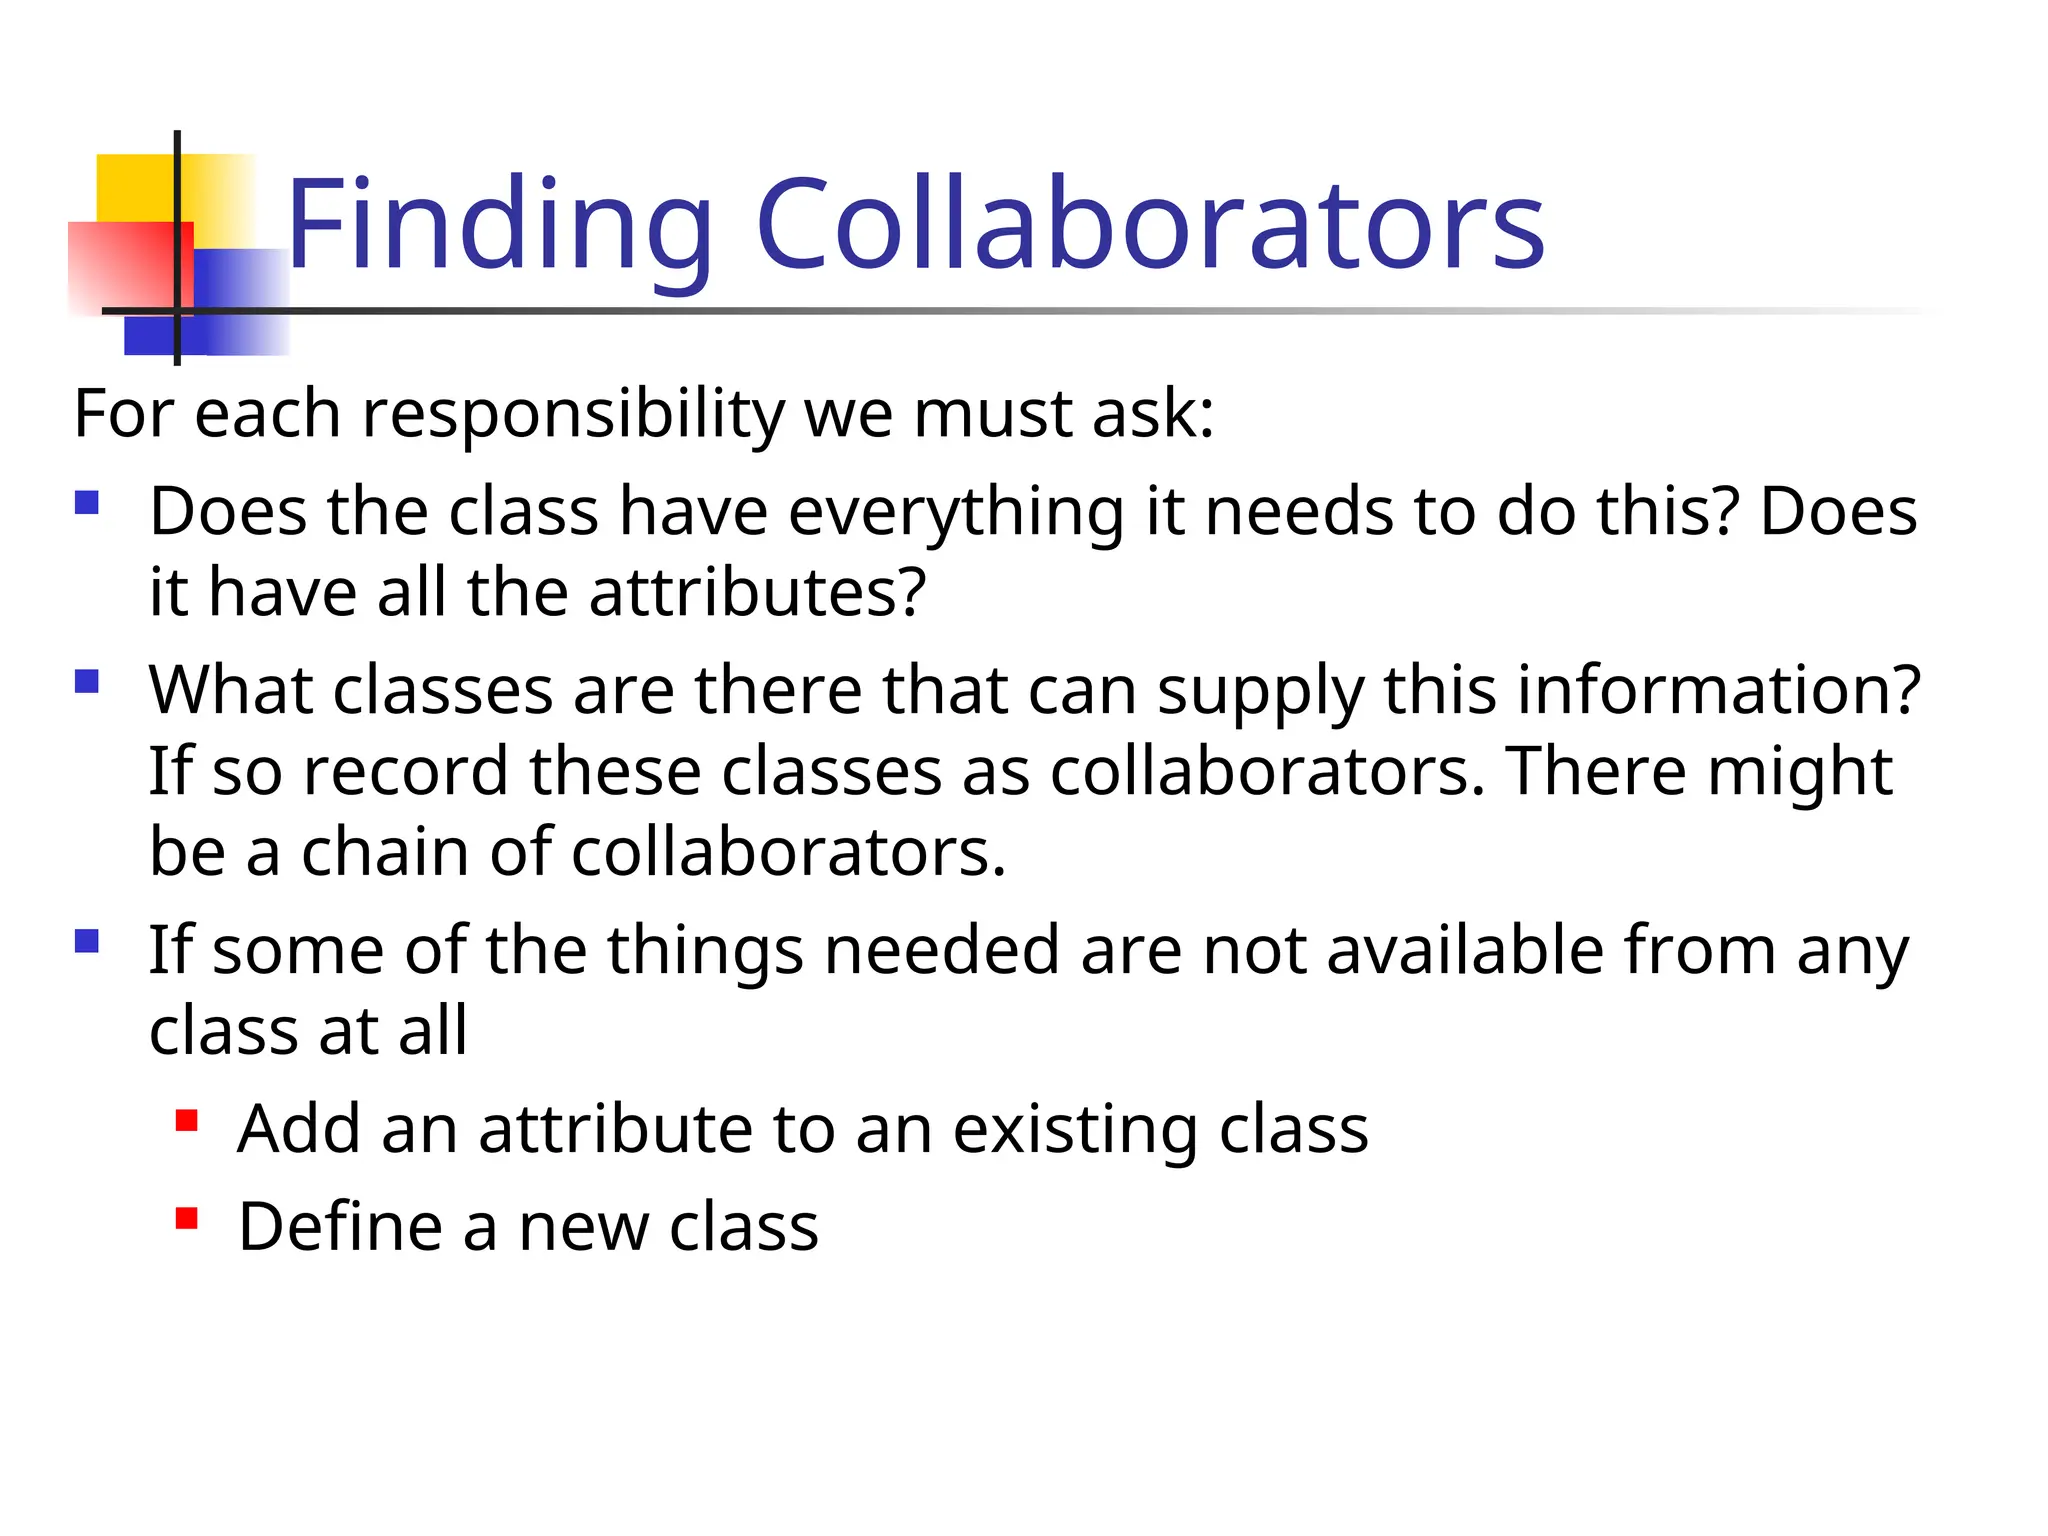
Finding Collaborators
For eachresponsibility we must ask:
Does the class have everything it needs to do this? Does
it have all the attributes?
What classes are there that can supply this information?
If so record these classes as collaborators. There might
be a chain of collaborators.
If some of the things needed are not available from any
class at all
Add an attribute to an existing class
Define a new class
#4 Parts of the DAIMLER system has a rich dynamic behavior, so the dynamic model is important.
Note that the dynamic model is an abstraction like the other models as well. Depending on what properties are most characteristic in a system, one of the models will be richer or more significant than others. If you have a choice to decide on a single model, which one would you use?
Object Model: Database, Preventive maintenance,
Dynamic Model: Communication, Notification Server, AGTS Server, Change management (Information flow!)
Temporal relationships are difficult to understand. Rumbaugh thinks, that a system can be best understood by first examining its static structure, that is the structure of its objects and their relationships to each other at a single moment in time. Then we examine the changes to the objects and their relationships over time. (Note that not everybody thinks that way. Heraklit: Everything flows (requires dynamic modeling first), Jacobsen: Use cases (Functional description)
Control is that aspect of a system that describes the sequences of operations that occur in response to external stimuli, without consideration of what the operations do, what the operate on or how they are implemented.
The major concepts of dynamic modeling are events which represent external stimuli and states, which represent the values of objects.
We will use state diagrams, which are a standard computer science concept. Question: Who does not know what a finite state automaton is?
In general we assume, that FSA are covered in 15-211 (Algorithms and Datastructures)
Similar to the problem in object modeling, we need to avoid to clutter our state diagrams (spaghetti diagrams). We will show that states and events can be organized into generalization hierarchies that share structure and behavior.
#12 A scenario is a sequence of events that occurs during one particular execution of a system. The scope of a scenario can vary: it may include all events in the system, or it may include only those events generated by certain objects of the system.
A scenario can be the historical record of executing a system or a thought experiment of exexuting a proposed system.
Each event transmits information from one object to another. For example, dial tone begins transmits a signal from the phone line to the caller.
#39 A state diagram relates events and states for one object.
A transition is drawn from
State diagrams would be quite useless if they only describe event patterns. A behavioral description of an object must specify what the object does in response to events. This is specified in operations attached to states and transition .
An activity is an operation that takes time to complete. Activities are always associated with a state. The notation do Activity1 within a state box indicates that activity A start on entry to the state and stops when complete.
Sometimes it is more advantageous to associate an action with a state. When? When all the state transitions cause the same action, it is a better notational convenience to list the action only once. This reduces clutter in the state diagrams.
An action is an instantaneous operation. This is of course a relative notion. What we mean by instantaneous is that the duration of the operation is insignificant when compared to the time resolution of the state diagram. It also means we do not care about the internal structure of this operation. An action is therefore associated with an event.
![Sequence Diagrams
Iteration in sequence diagrams is denoted by
a box with an associated iteration expression.
:Cashier
makenewSale()
: System
enterItem(itemID, quantity)
description, total
*[more items]](https://image.slidesharecdn.com/lecture5-250601183805-140bcf58/75/OOADPPT-Lecture-5-The-OOAD-Presentation-pptx-19-2048.jpg)
![Sequence Diagrams
Iteration in sequence diagrams is denoted by
a box with an associated continuation
expression.
:Cashier
makenewSale()
: System
enterItem(itemID, quantity)
description, total
[no more items]](https://image.slidesharecdn.com/lecture5-250601183805-140bcf58/75/OOADPPT-Lecture-5-The-OOAD-Presentation-pptx-20-2048.jpg)
![Sequence Diagrams
Conditional messages: A message might
contain a guard condition denoted in
square brackets
obj1:Class
[x < 15] calculate()
obj2: Class
message()](https://image.slidesharecdn.com/lecture5-250601183805-140bcf58/75/OOADPPT-Lecture-5-The-OOAD-Presentation-pptx-22-2048.jpg)
![Sequence Diagrams
Conditionality
obj1:Class
[x < 15] calculate()
obj2: Class
message()
obj3: Class
[x > 20] calculate()](https://image.slidesharecdn.com/lecture5-250601183805-140bcf58/75/OOADPPT-Lecture-5-The-OOAD-Presentation-pptx-24-2048.jpg)
![Collaboration Diagrams
Conditional Messages : A conditional message is
shown by following a sequence number with a
conditional clause in square brackets.
:Foo
1 [color=red]: msg2()
:Bar
msg1()](https://image.slidesharecdn.com/lecture5-250601183805-140bcf58/75/OOADPPT-Lecture-5-The-OOAD-Presentation-pptx-35-2048.jpg)
![Collaboration Diagrams
:classA
:classC
1a [test]: msg2()
1a.1: msg3()
:classB
msg1()
:classD
1b [not test]:
msg4()
1b.1: msg5()
Mutually exclusive messages:](https://image.slidesharecdn.com/lecture5-250601183805-140bcf58/75/OOADPPT-Lecture-5-The-OOAD-Presentation-pptx-36-2048.jpg)
![State Chart Diagrams
The state of an object is defined by the set of
values currently held by its attributes.
At any moment in time, an object exists in a
certain manner or conditon, which we say is a
state.
Source
State
Entry and
Exit actions
Target
State
Event [Guard] / Action](https://image.slidesharecdn.com/lecture5-250601183805-140bcf58/75/OOADPPT-Lecture-5-The-OOAD-Presentation-pptx-37-2048.jpg)