Download as PDF, PPTX


![State charts in UML:
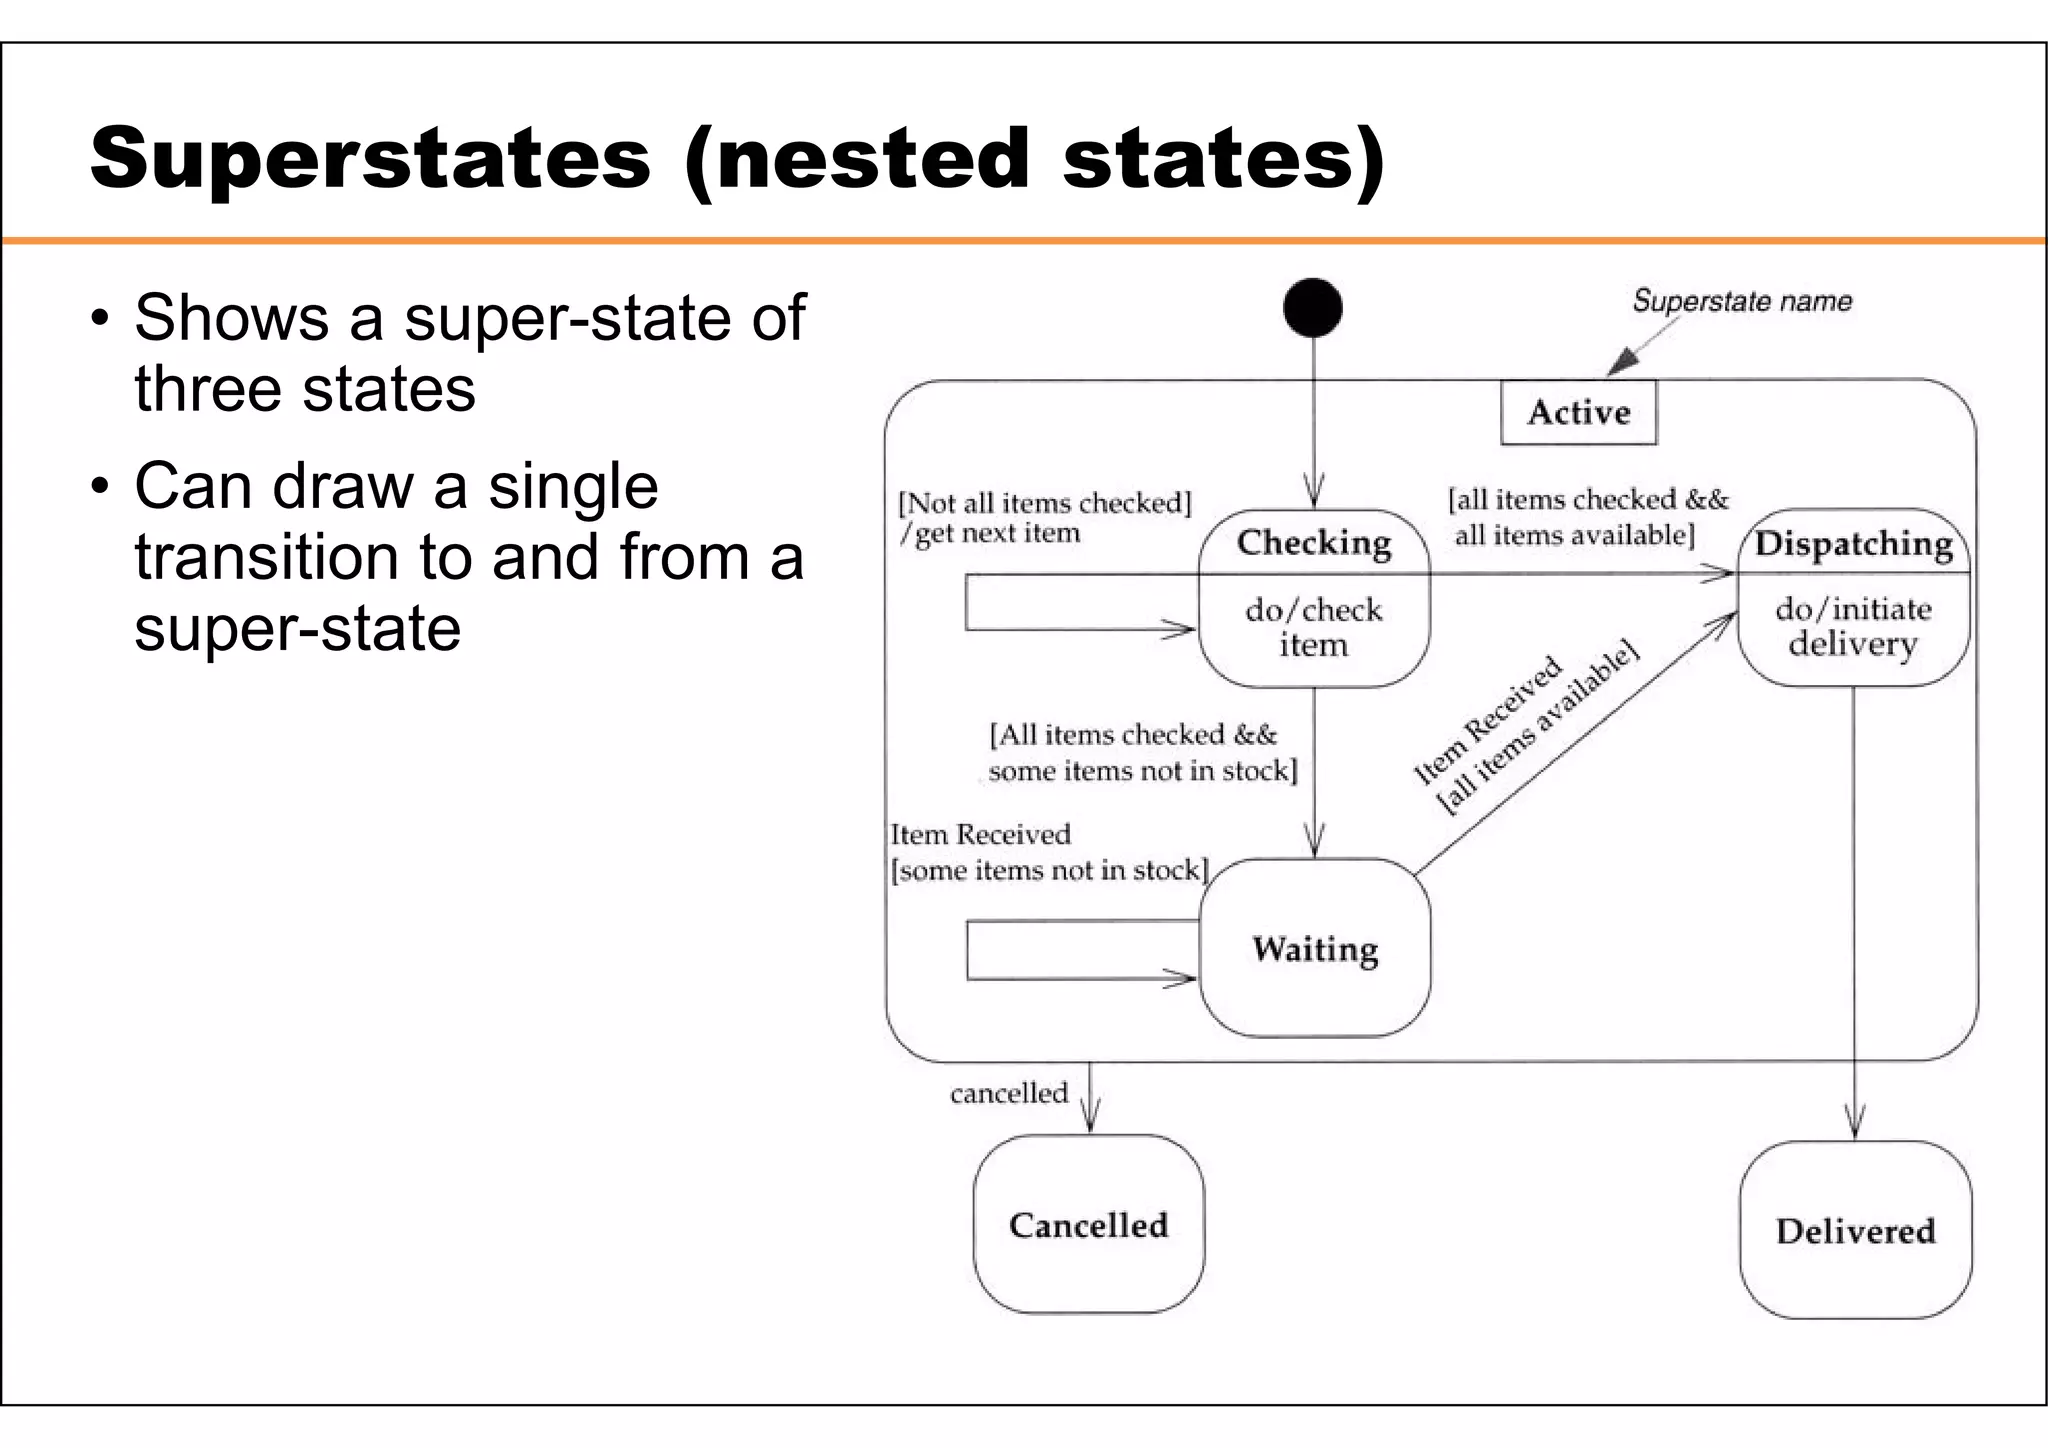
• Transitions labels have three optional parts:
Event [Guard] / Action
• Find one of each
• Item Received is an event, /get first item is
an action, [Not all items checked] is a guard
• State may also label activities, e.g.,
do/check item
• Actions, associated with transitions, occur
quickly
and aren’t interruptible
• Activities, associated with states, can take
longer and
are interruptible
• Definition of “quickly” depends on the kind of
system,
e.g., real-time vs. info system States in ovals, Transitions as arrows](https://image.slidesharecdn.com/ooad-unit-3-211230042709/75/CS8592-OOAD-Lecture-Notes-Unit-3-45-2048.jpg)

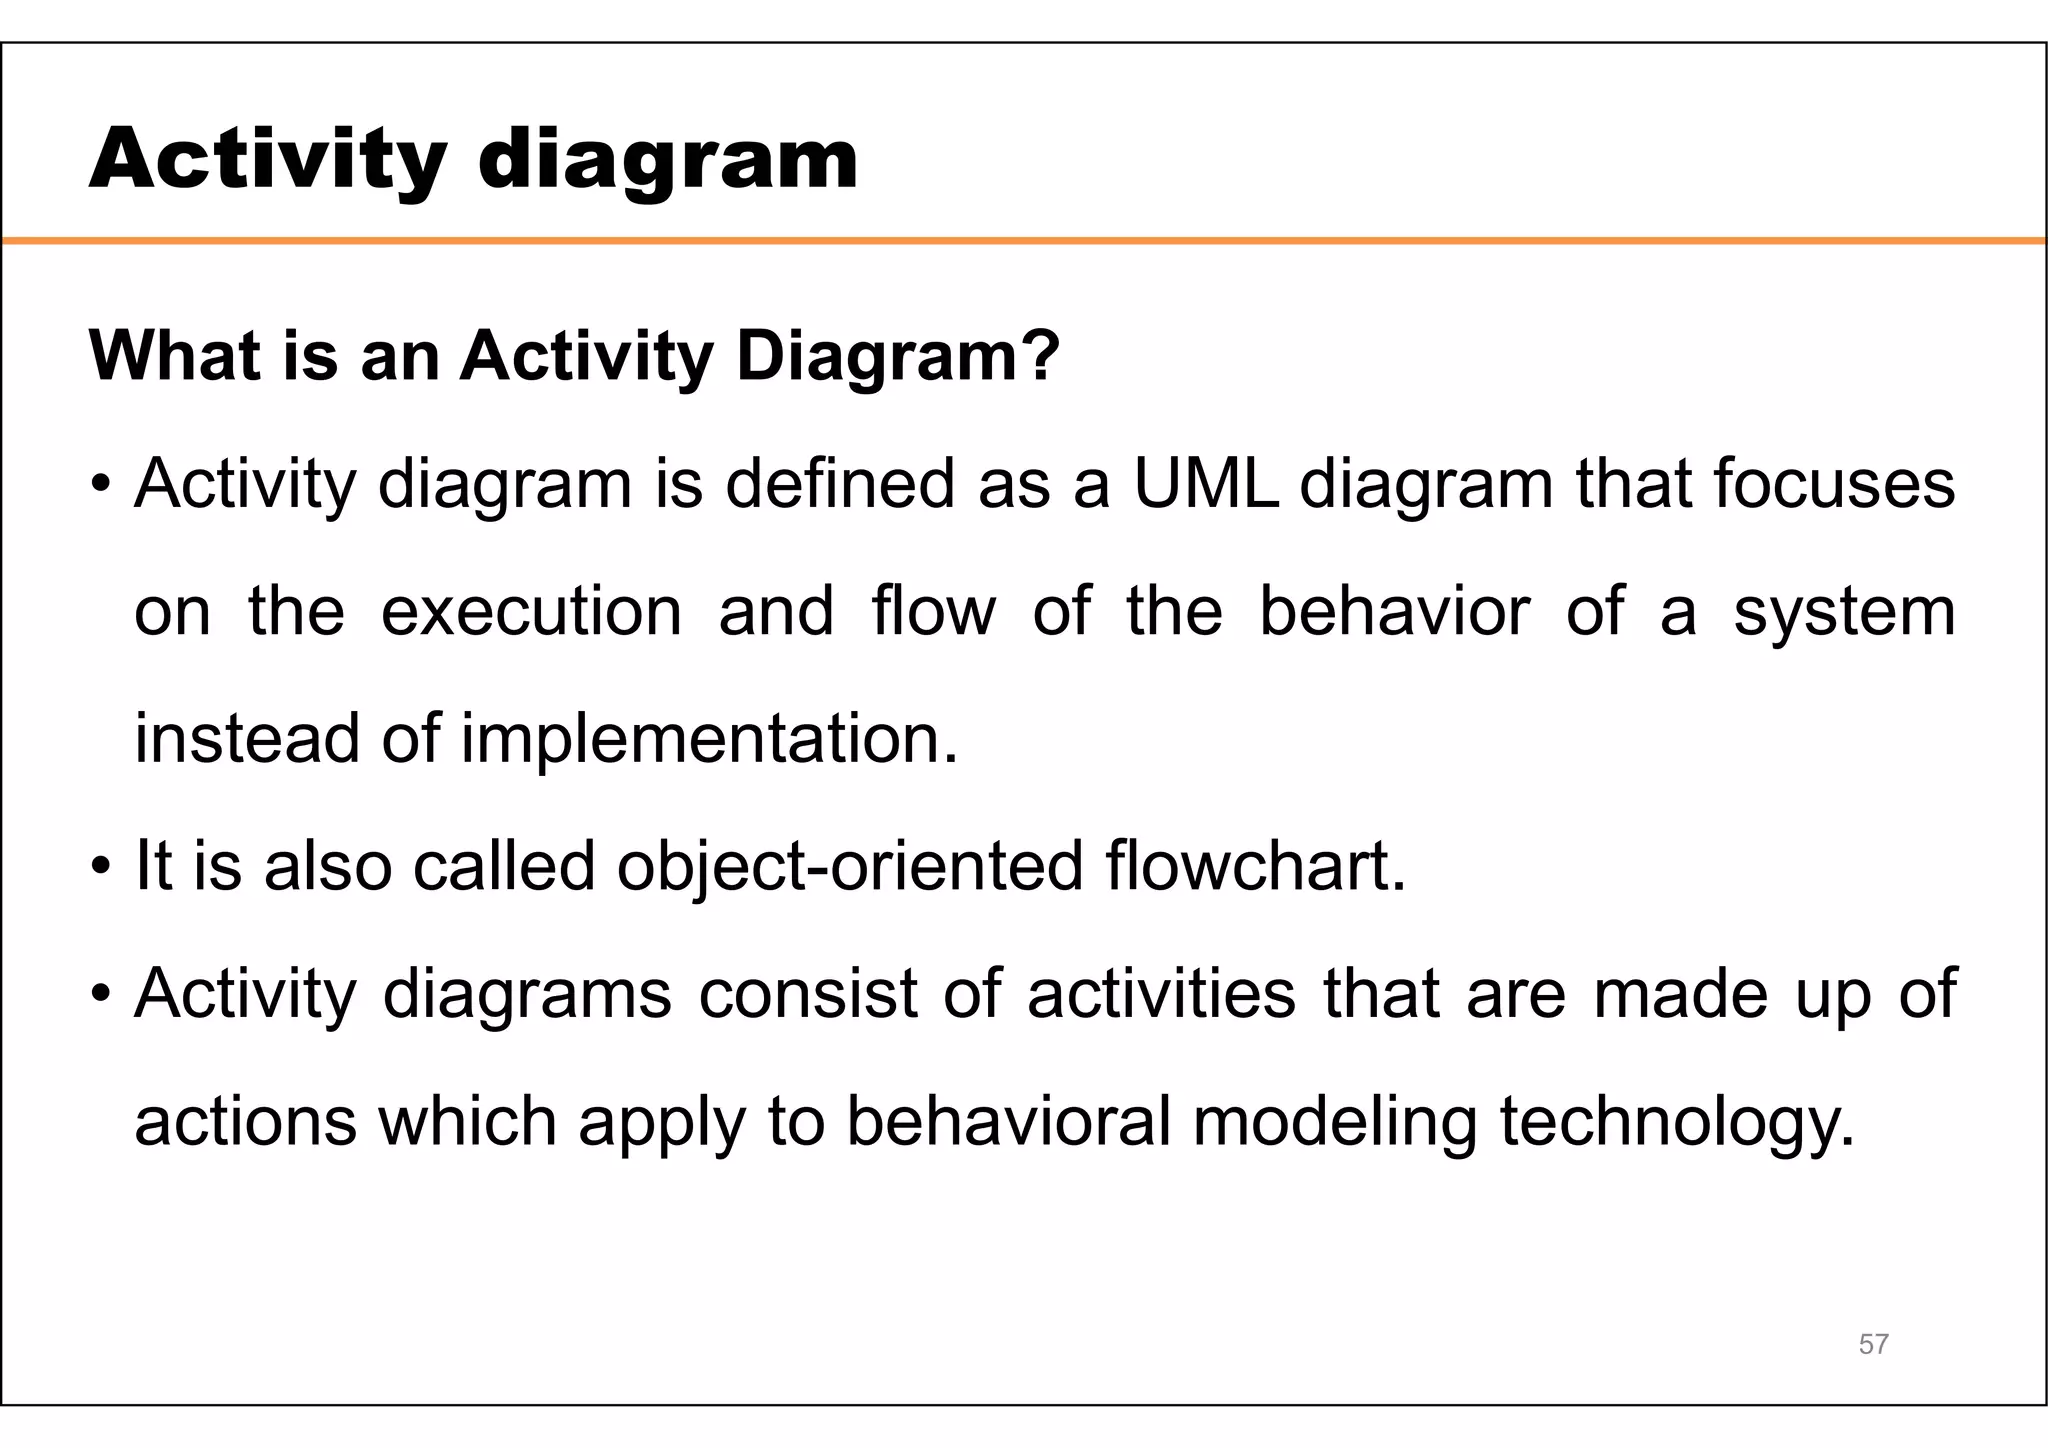
![Classes as active state machines
• Consider whether a class should keep track of its own internal state
• Example from Bertrand Meyer: first cut design of LINKED_LIST class
class LINKABLE[T] --linkable cells
feature
value:T;
right: LINKABLE[T]; --next cell
--routines to change_value, change_right
end;
class LINKEDLIST[T]
feature
nb_elements: INTEGER;
first_element: LINKABLE[T];
value(i:INTEGER):T is --value of i-th element; loop until it reaches the ith element
insert(i:INTEGER; val:T); --loop until it reaches ith element, then insert val
delete(i:INTEGER); --loop until it reaches ith element, then delete it
• Problems with first-cut?
• Getting the loops right is tricky (loops are error-prone)
• Redundancy: the same loop logic recurs in all these routines
• Reuse leads to inefficiency: suppose I want a routine search
• Find an element then replace it: I'll do the loop twice!
• Need some way to keep track of the position I found!
• Could return the LINKABLE cell found, but this would ruin encapsulation](https://image.slidesharecdn.com/ooad-unit-3-211230042709/75/CS8592-OOAD-Lecture-Notes-Unit-3-53-2048.jpg)


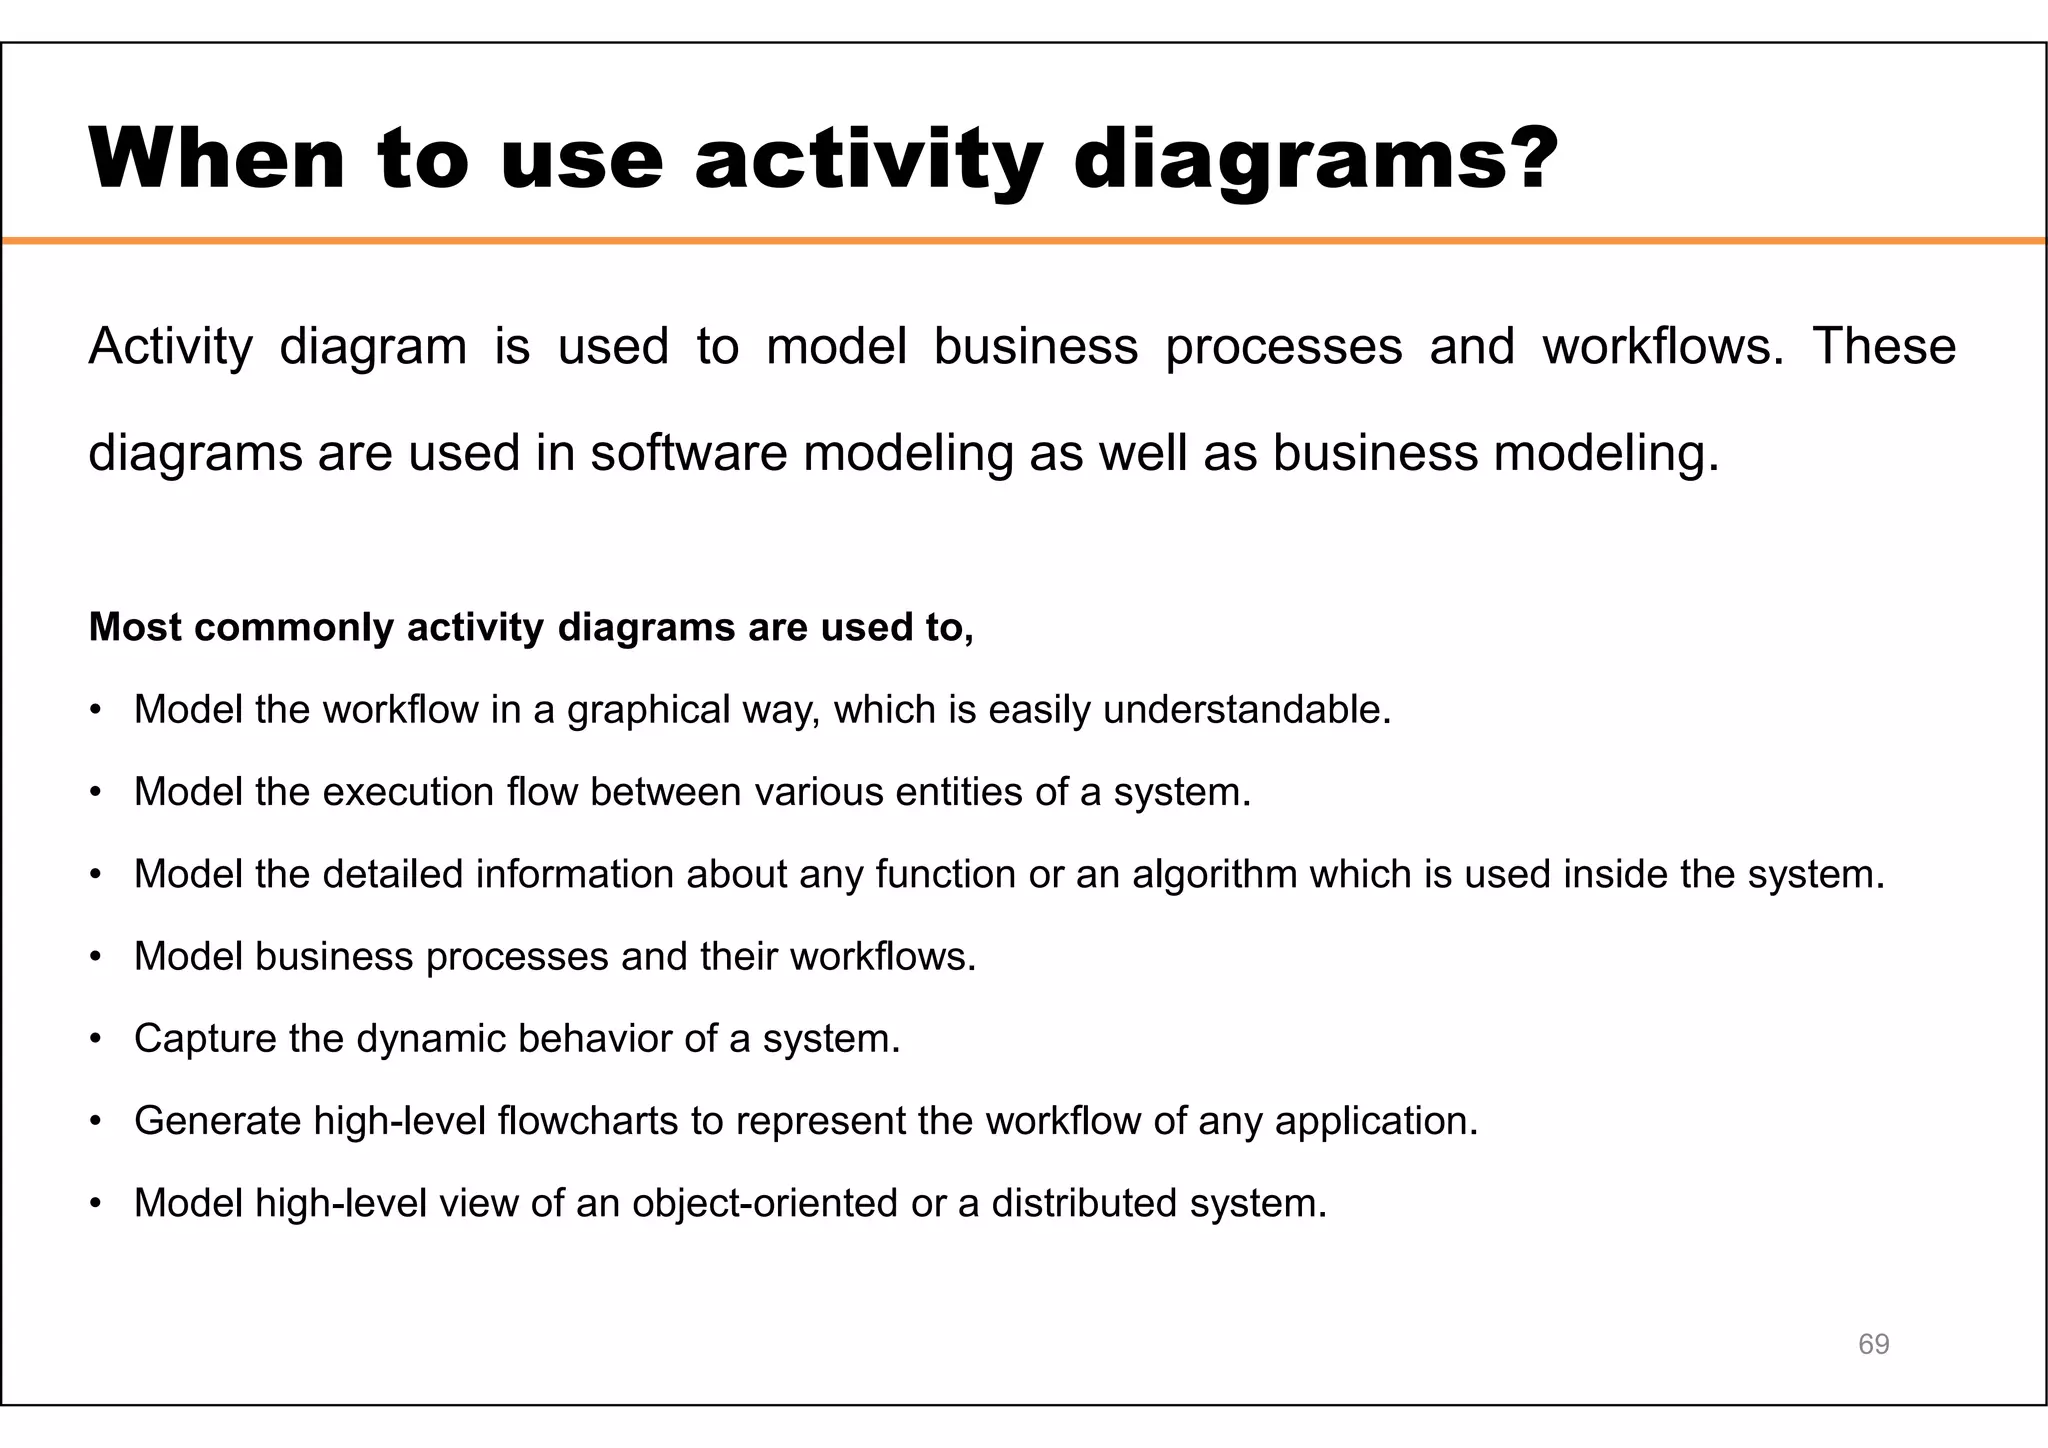
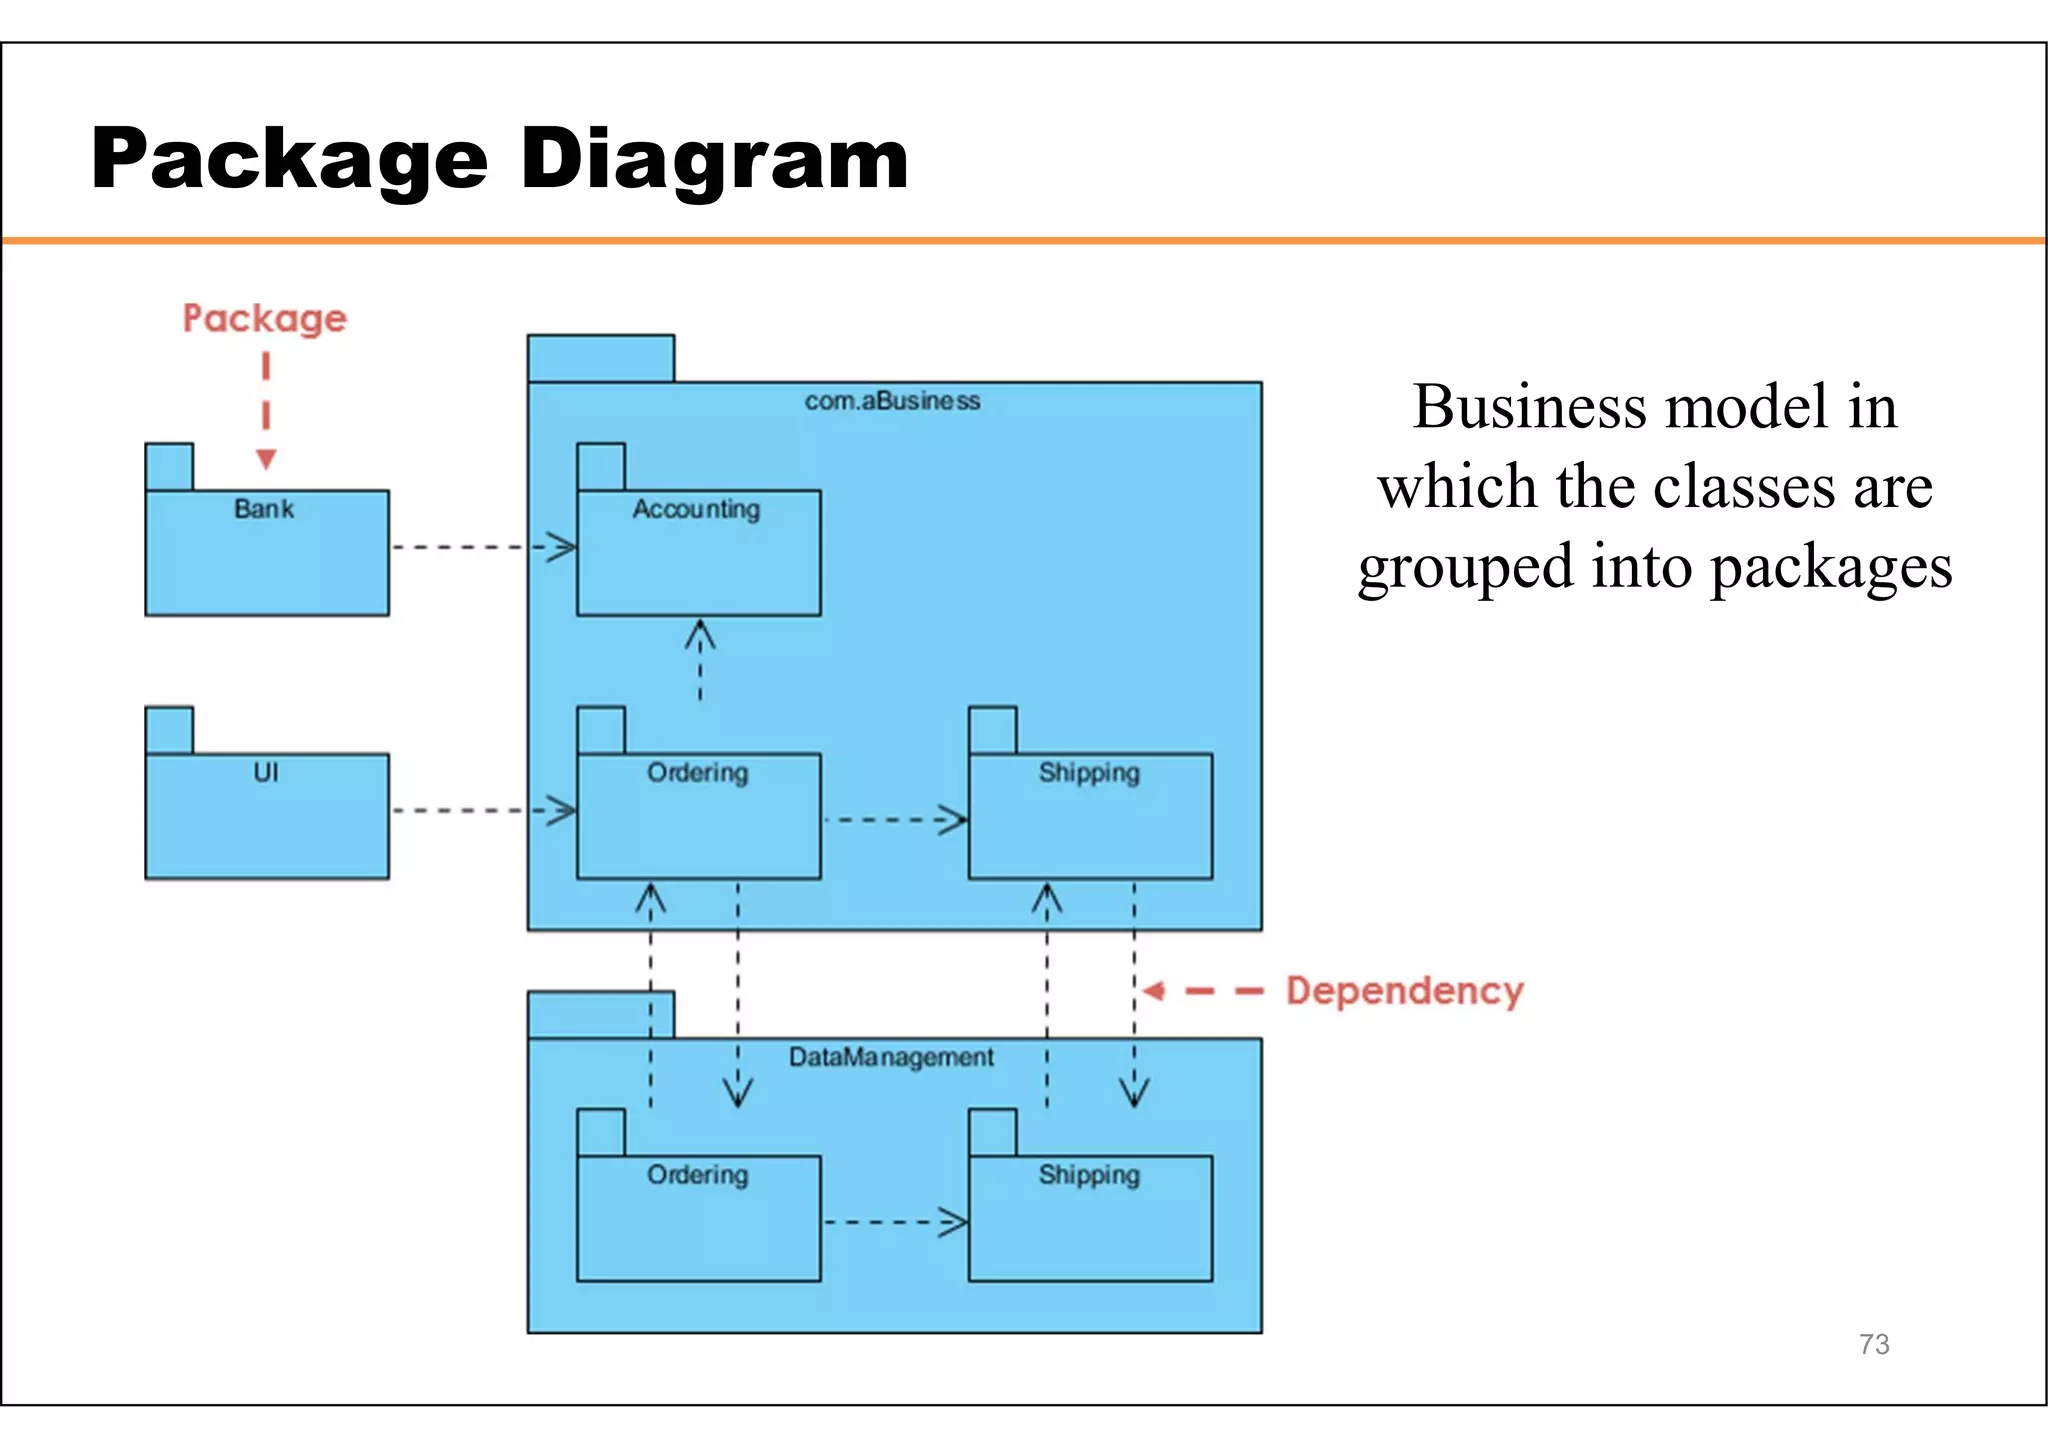
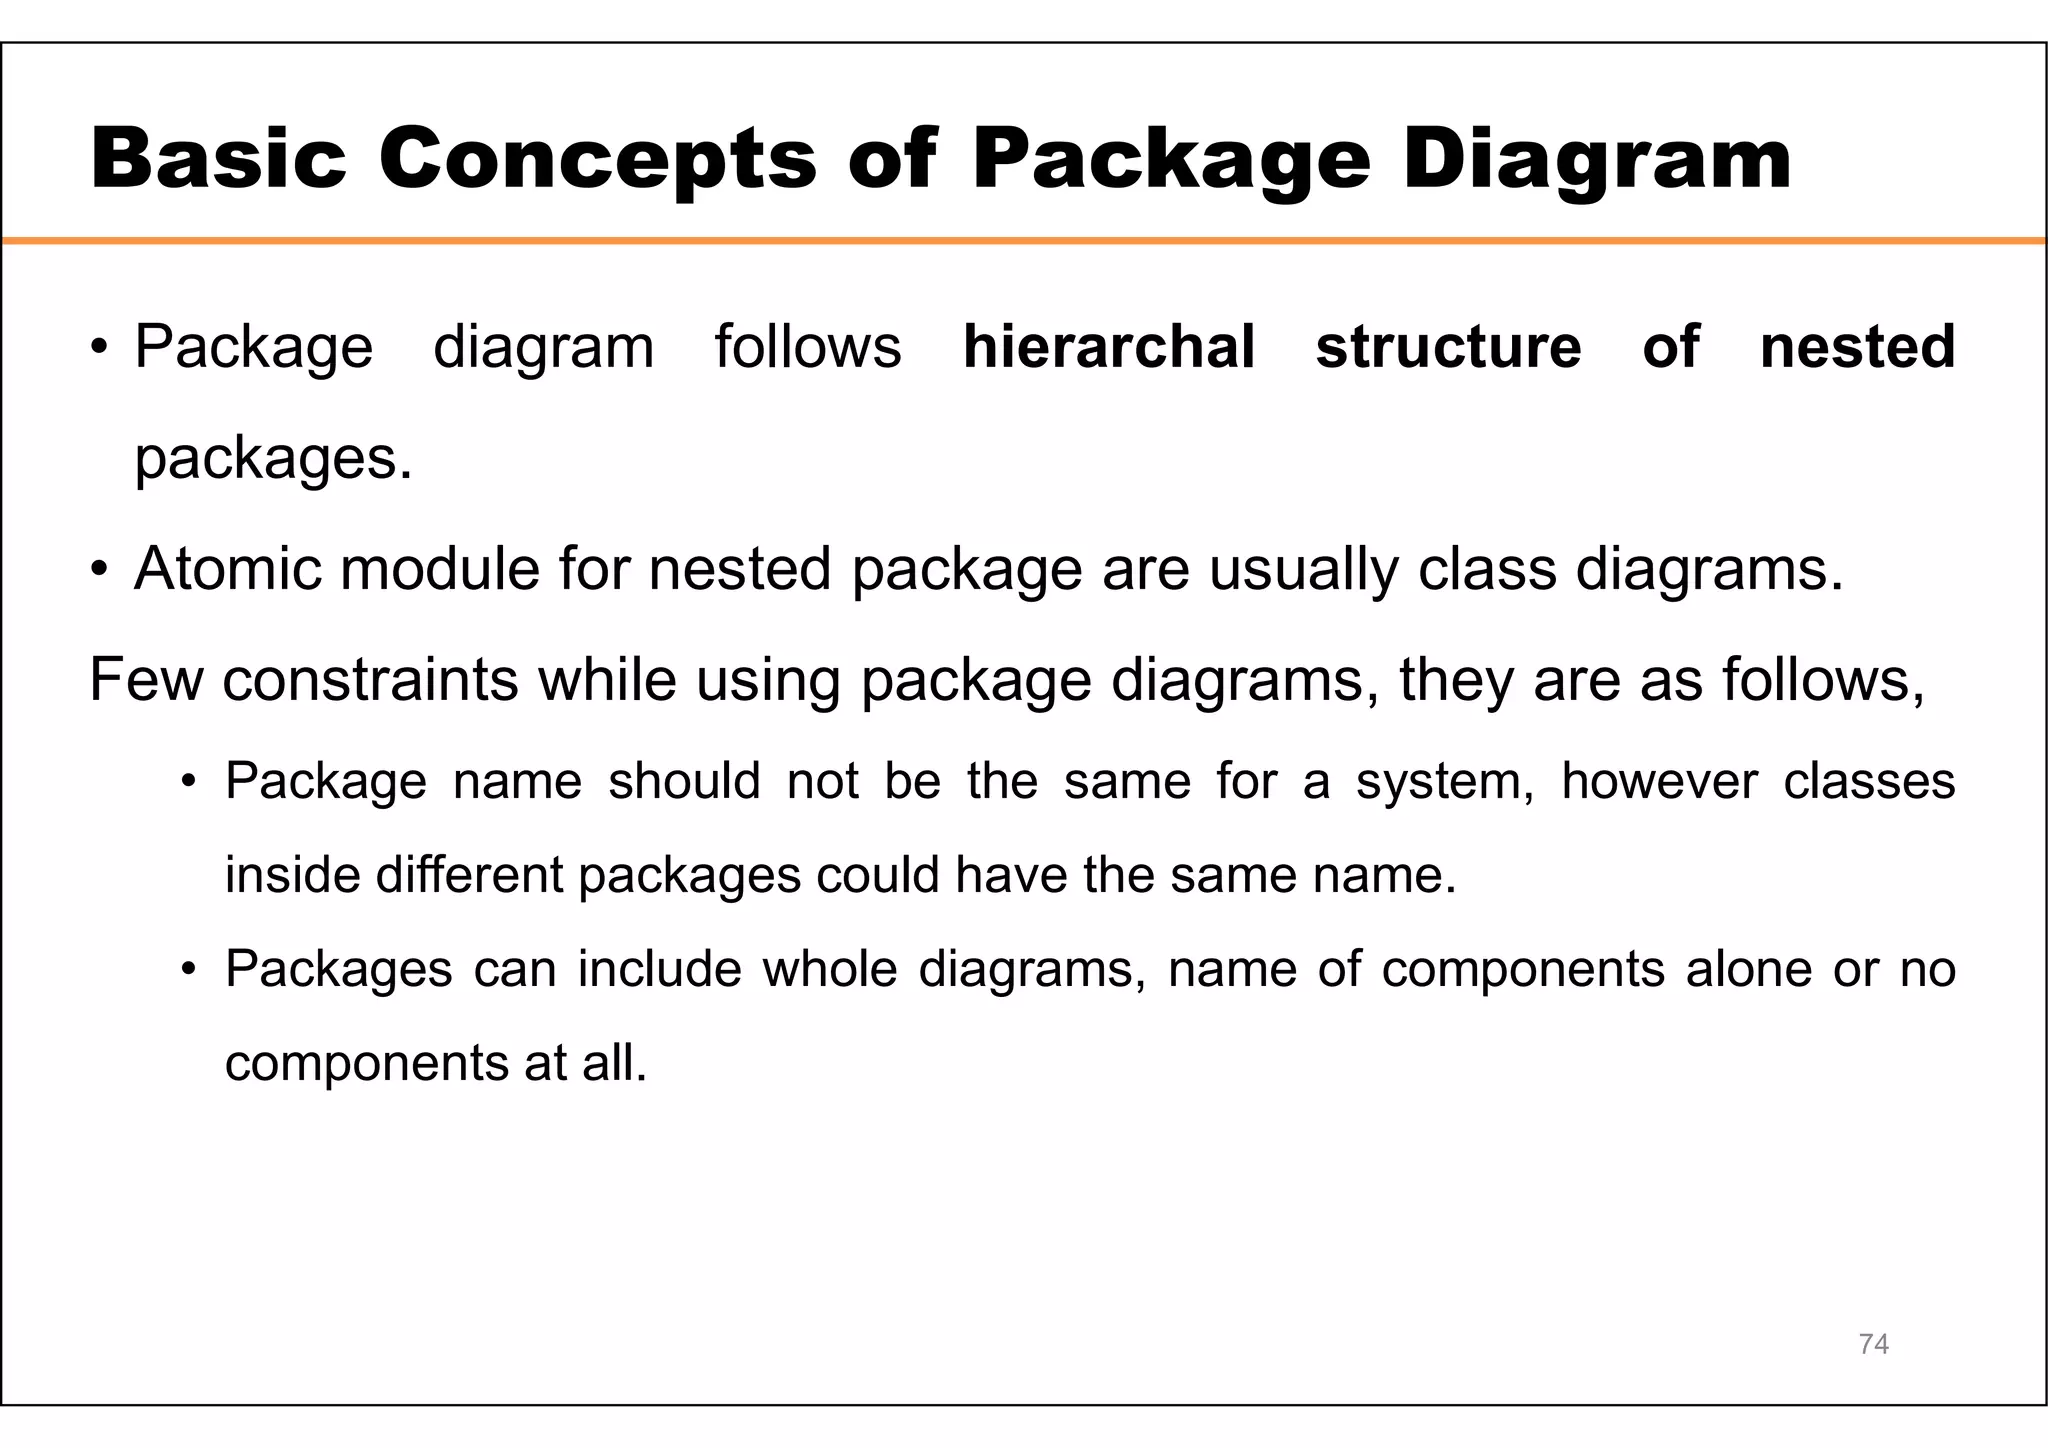

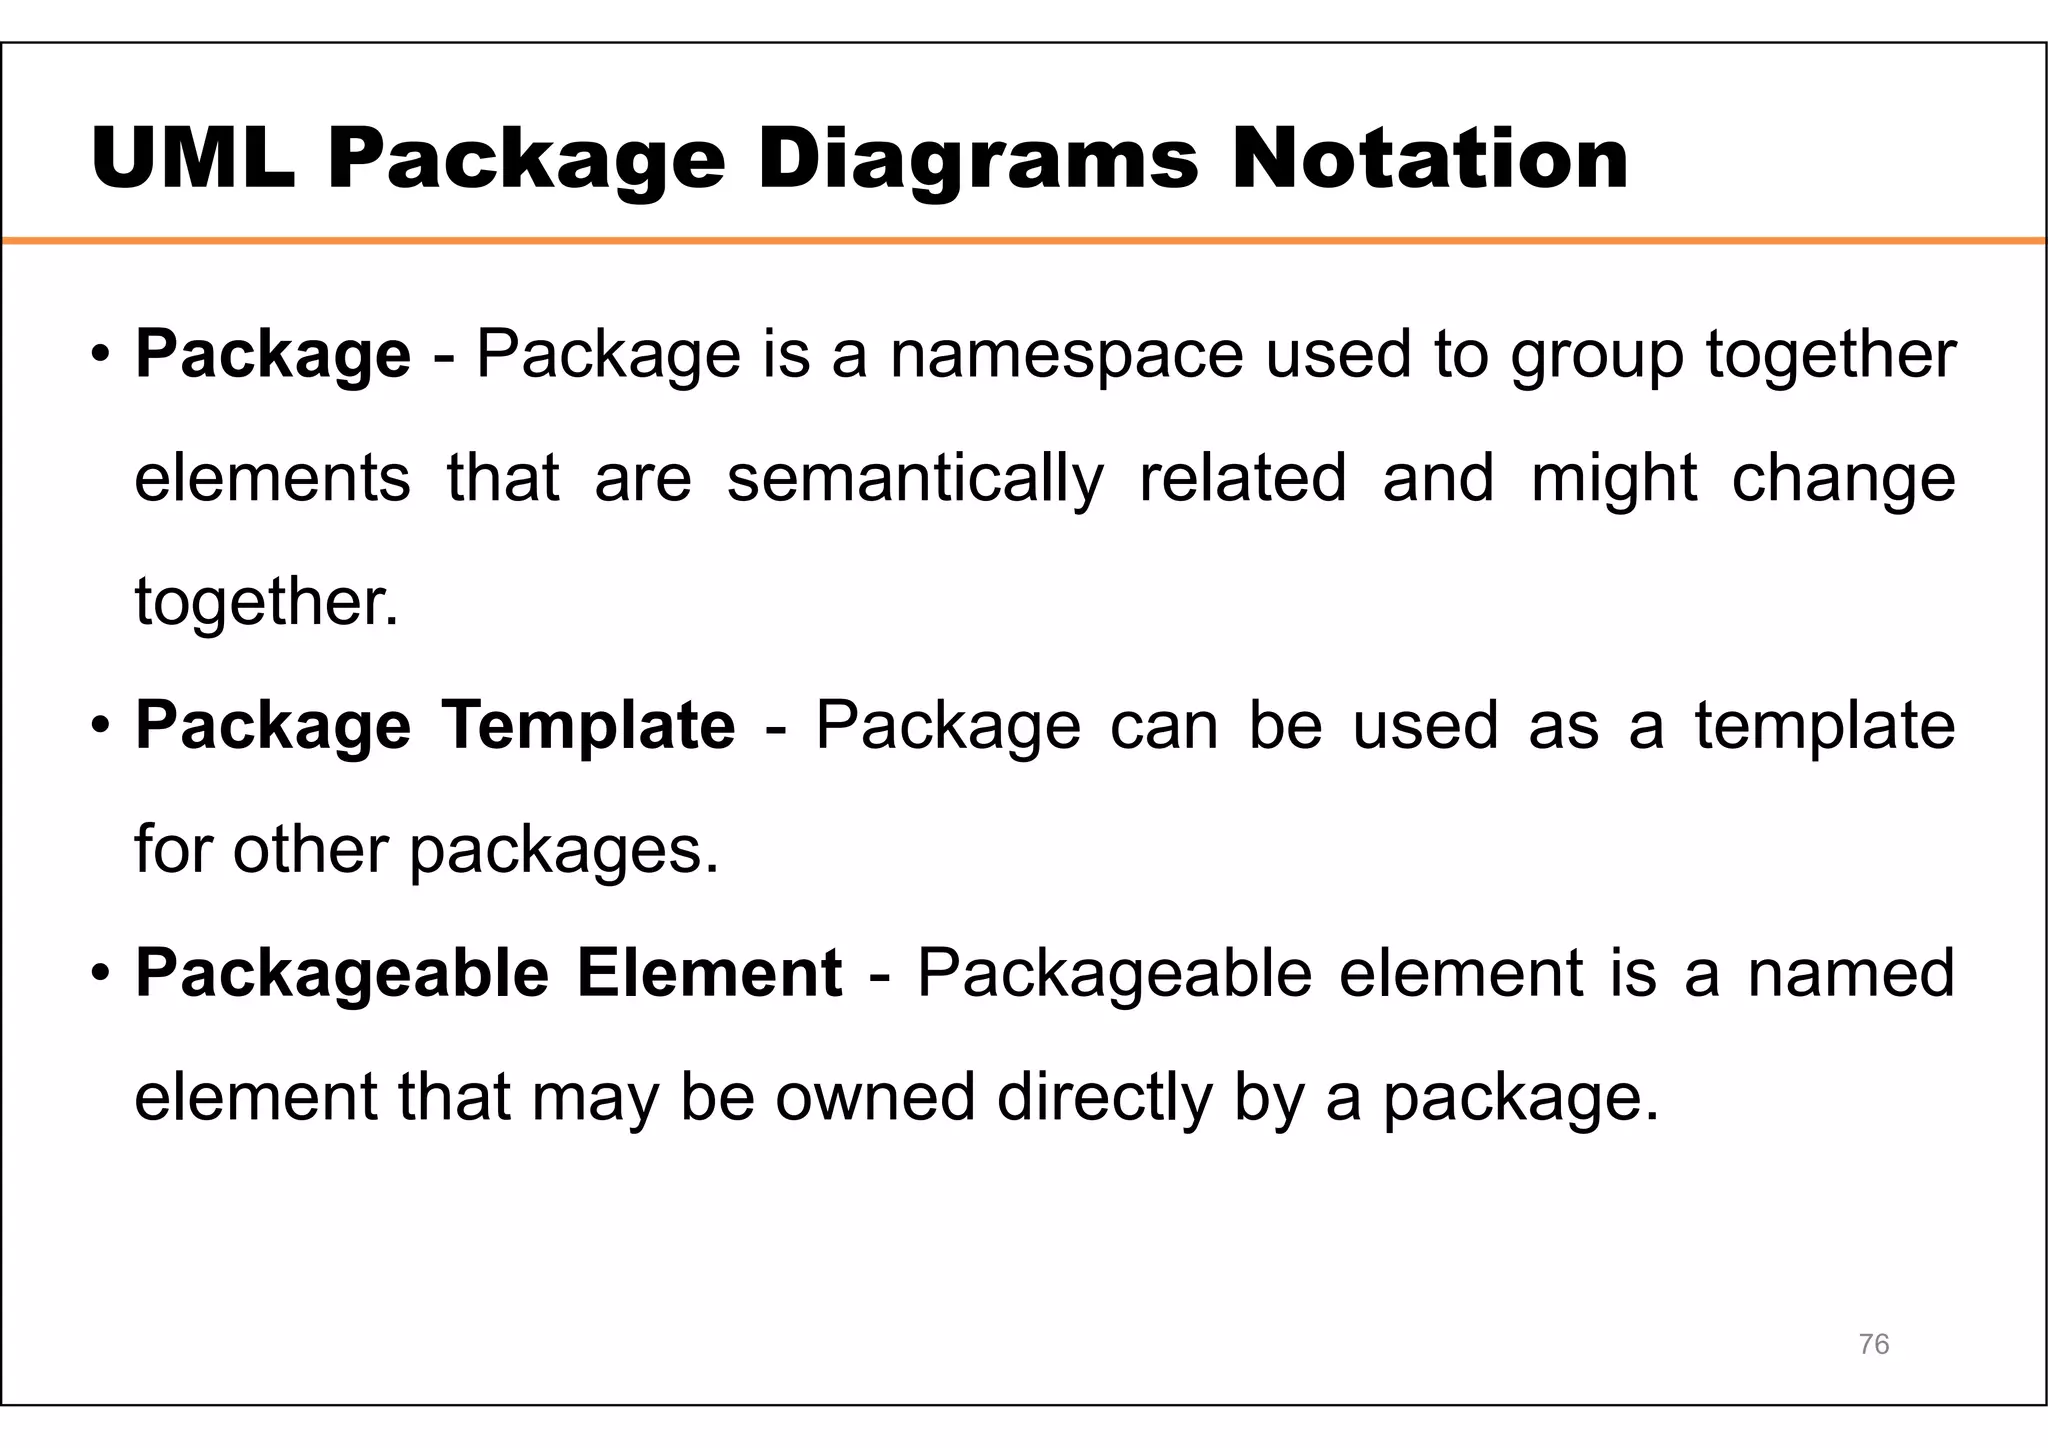

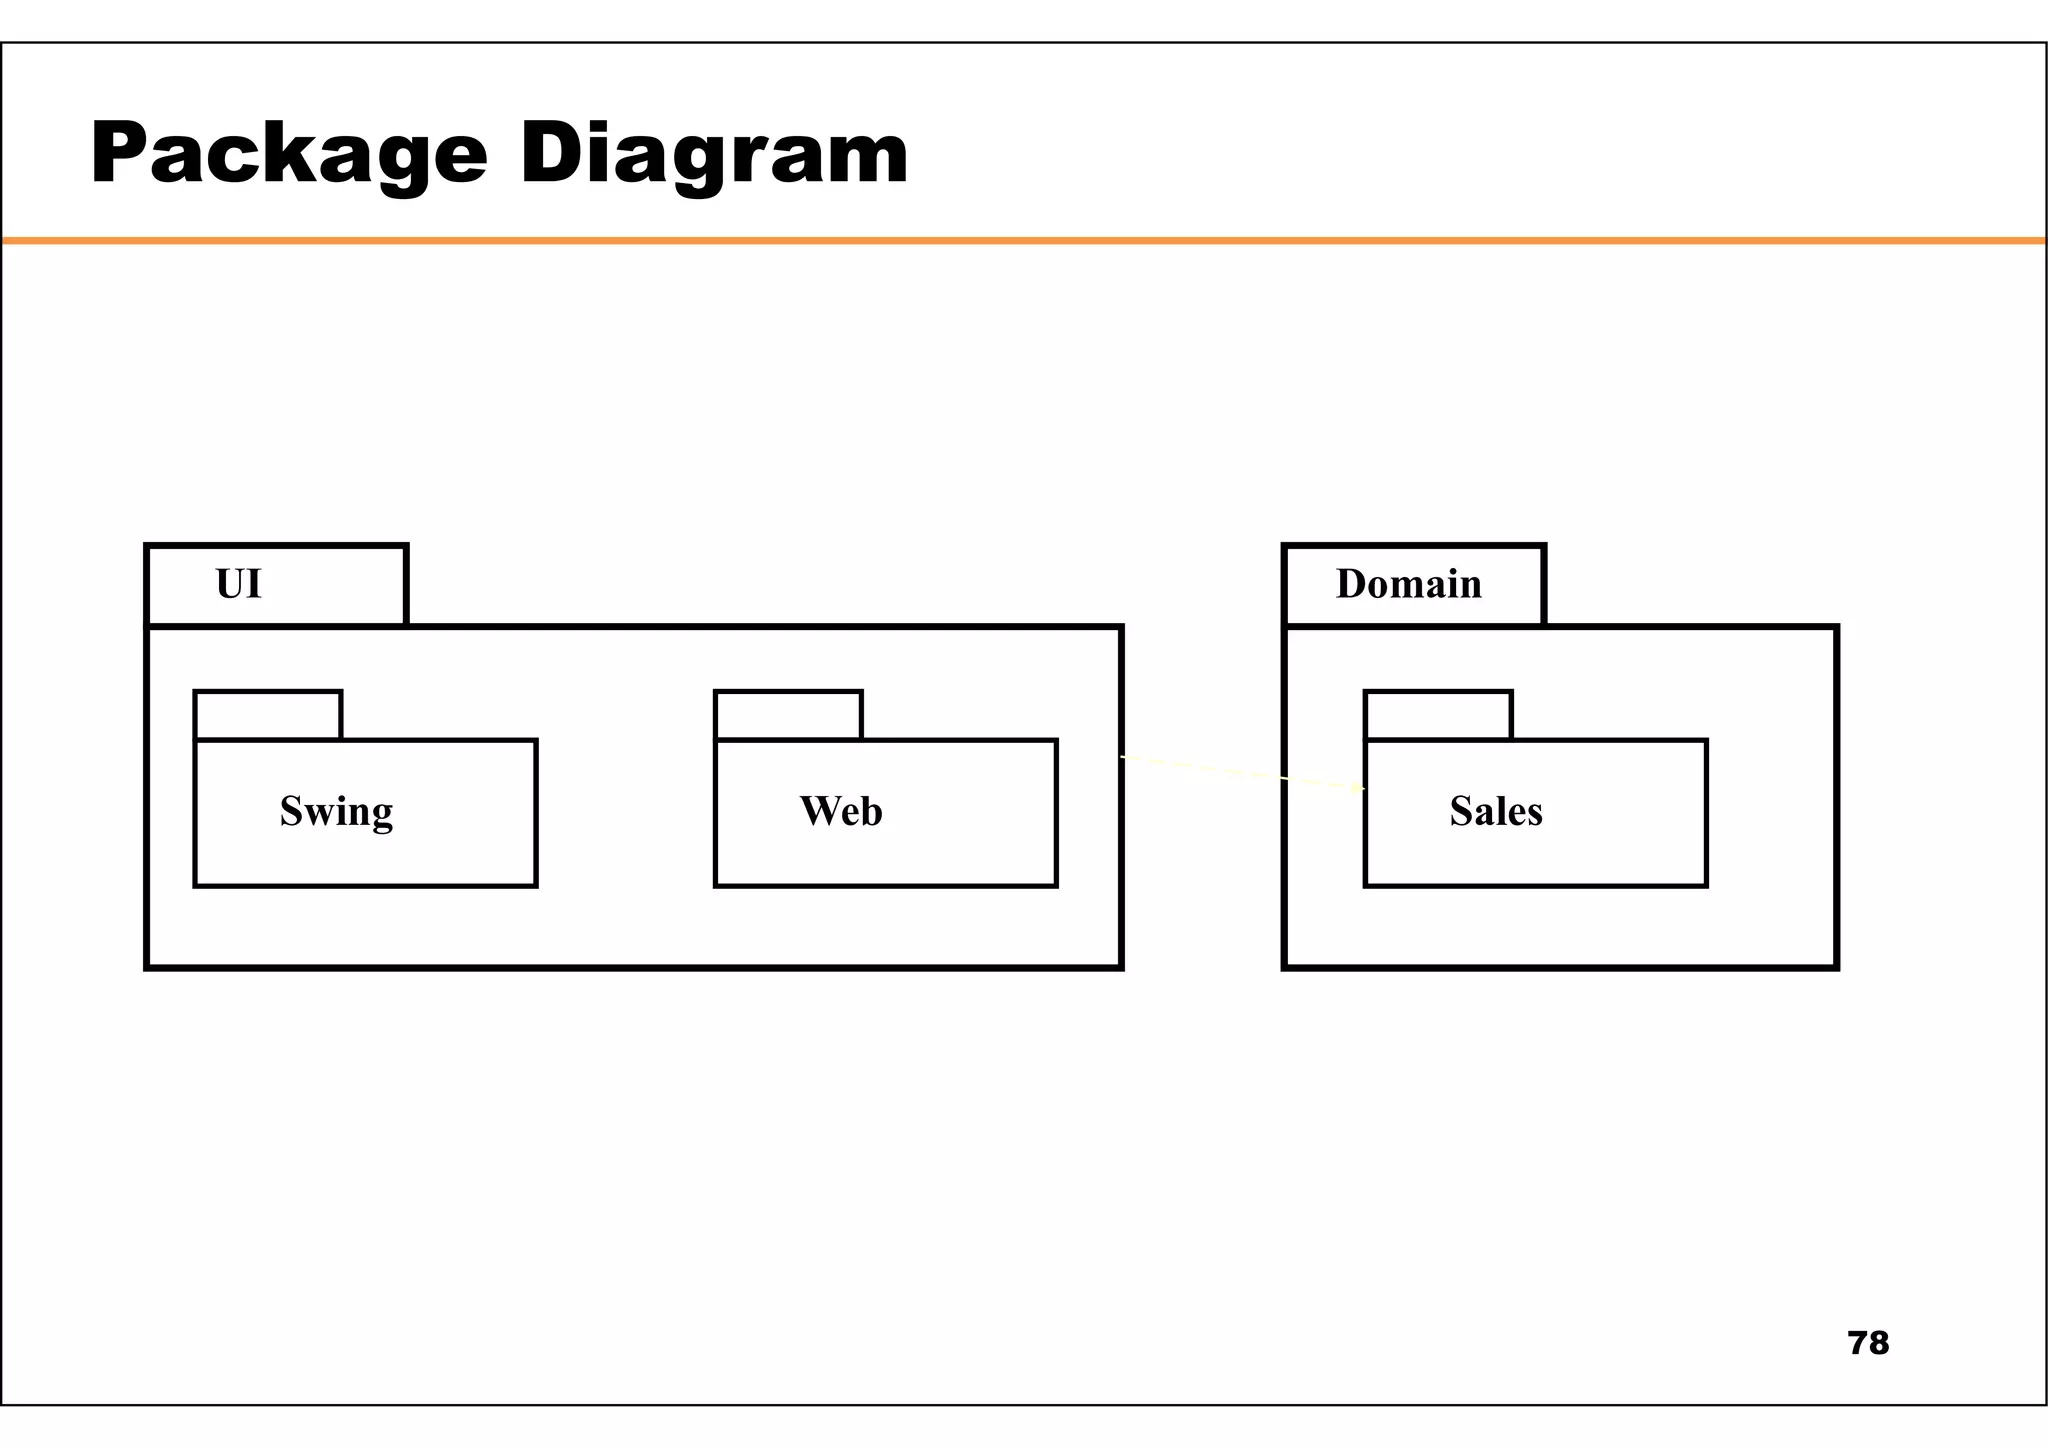


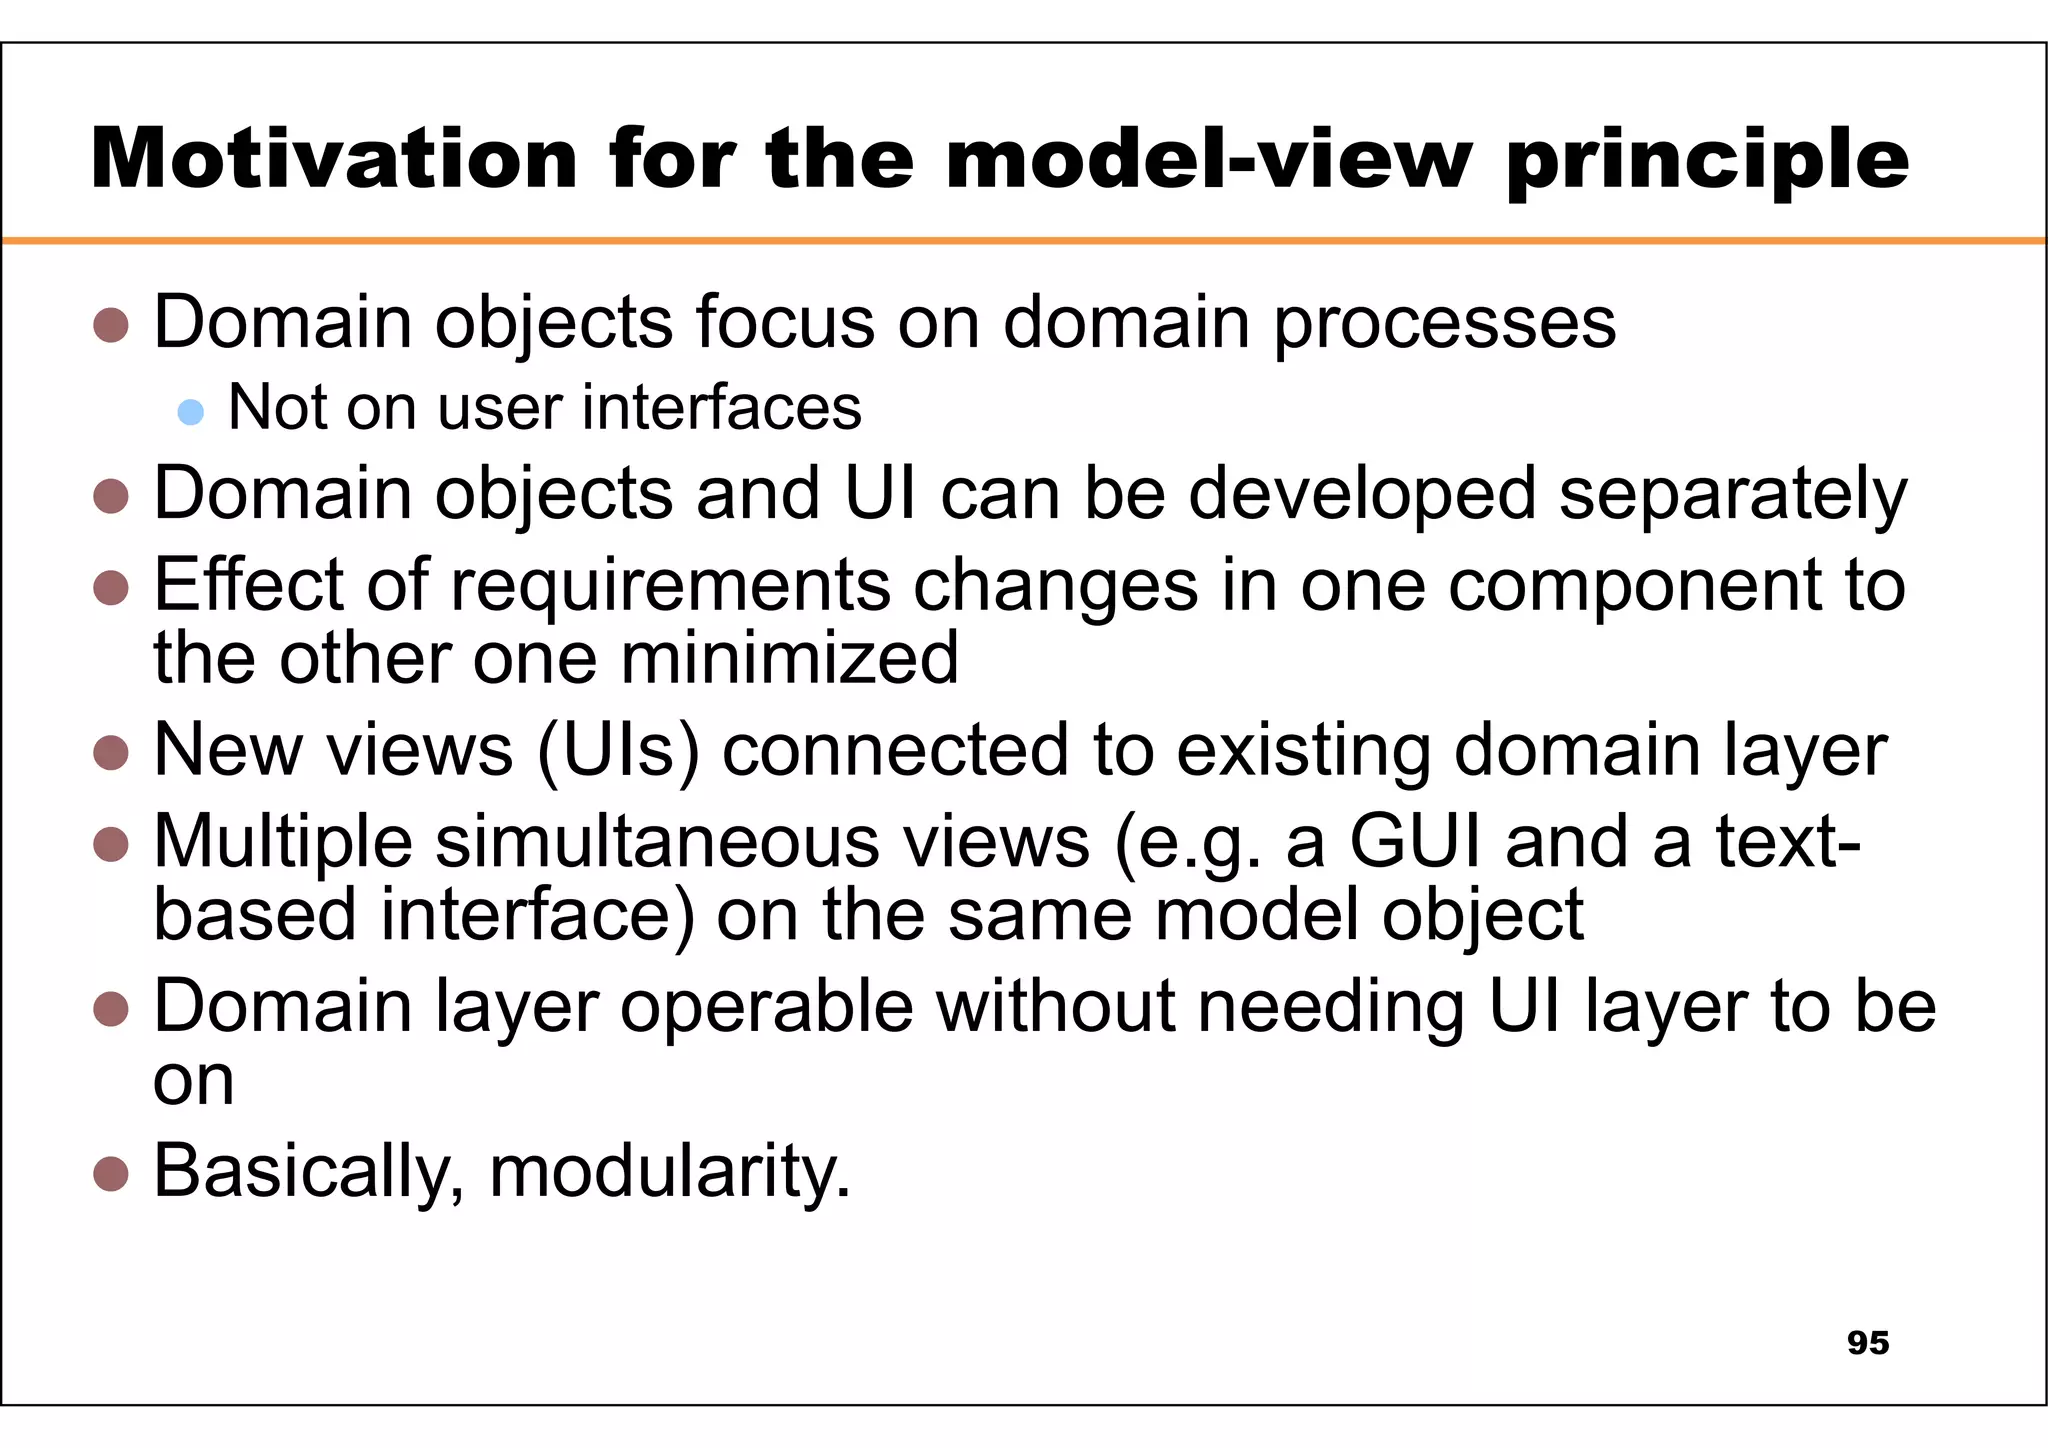
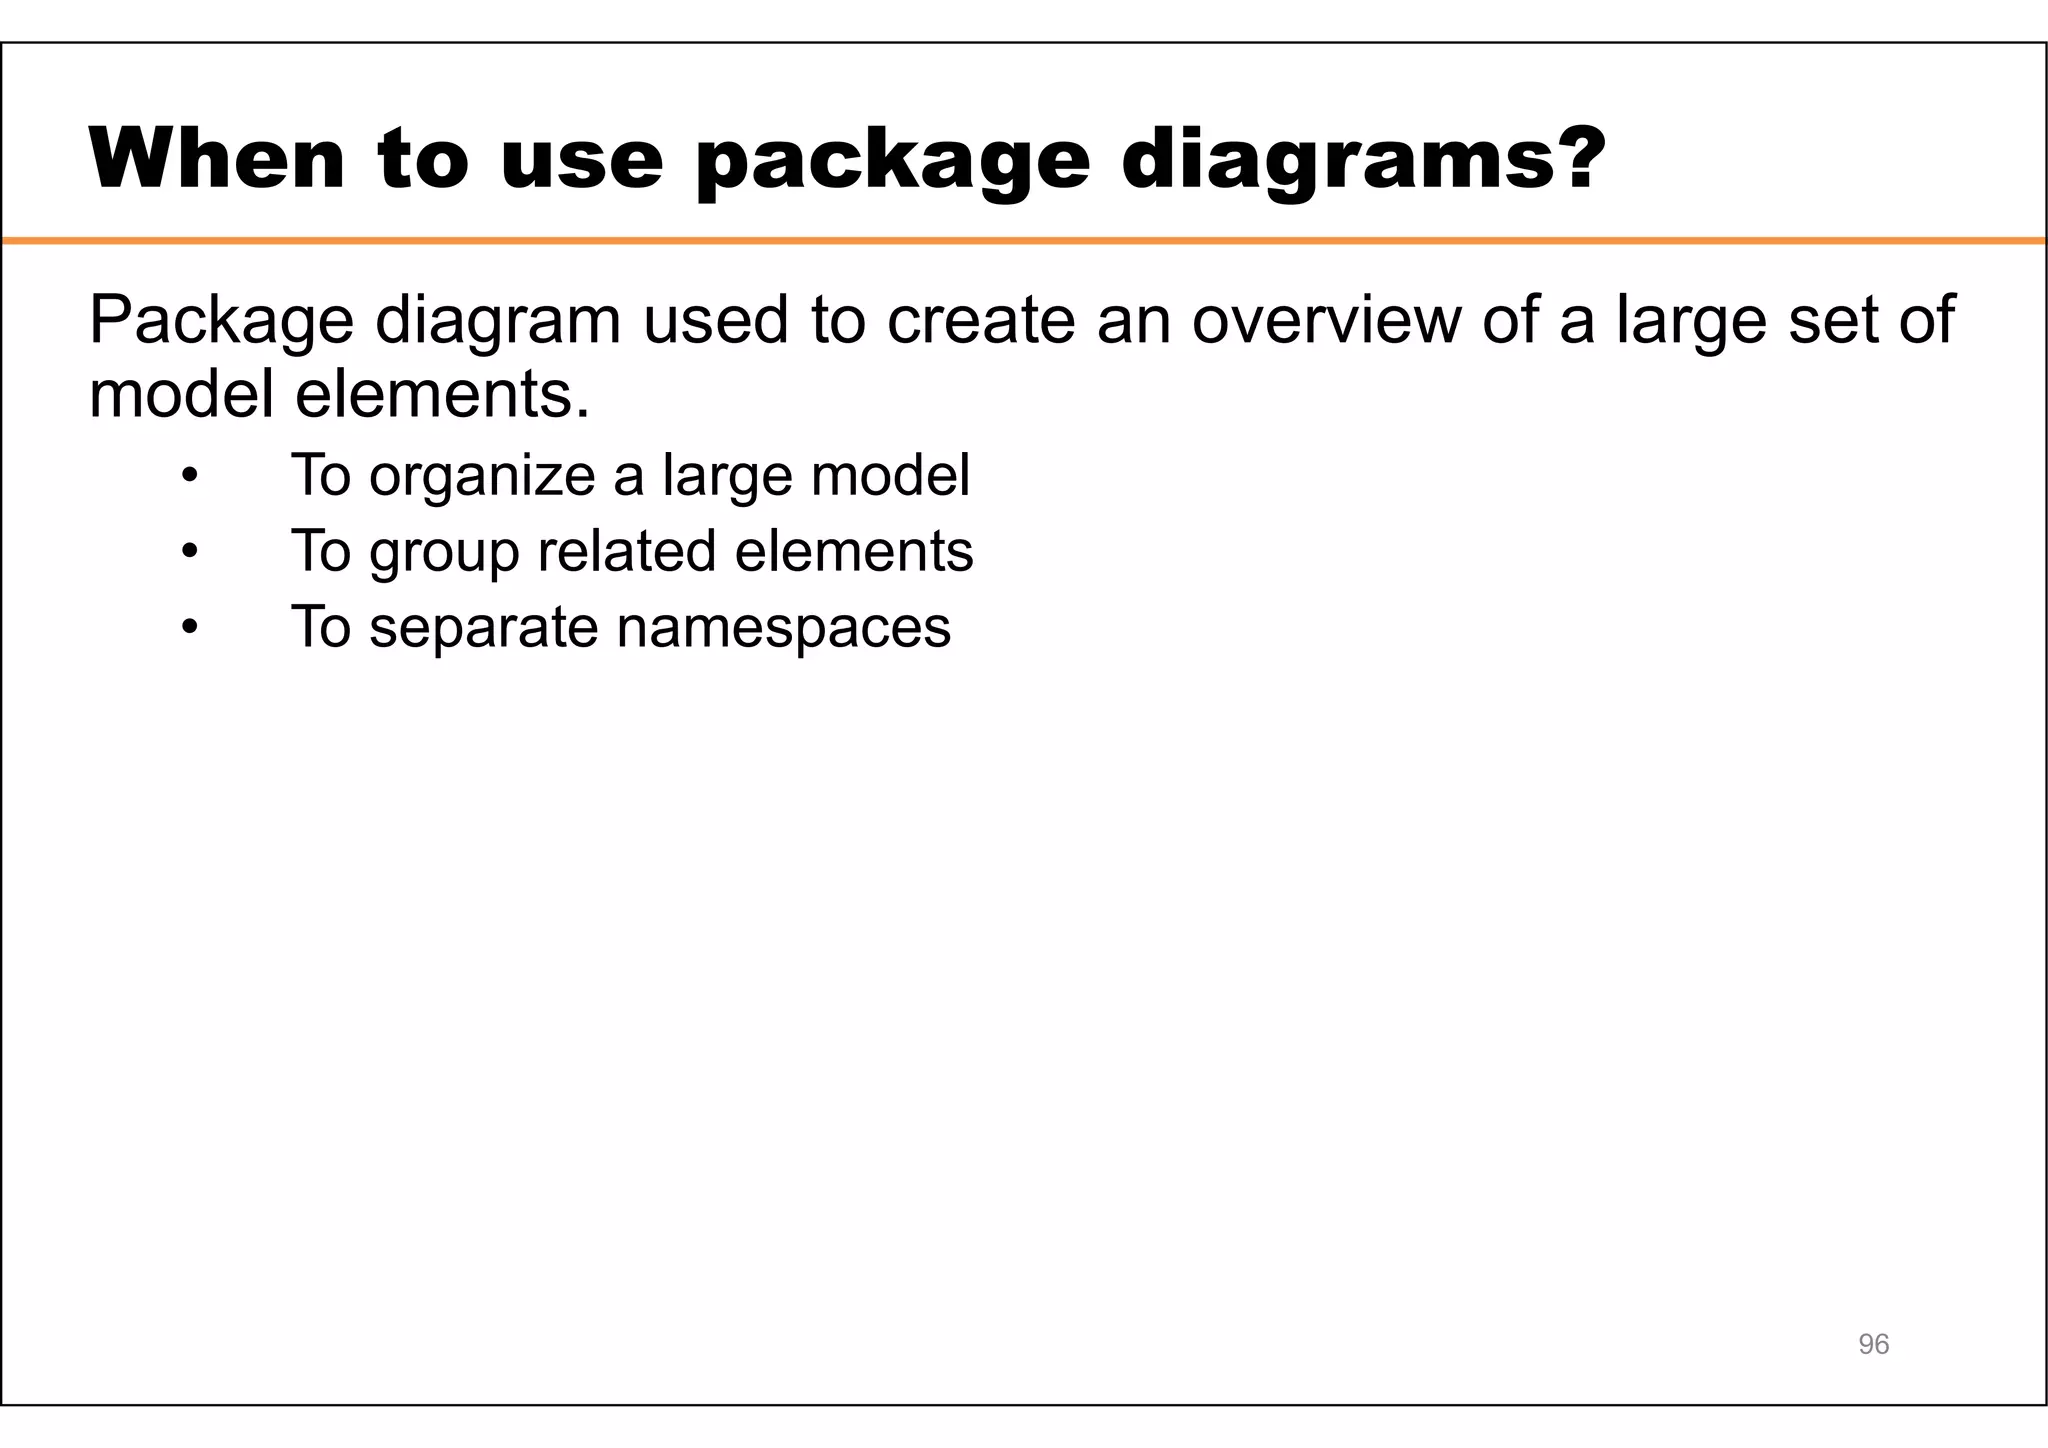
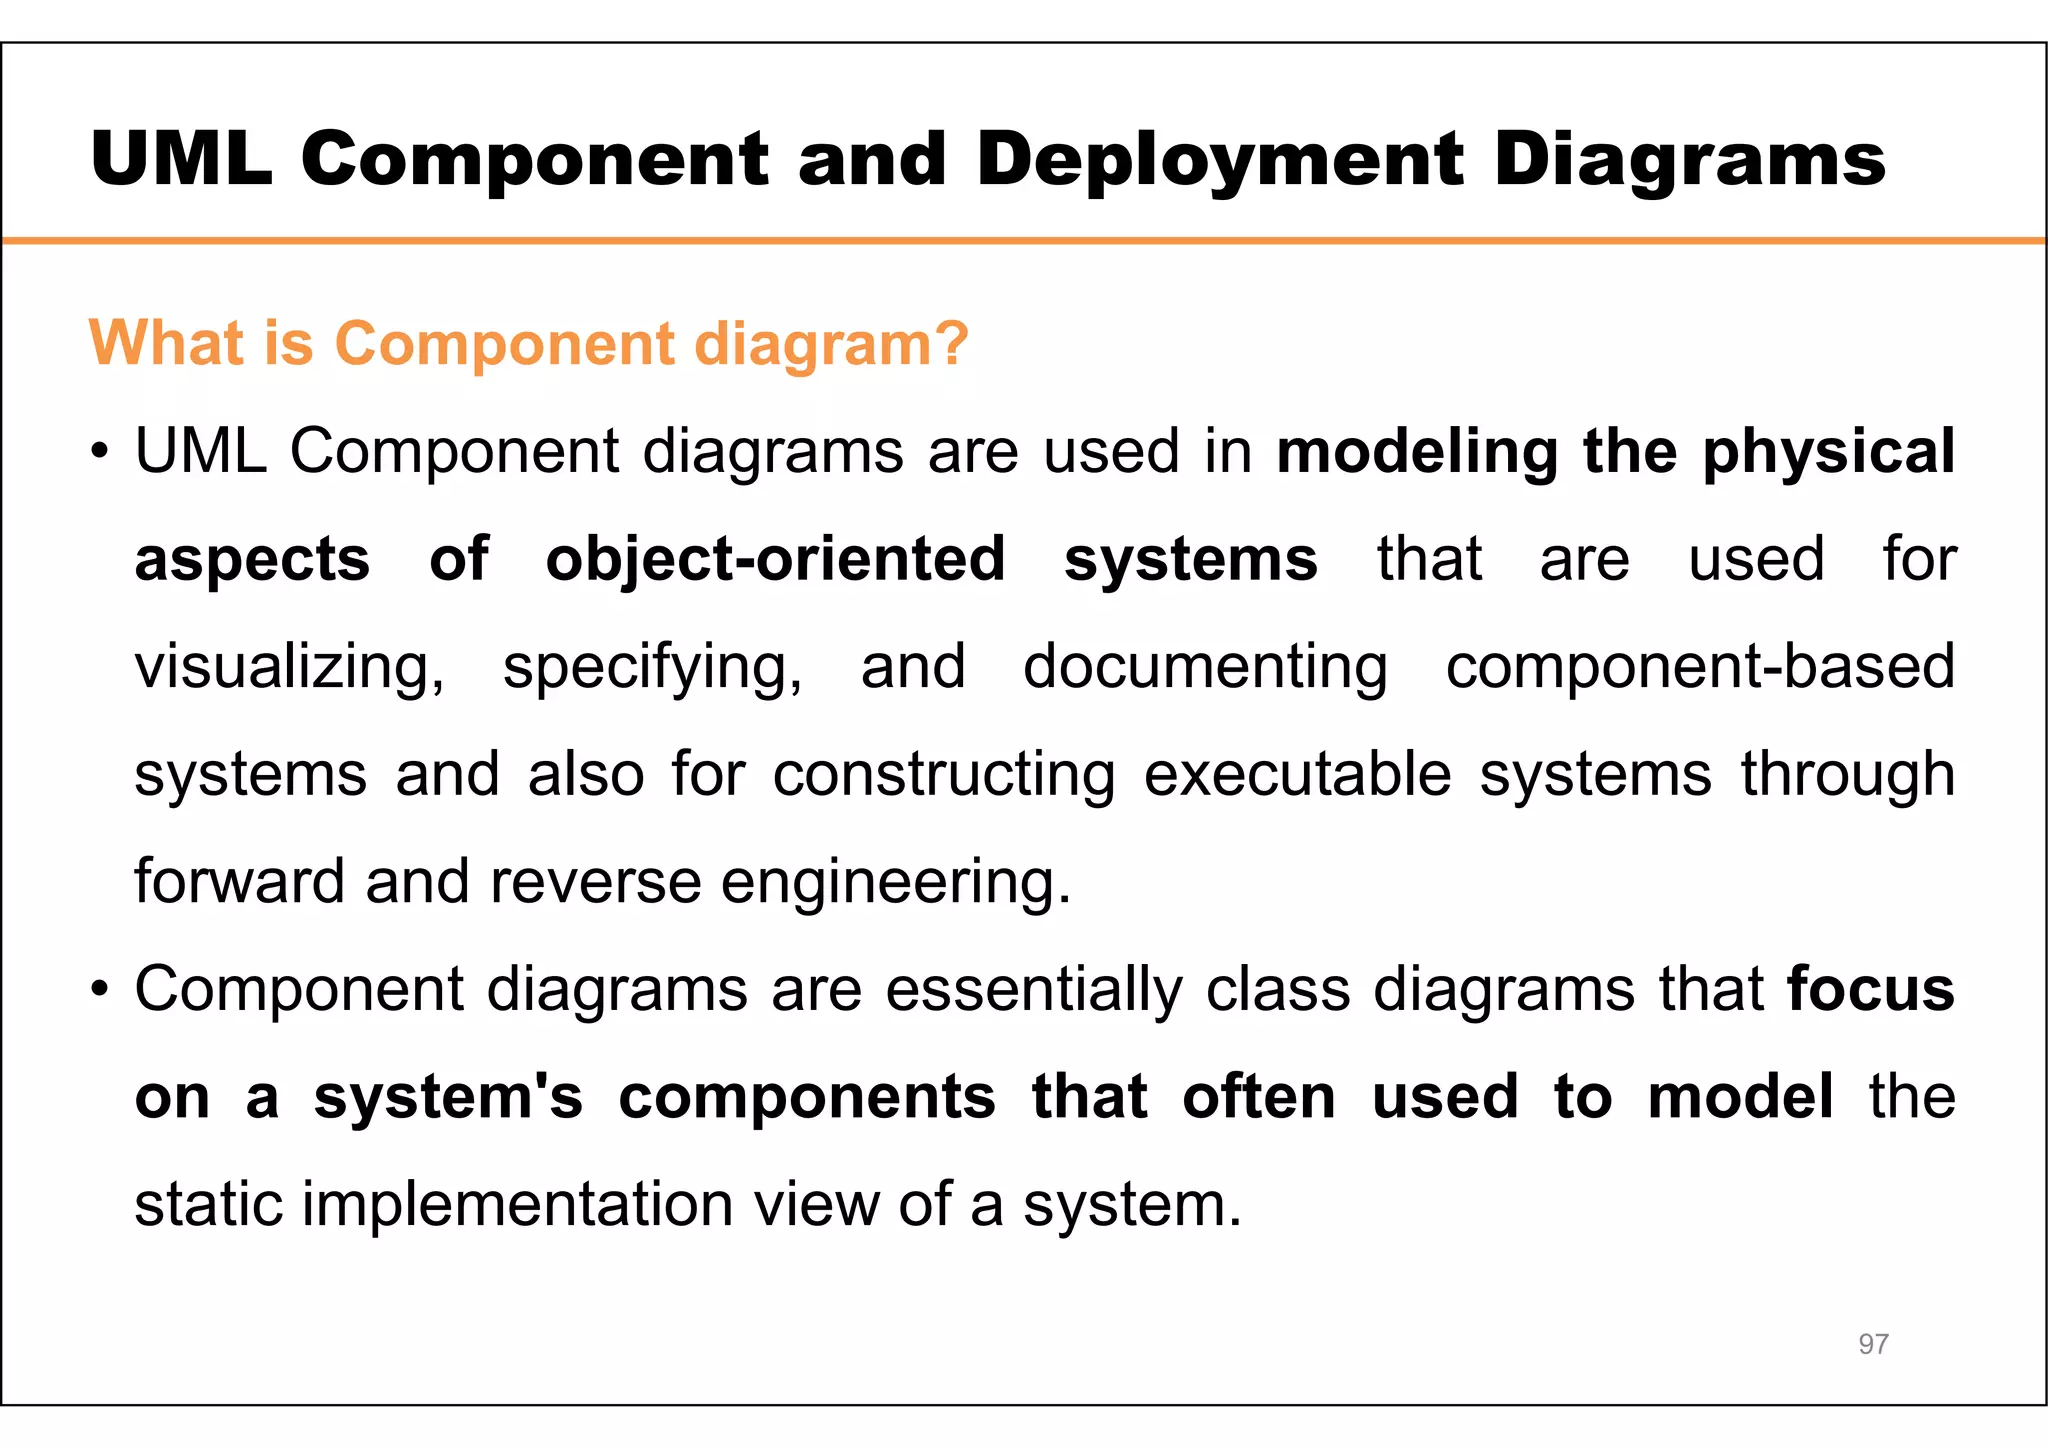
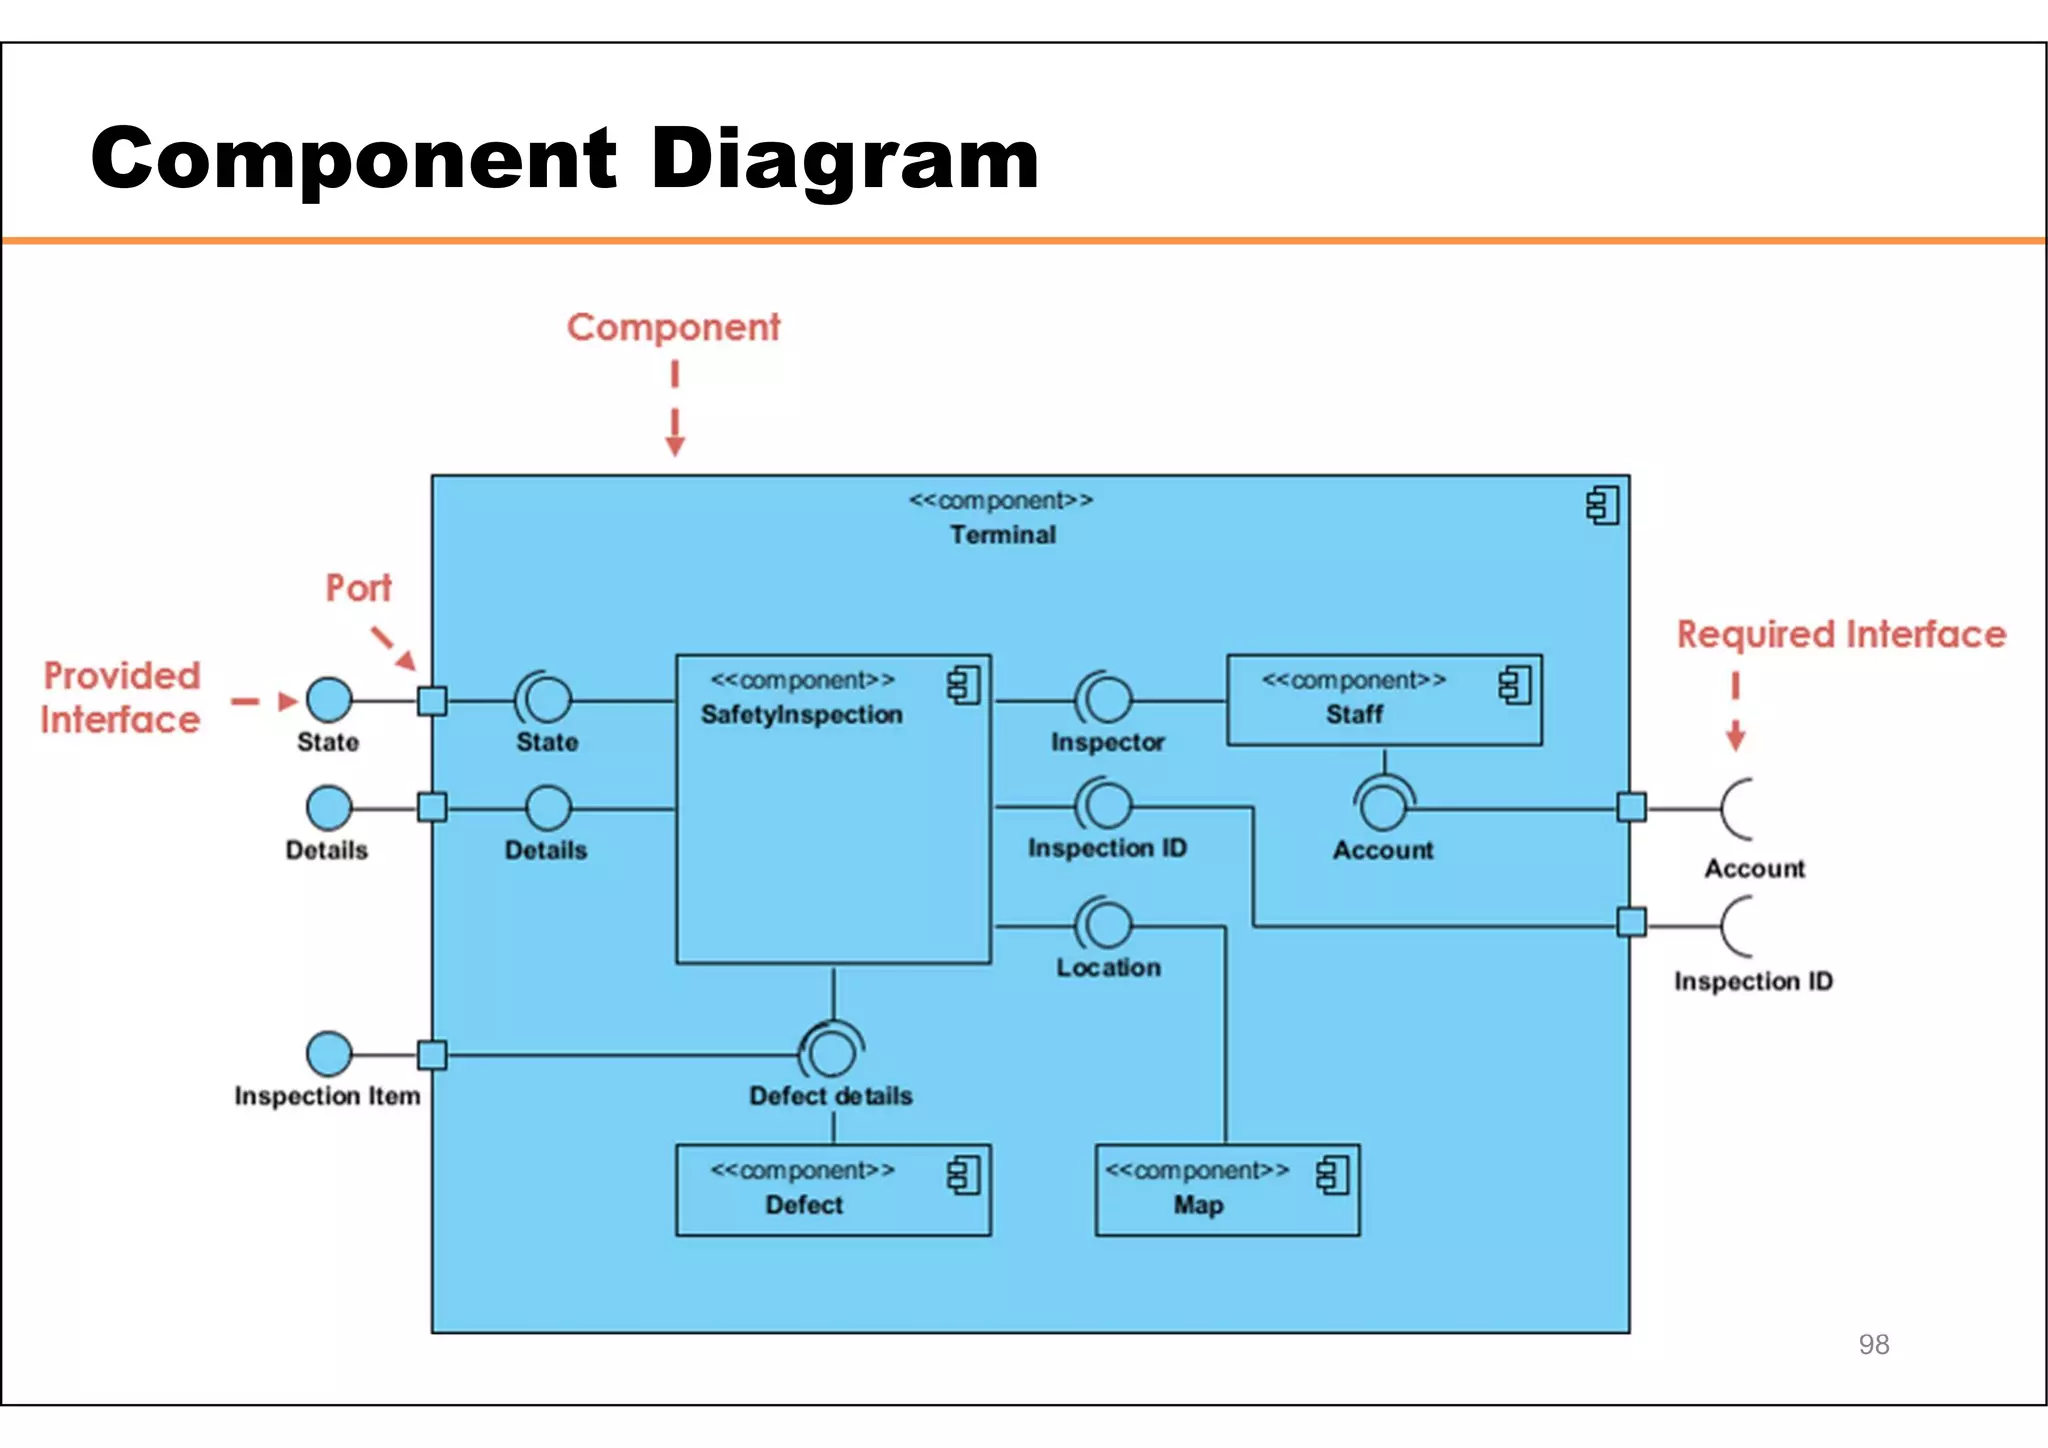
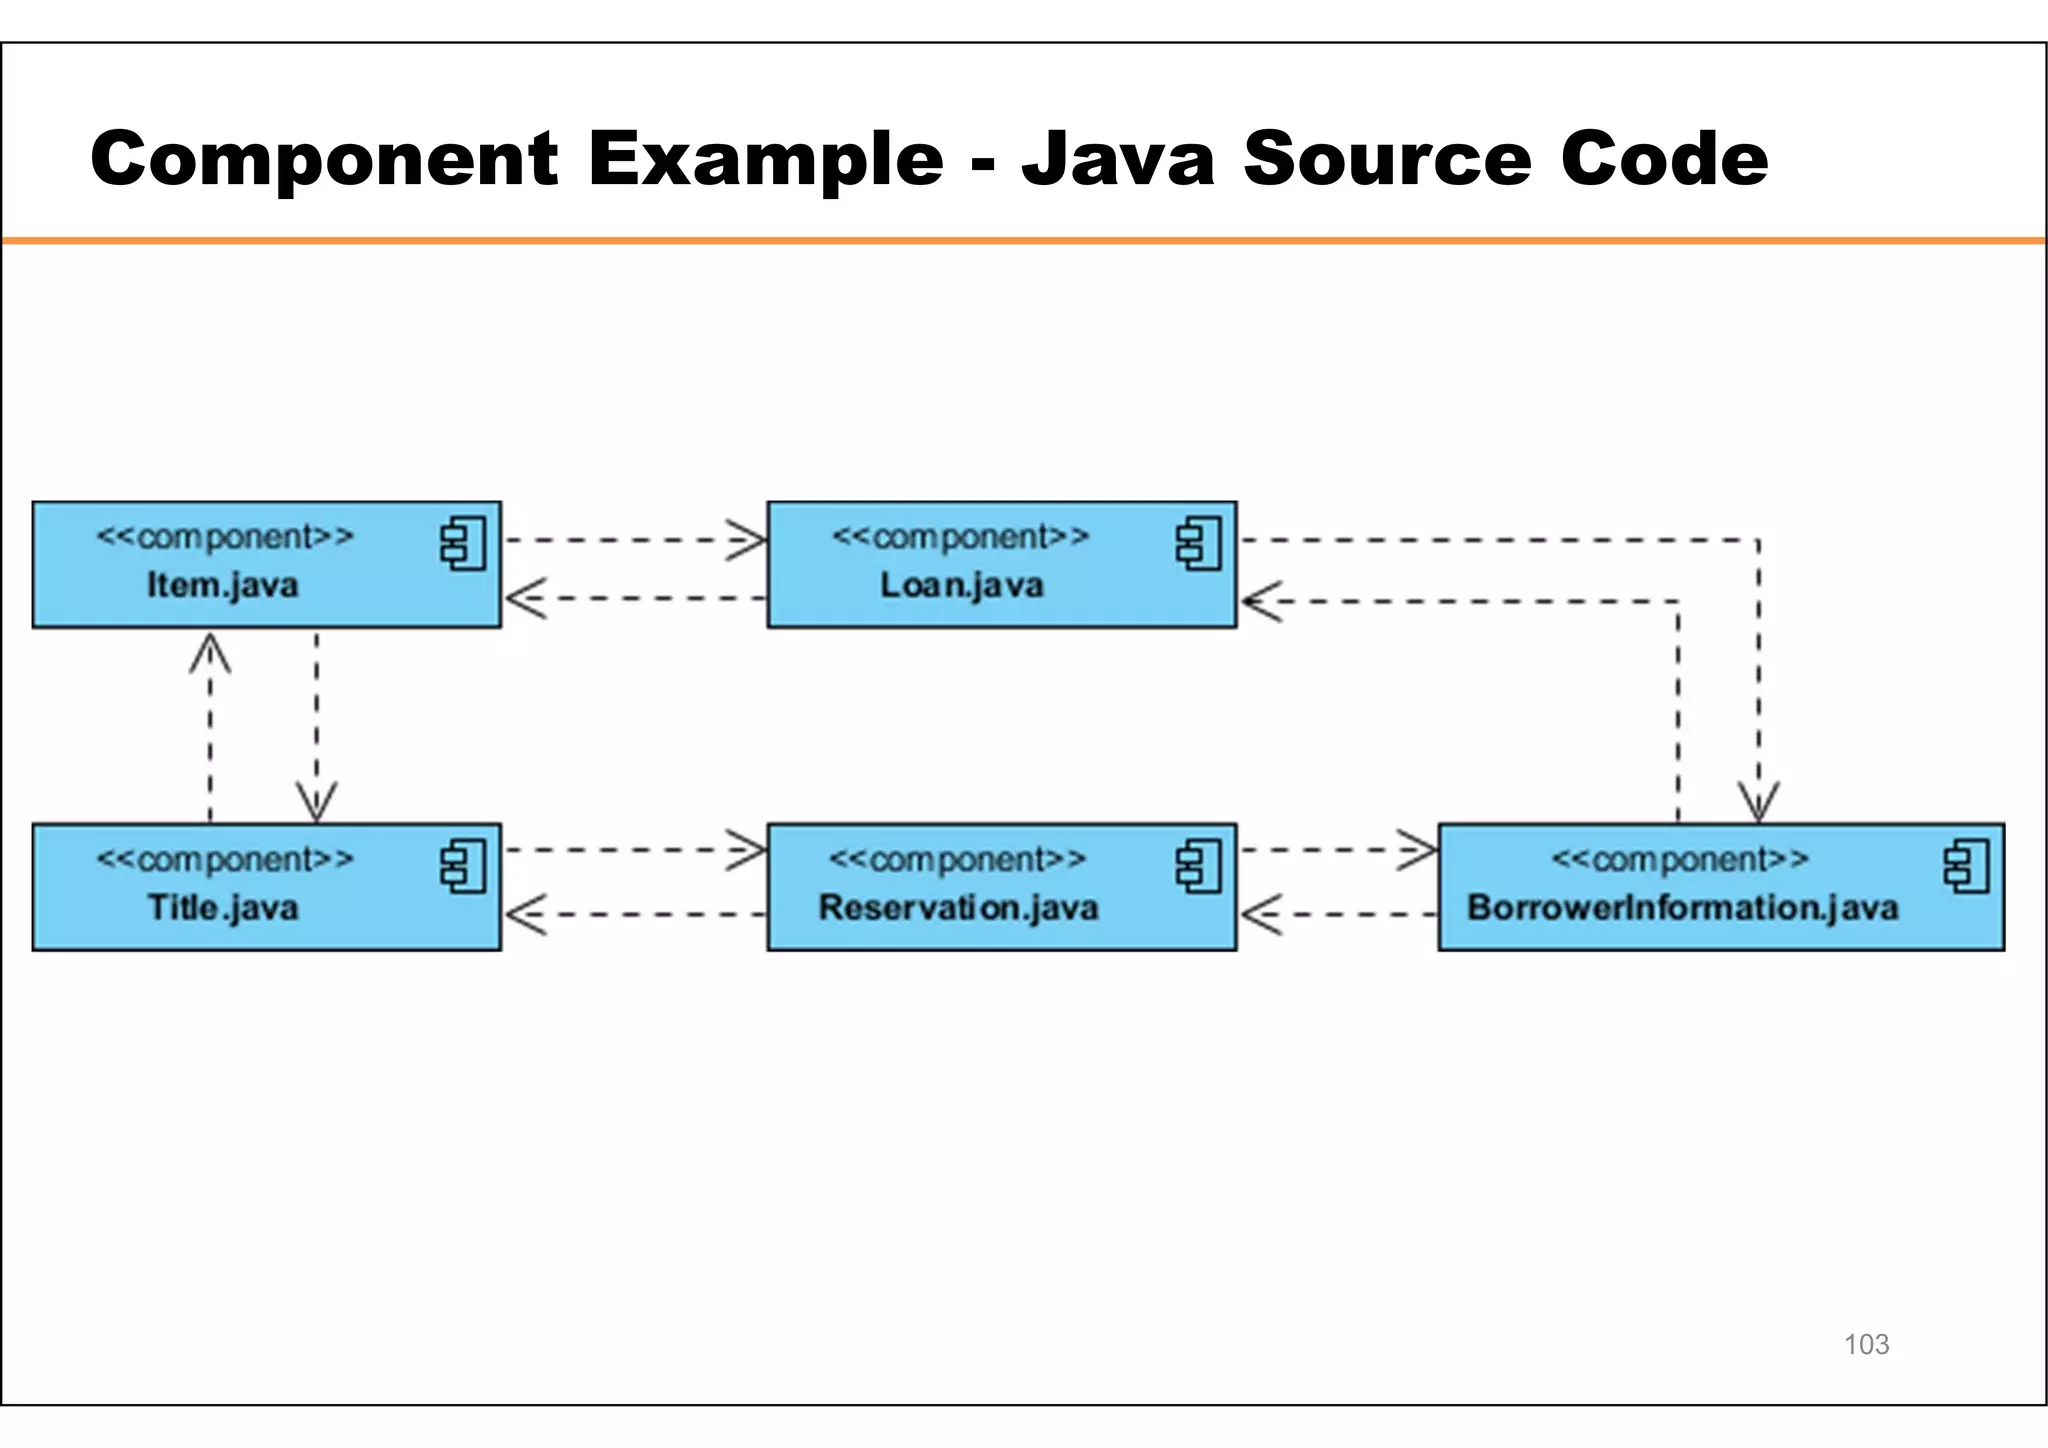

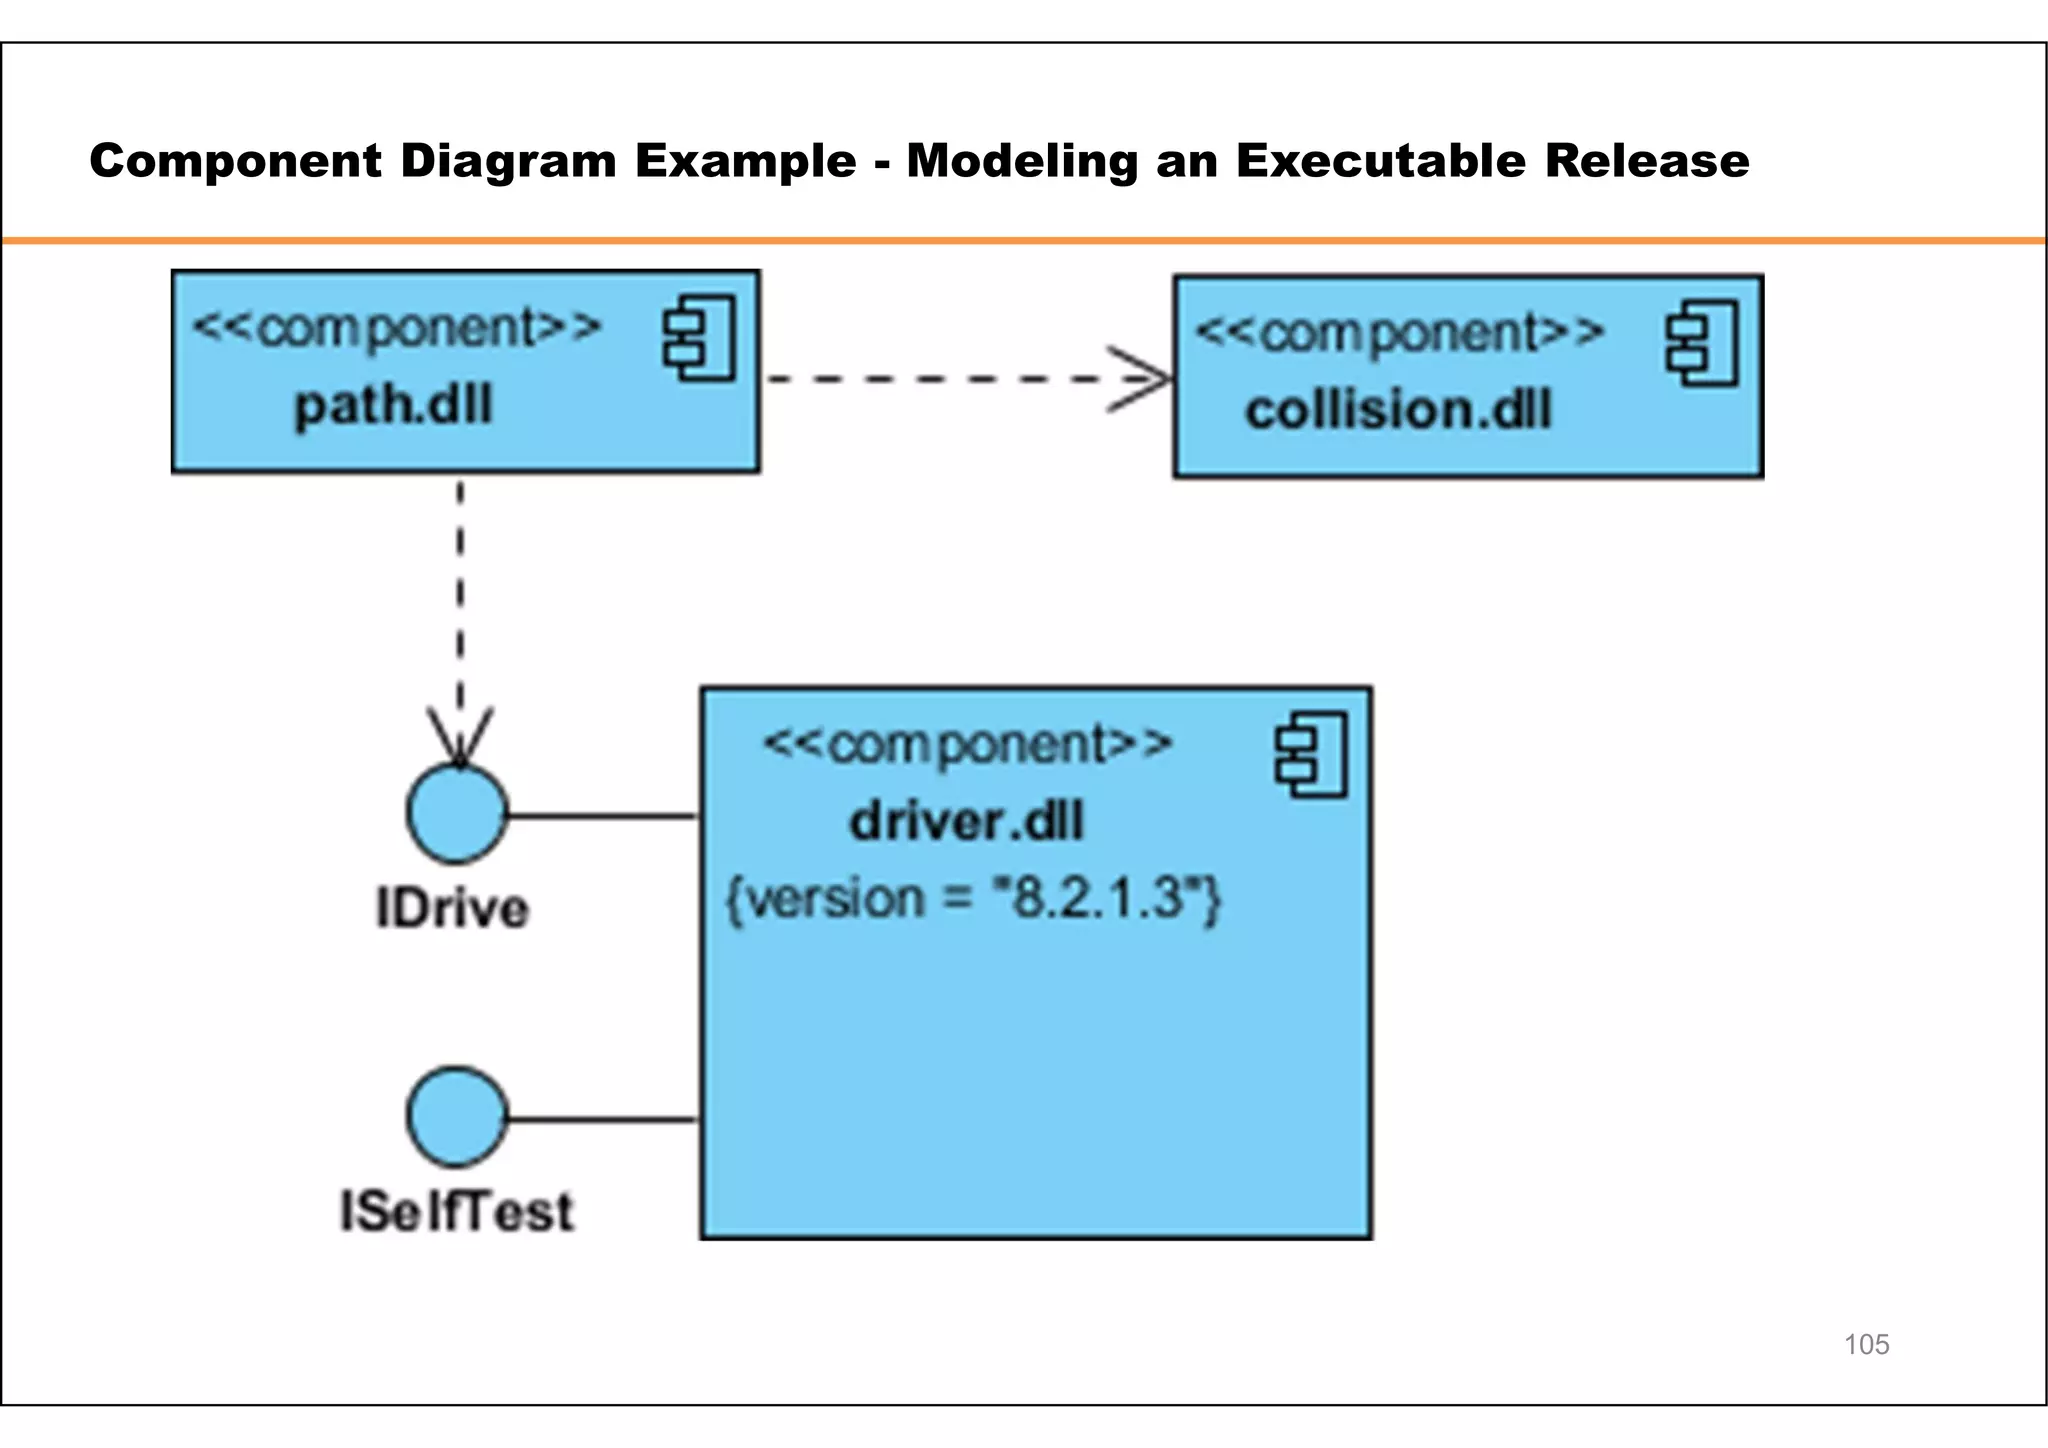


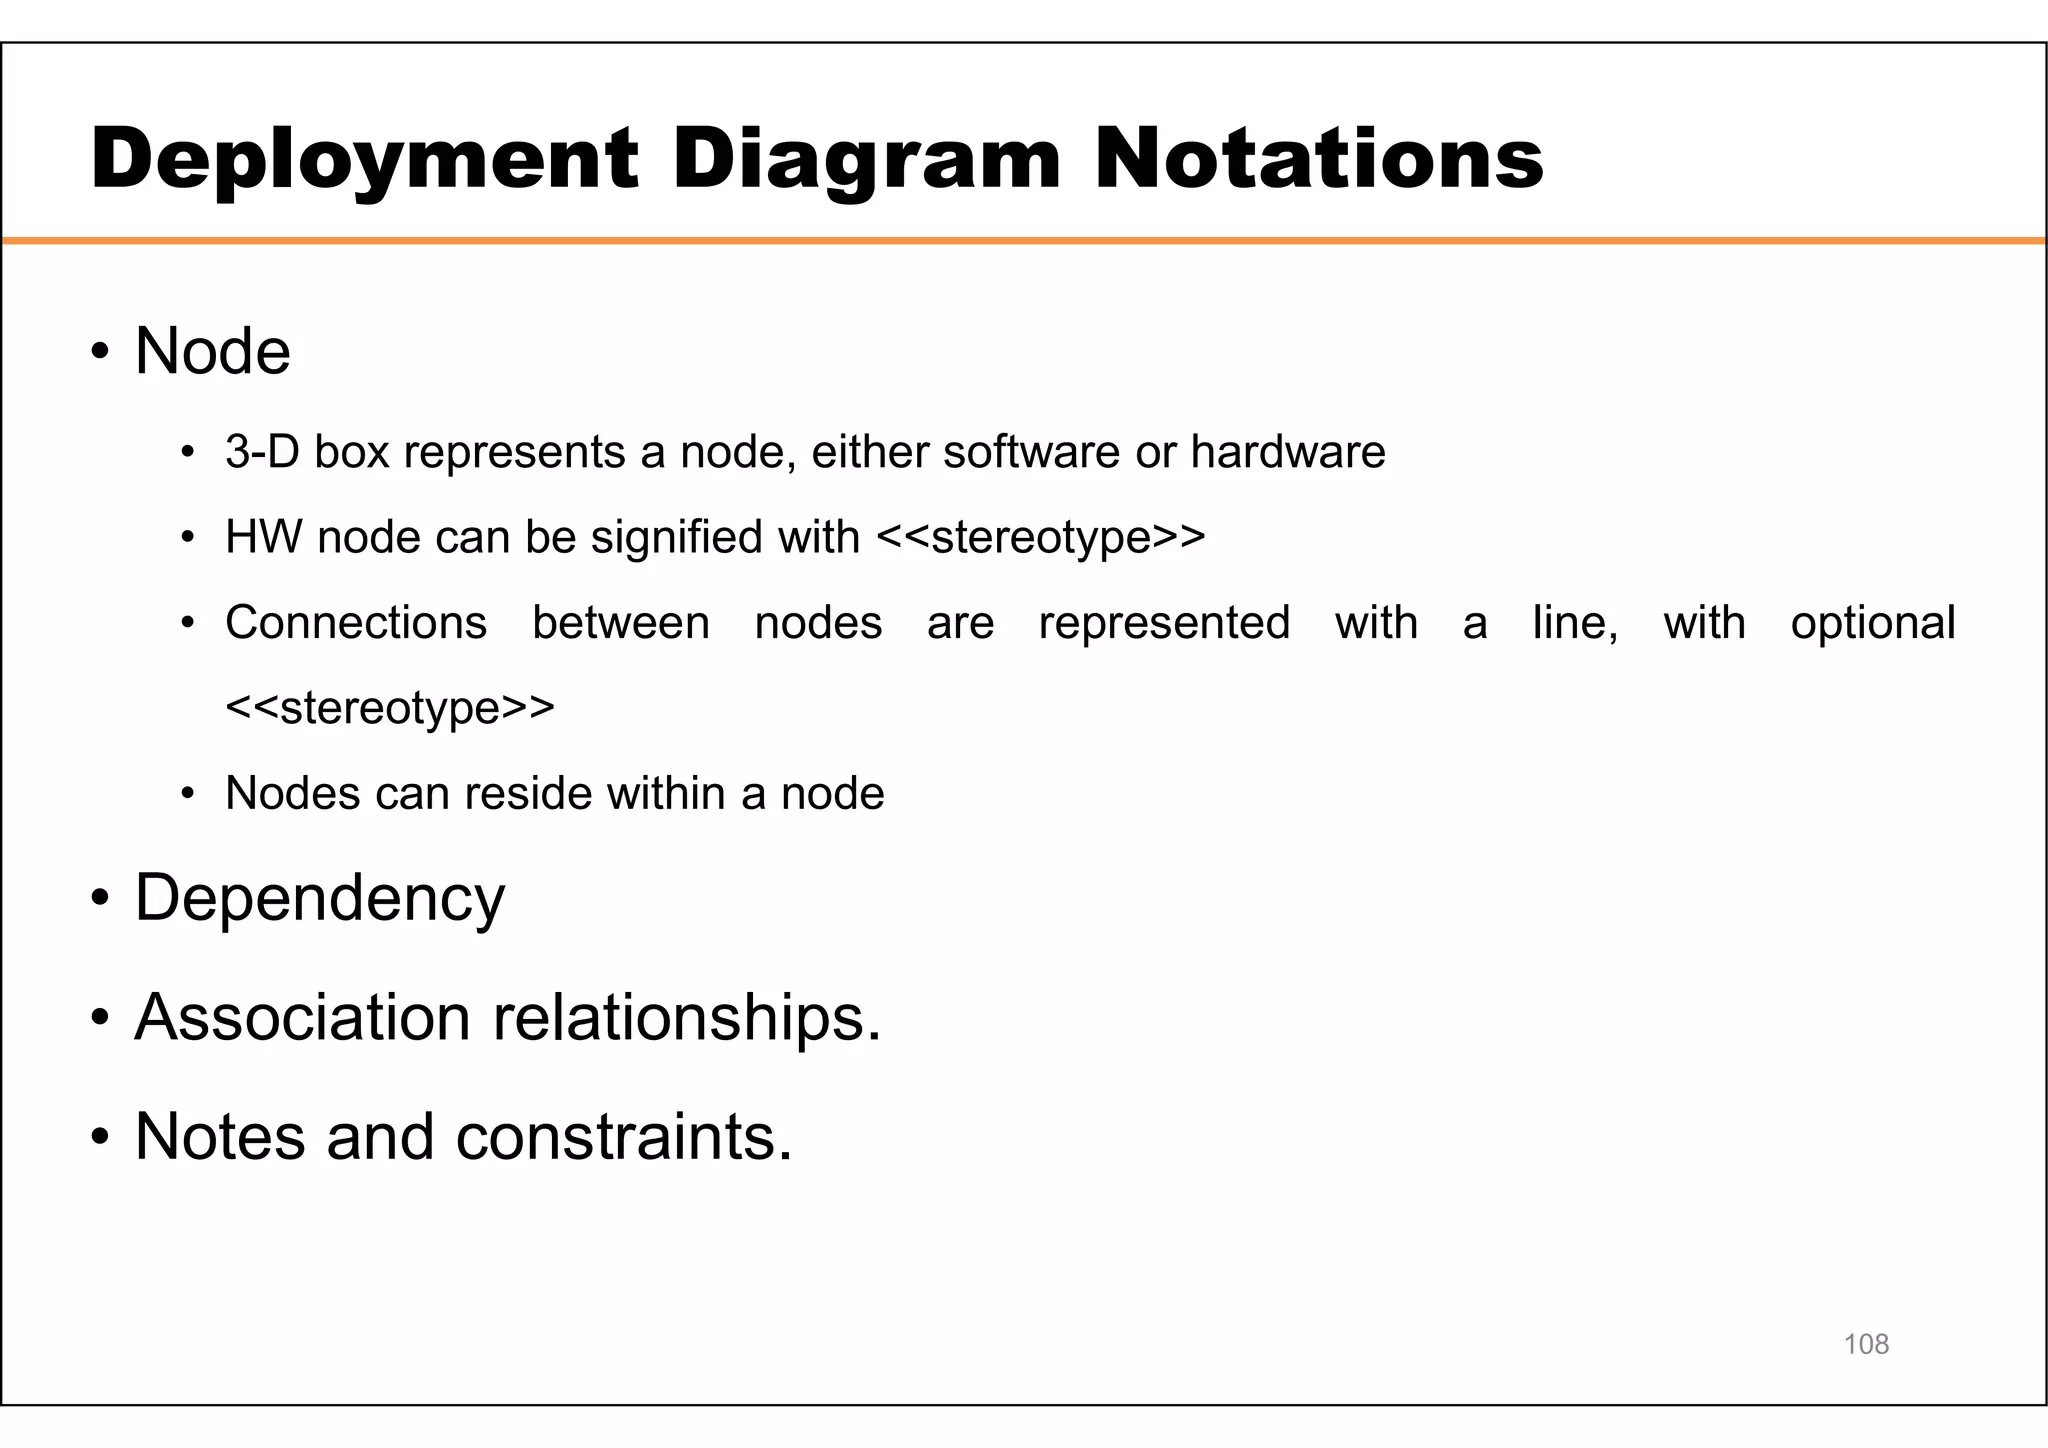
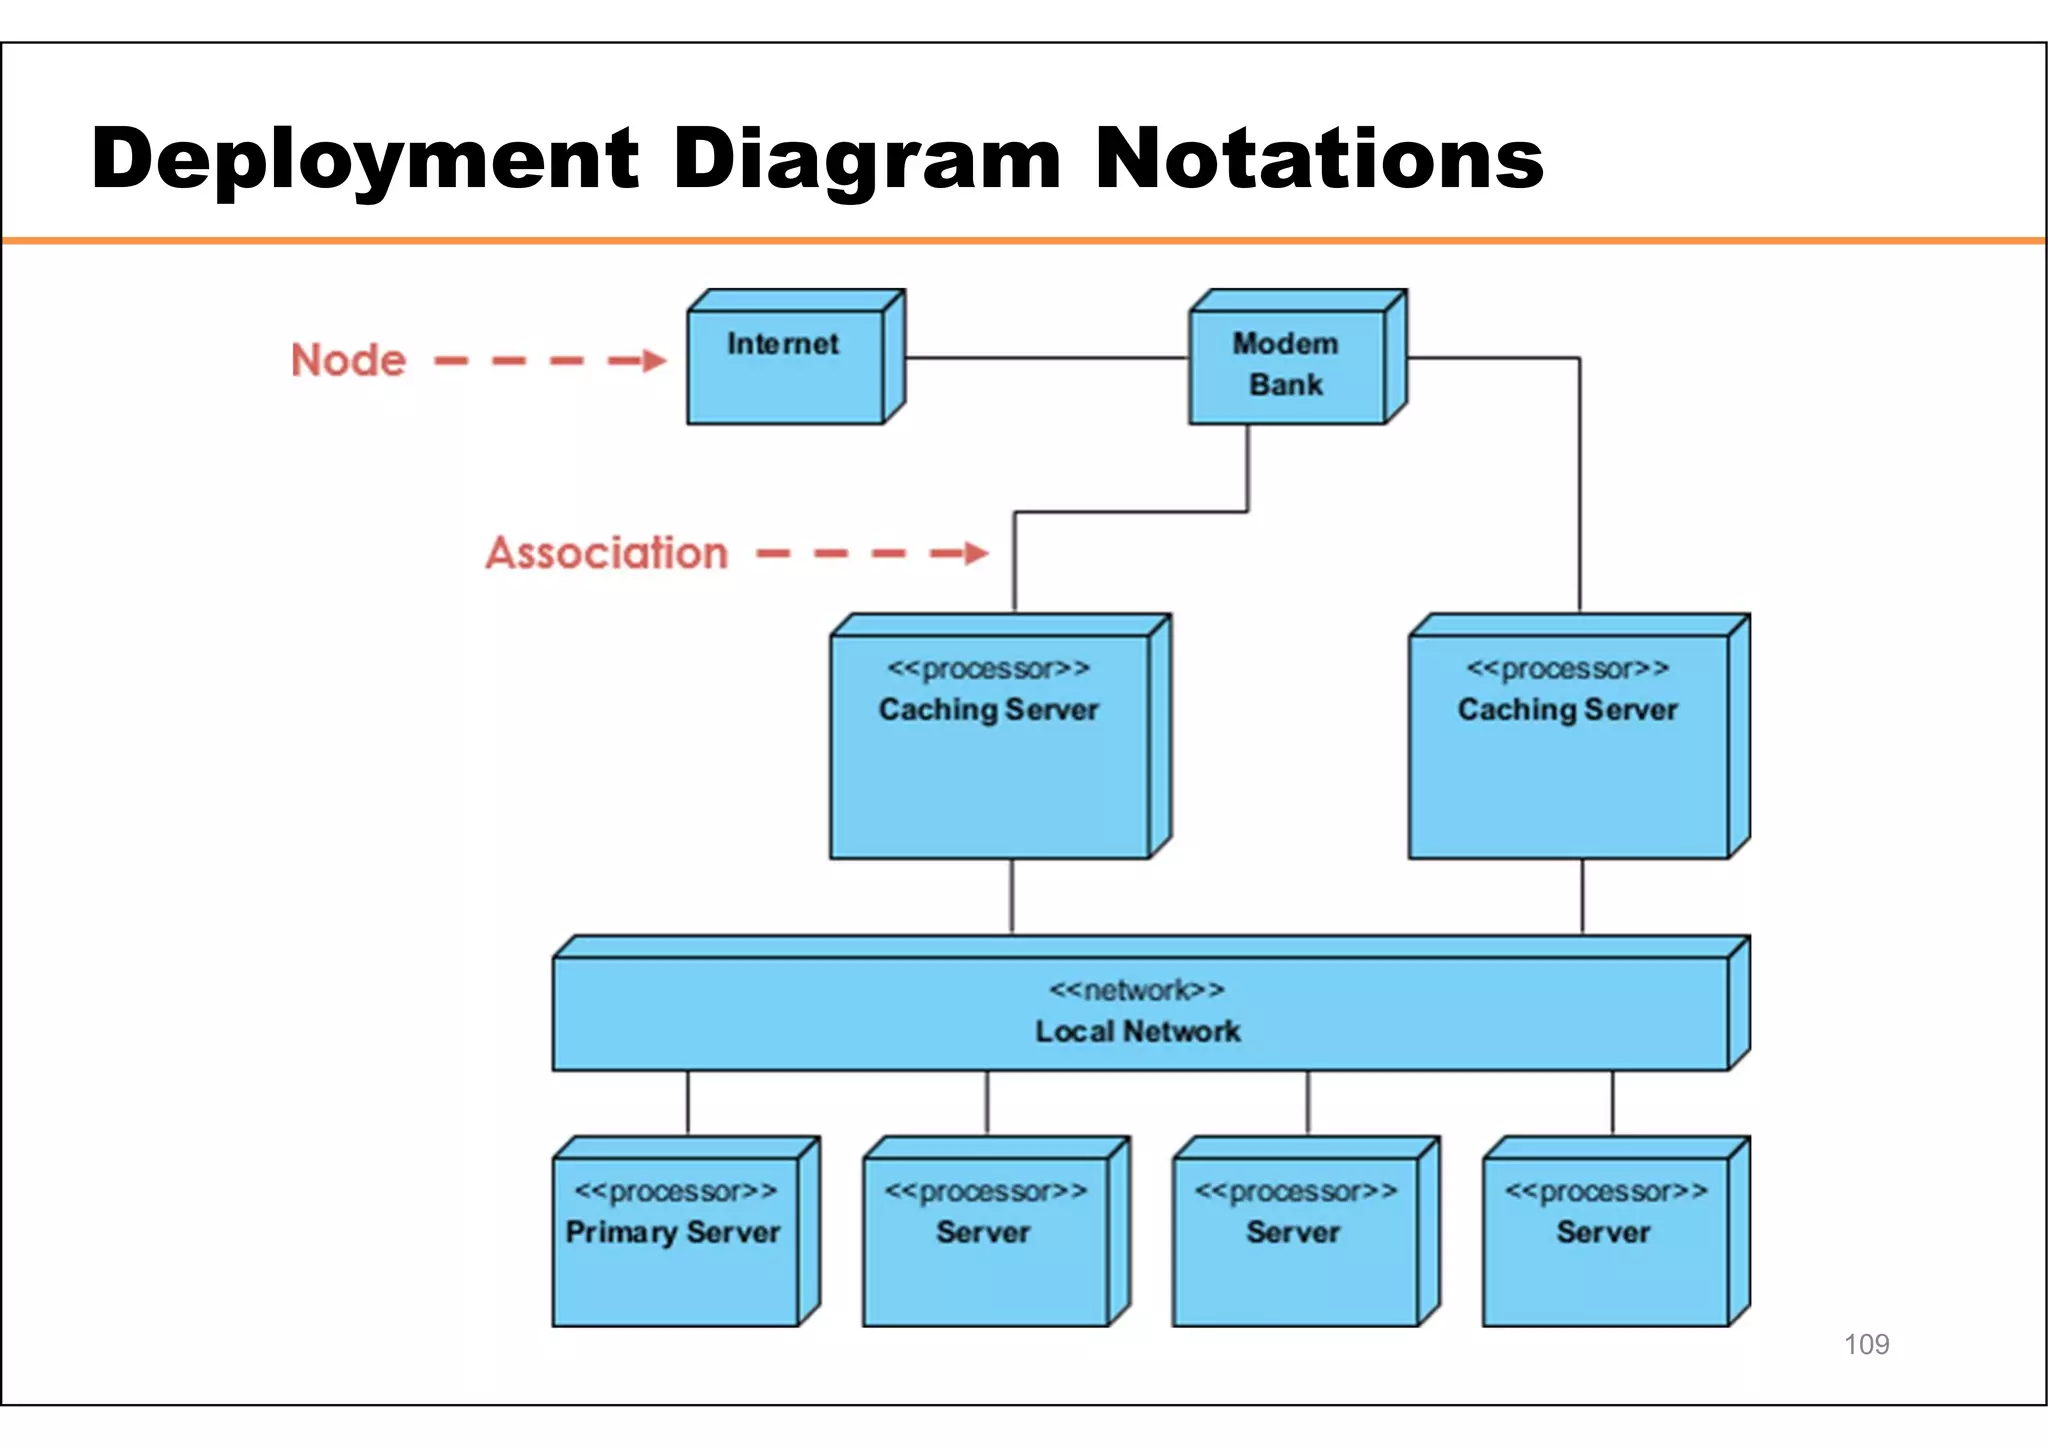
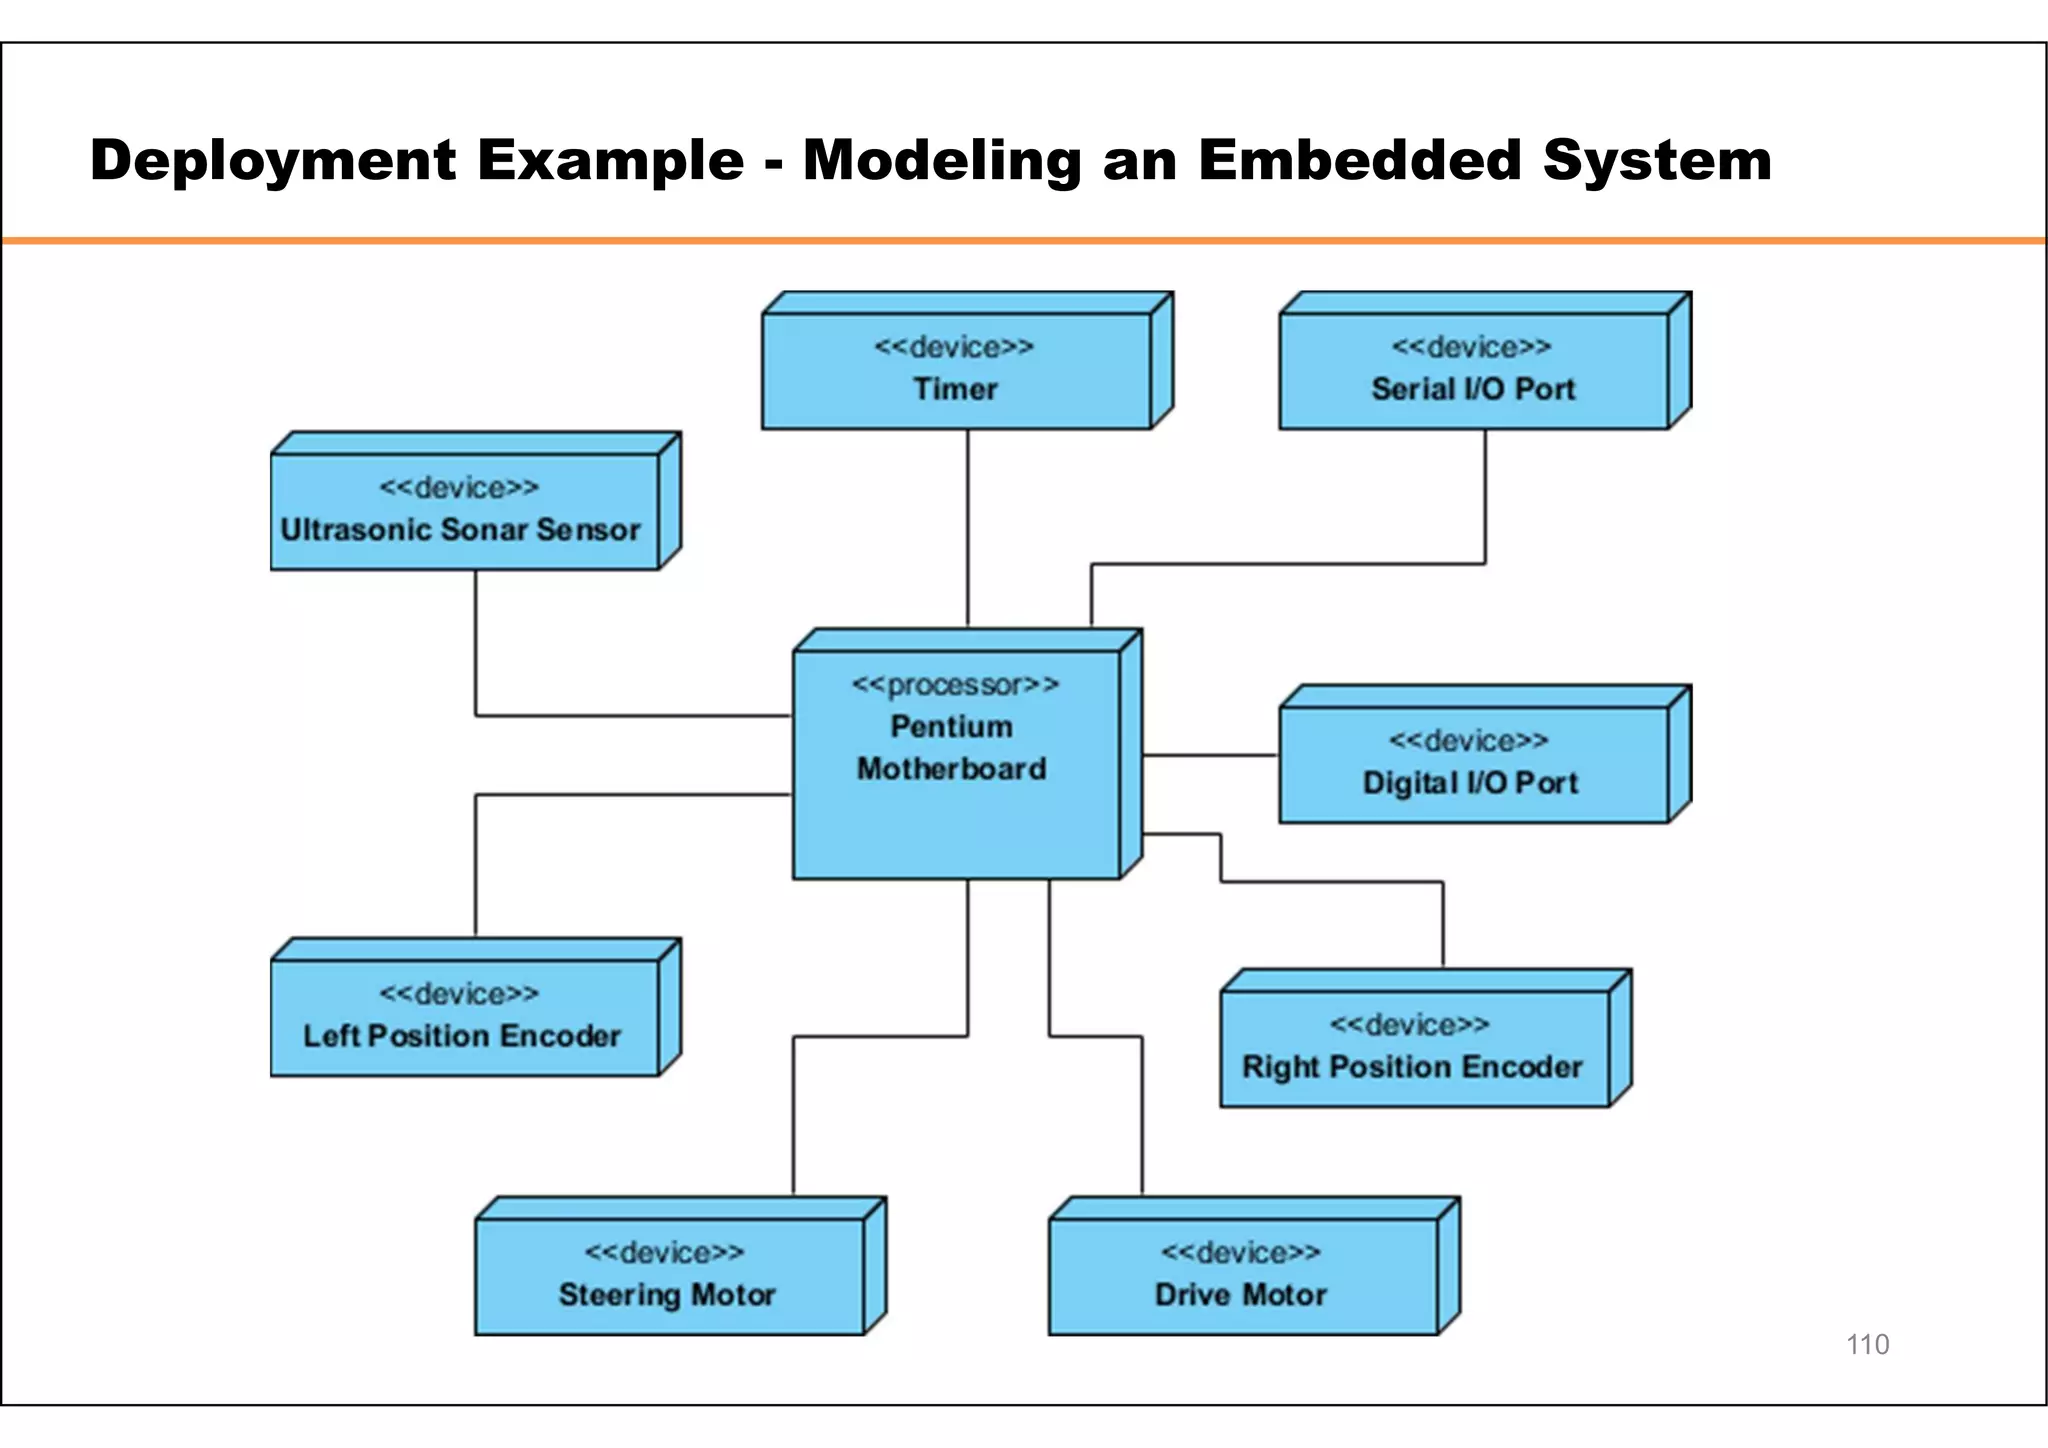
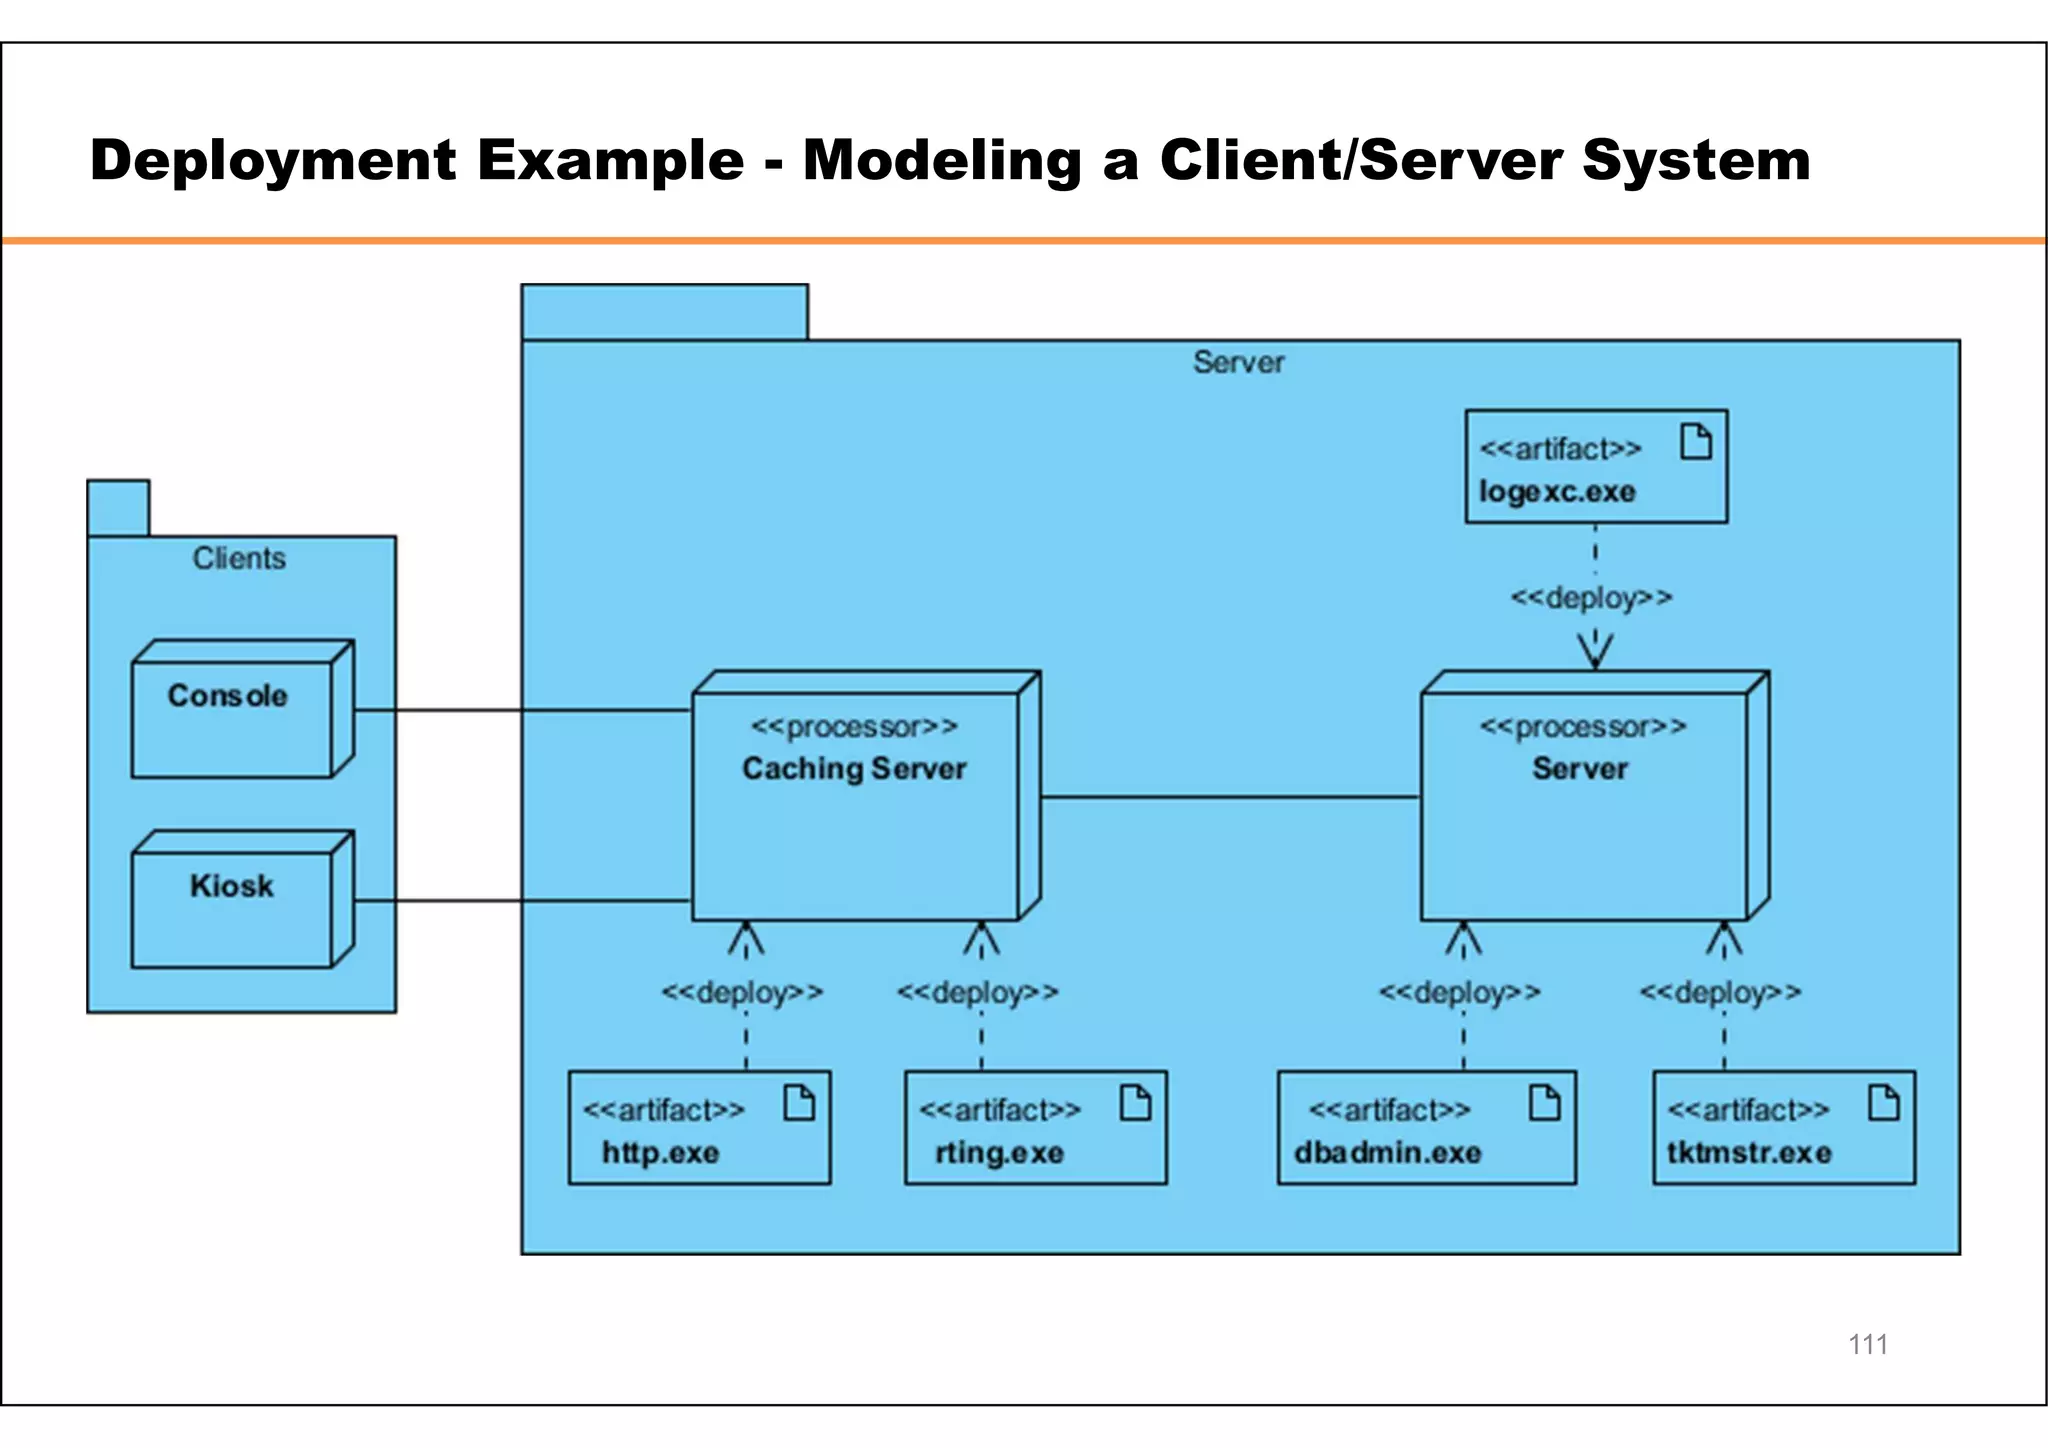
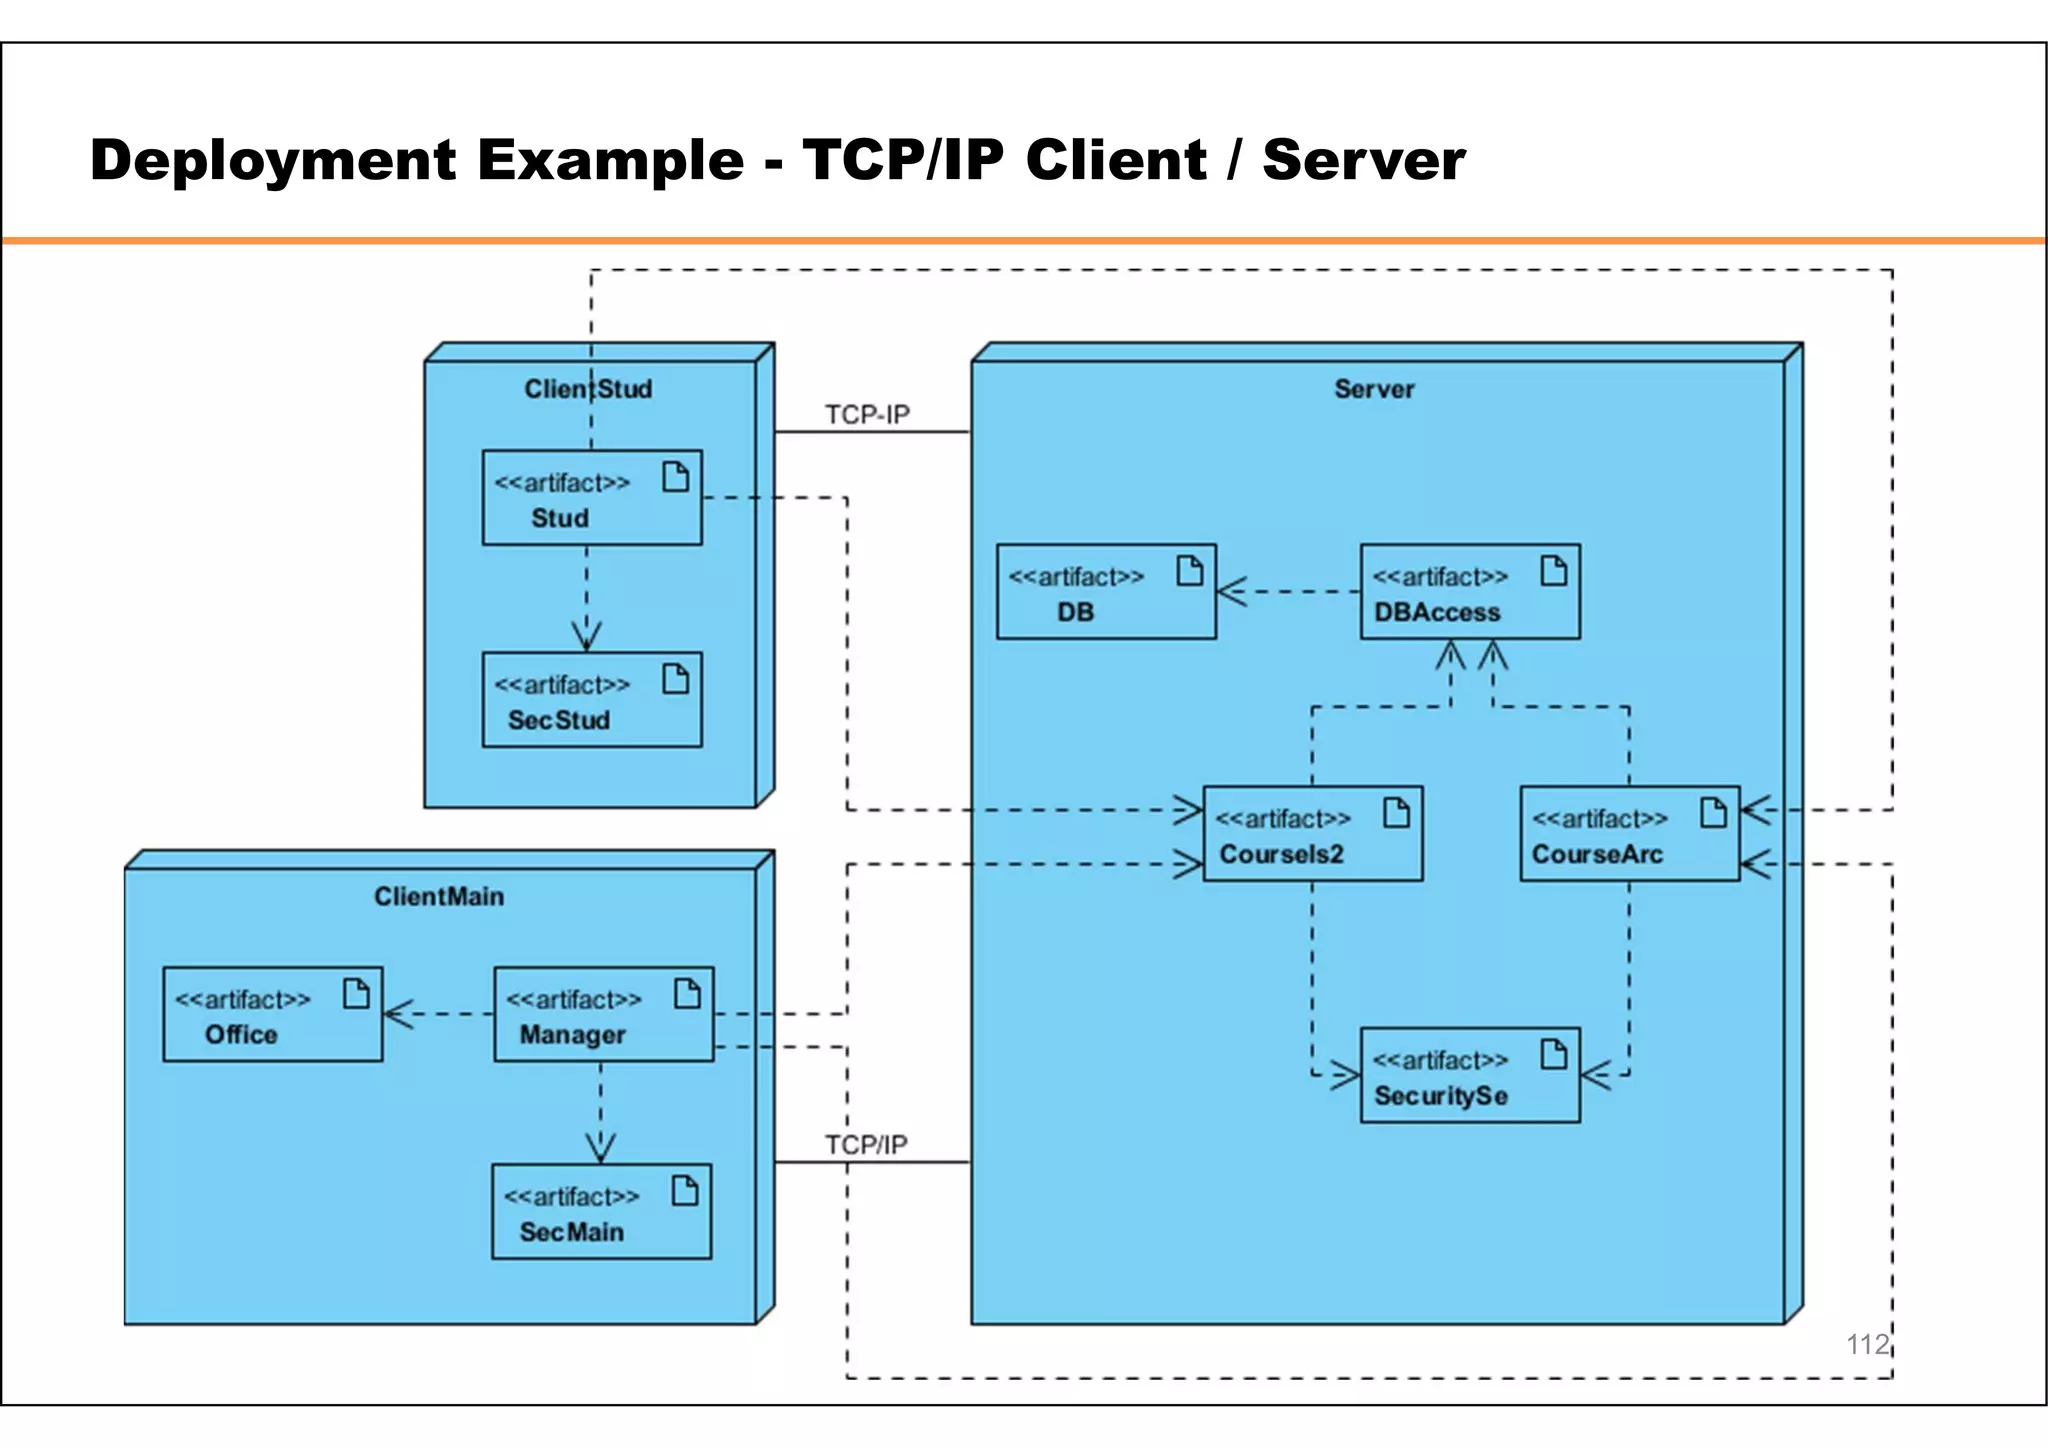
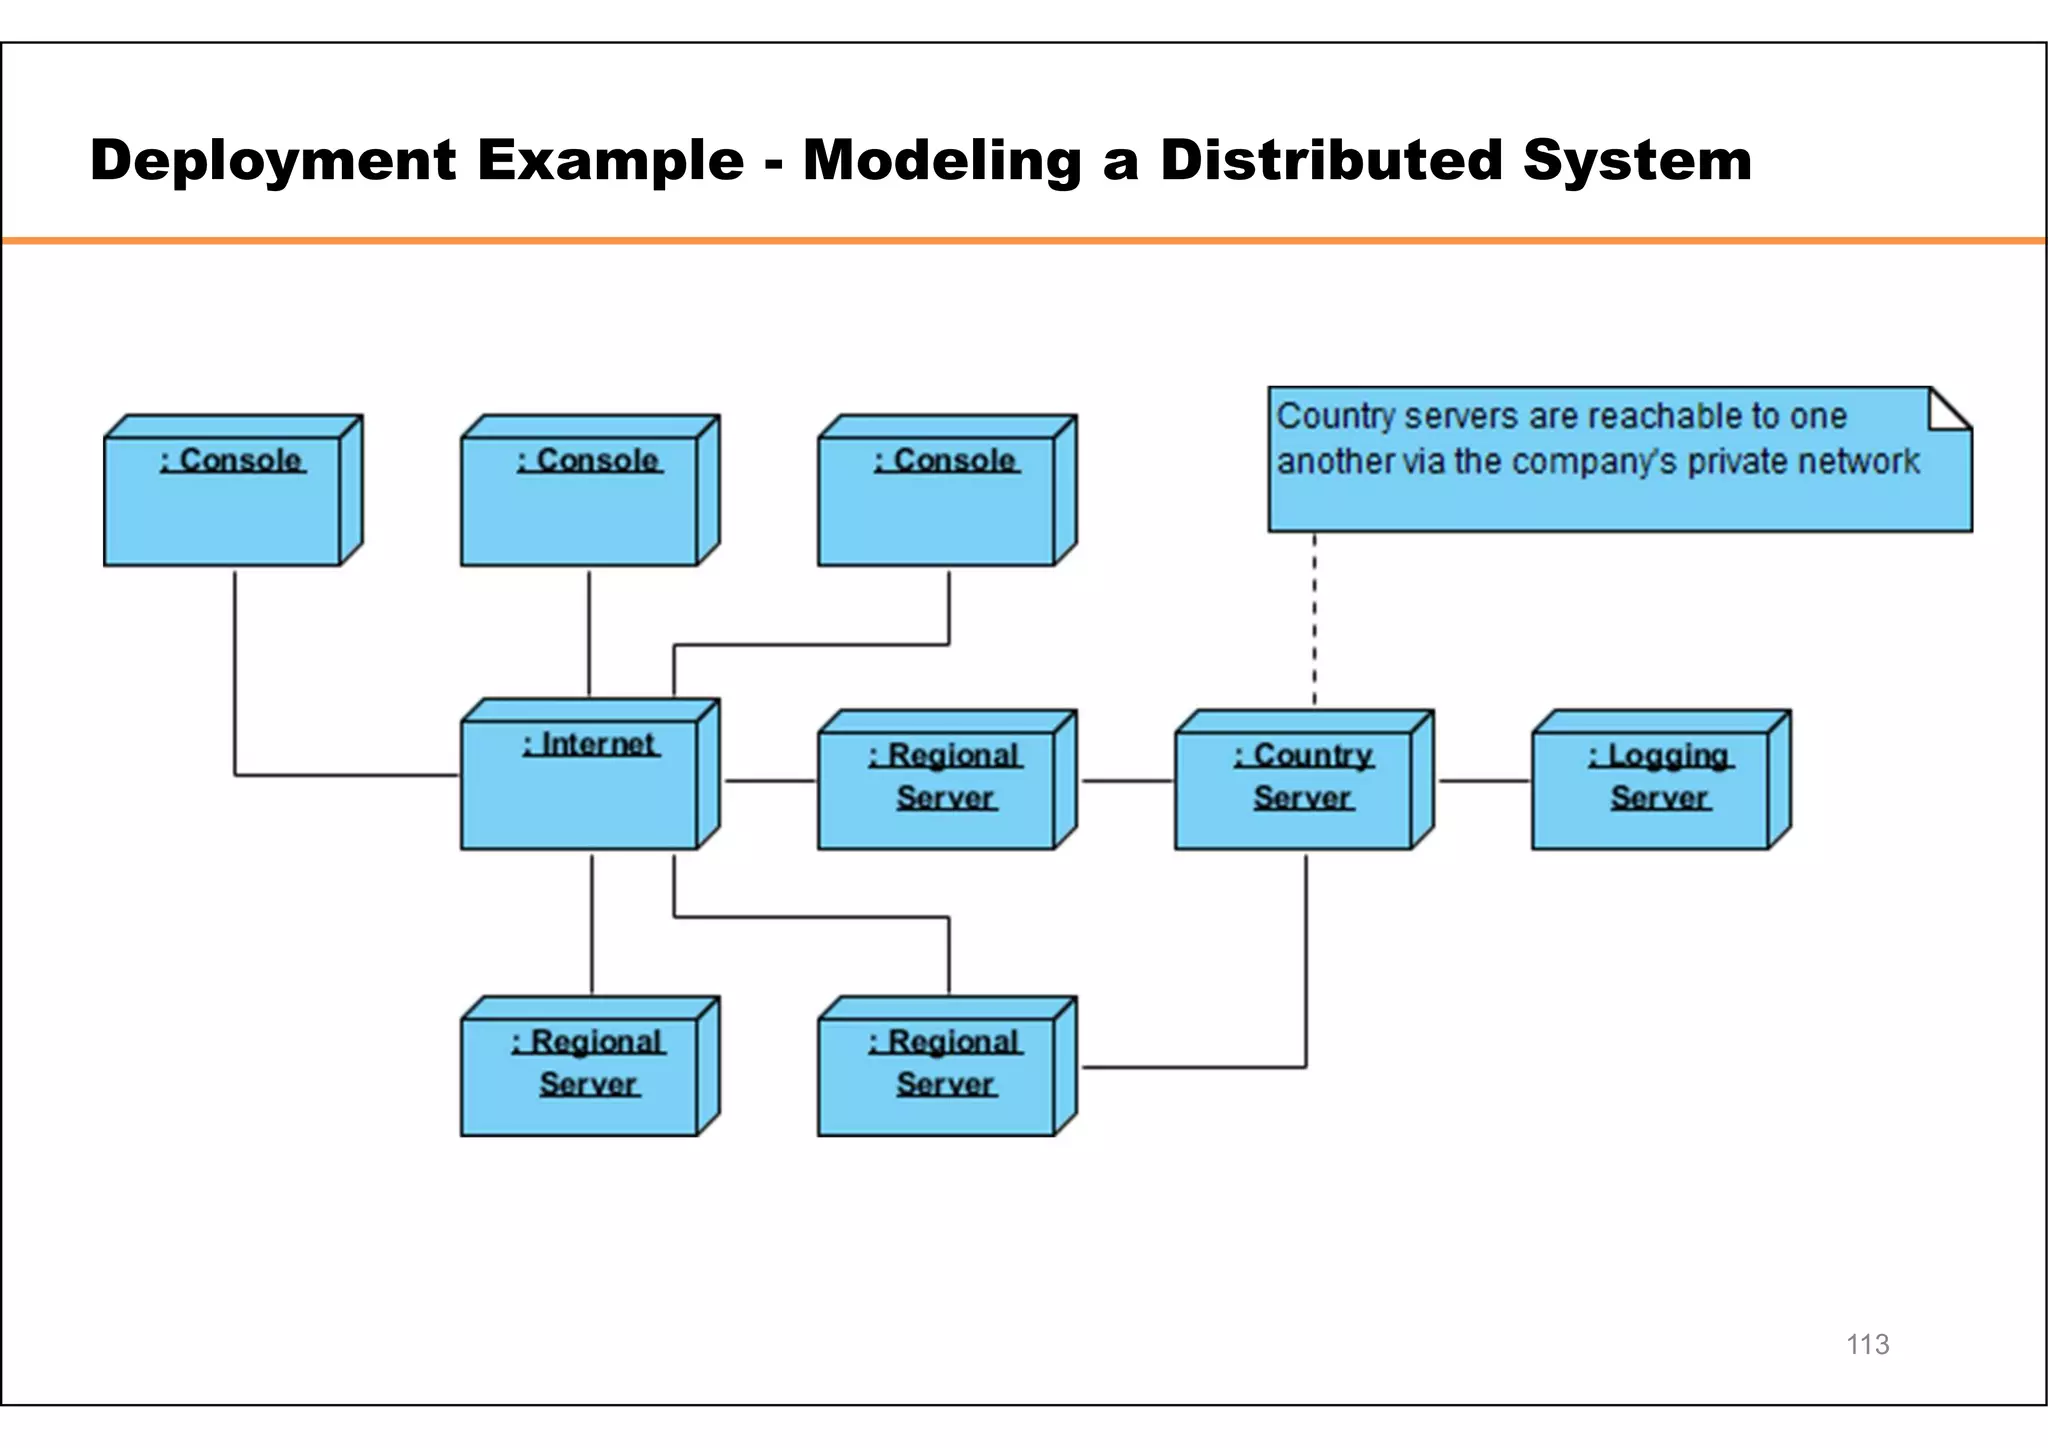

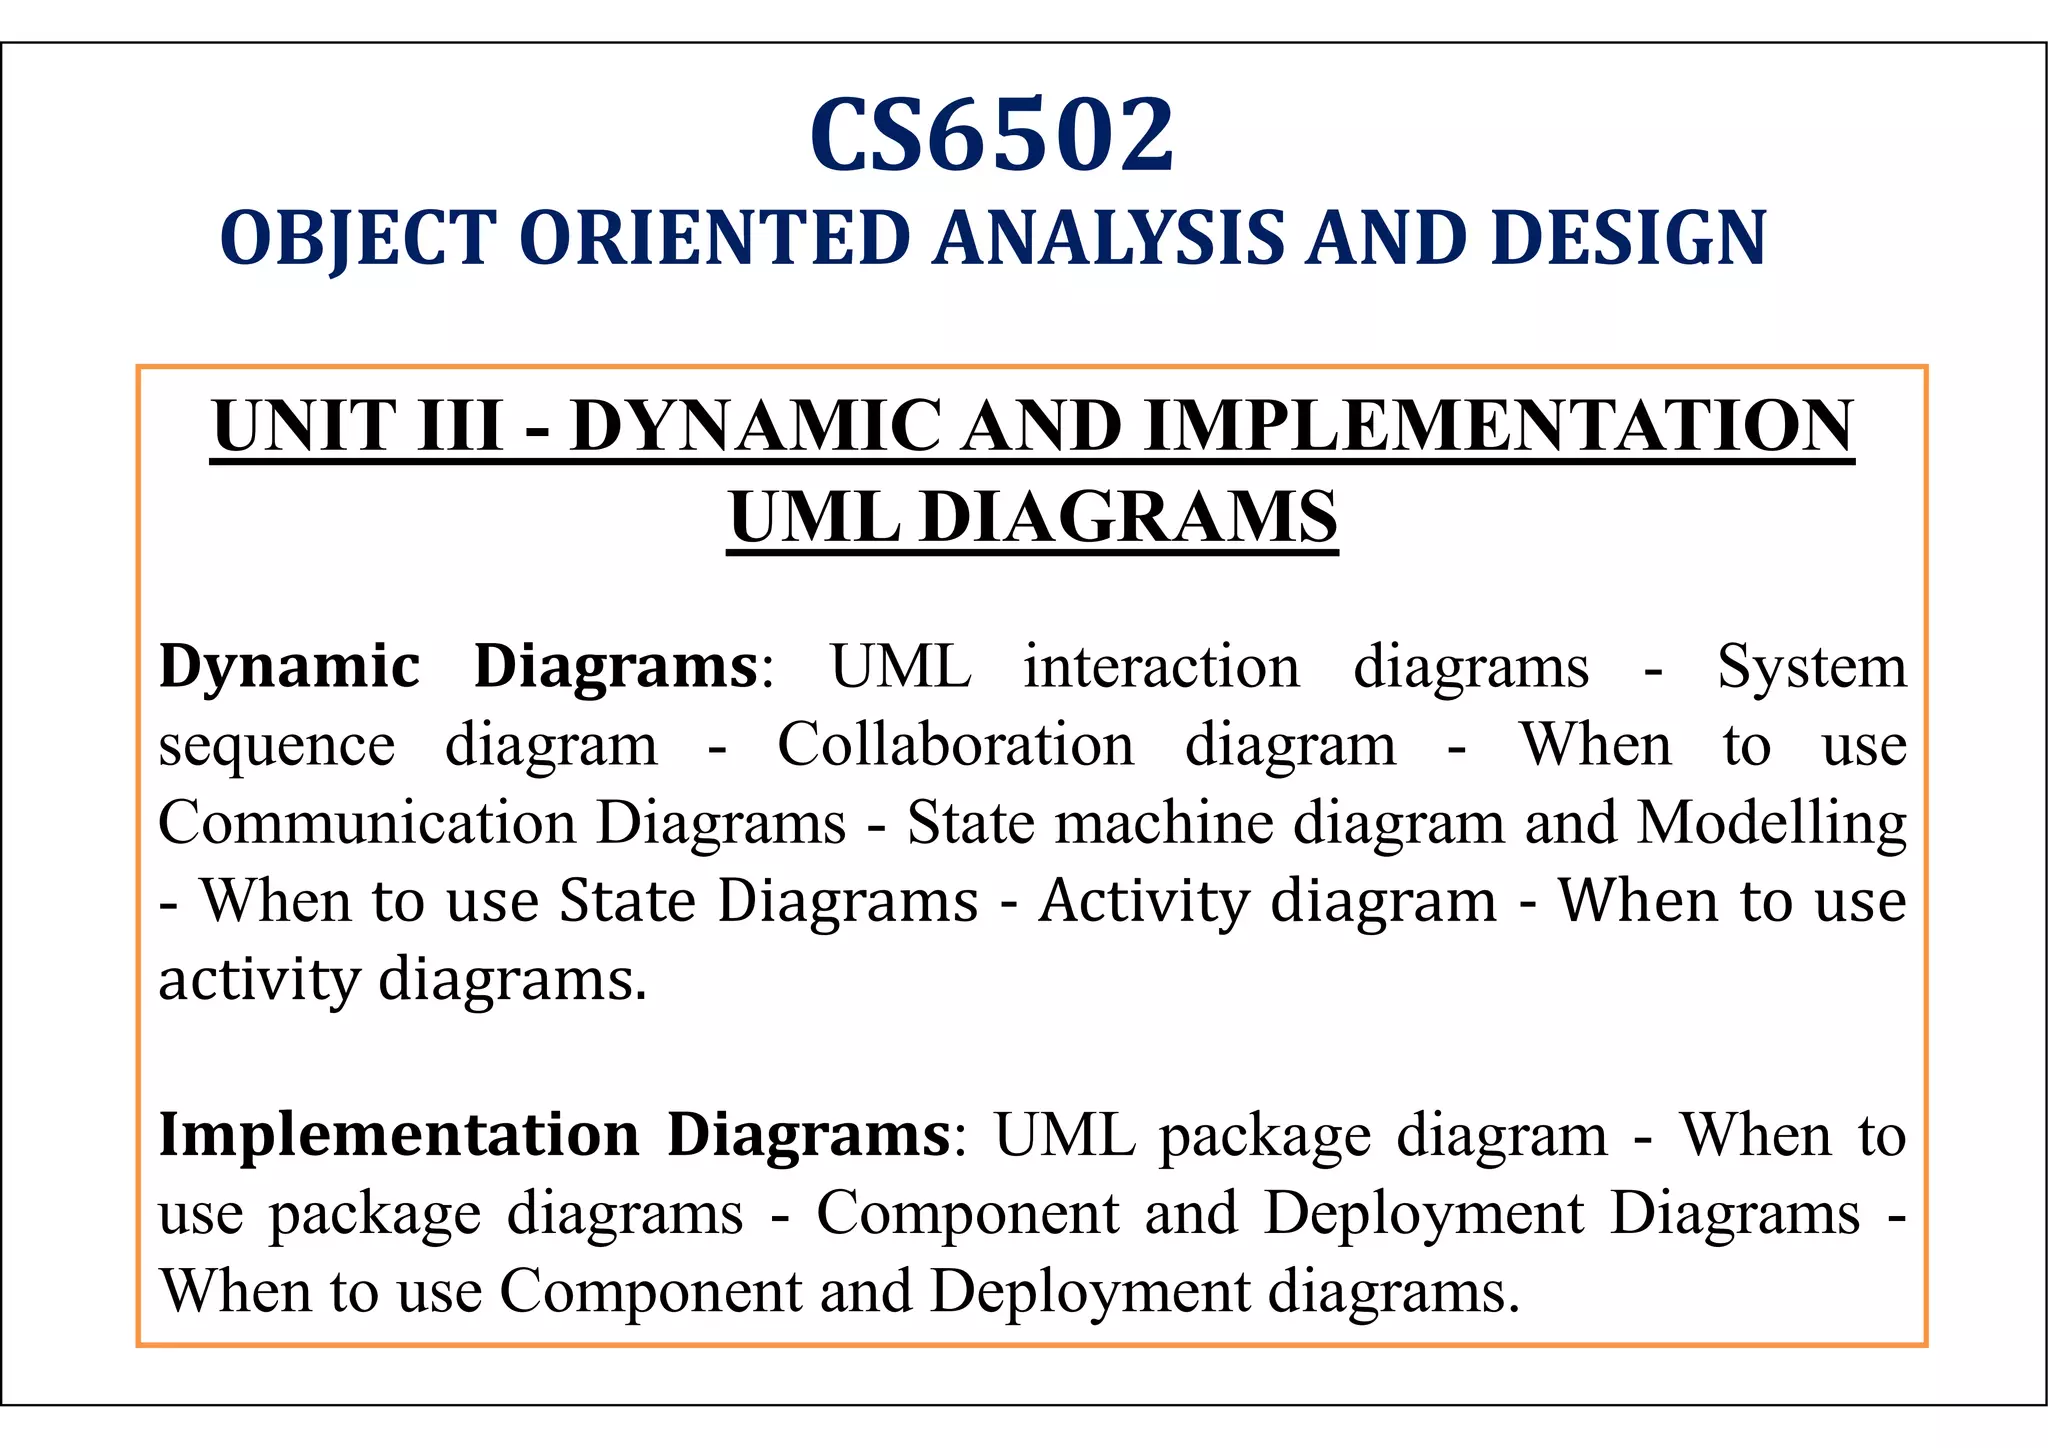
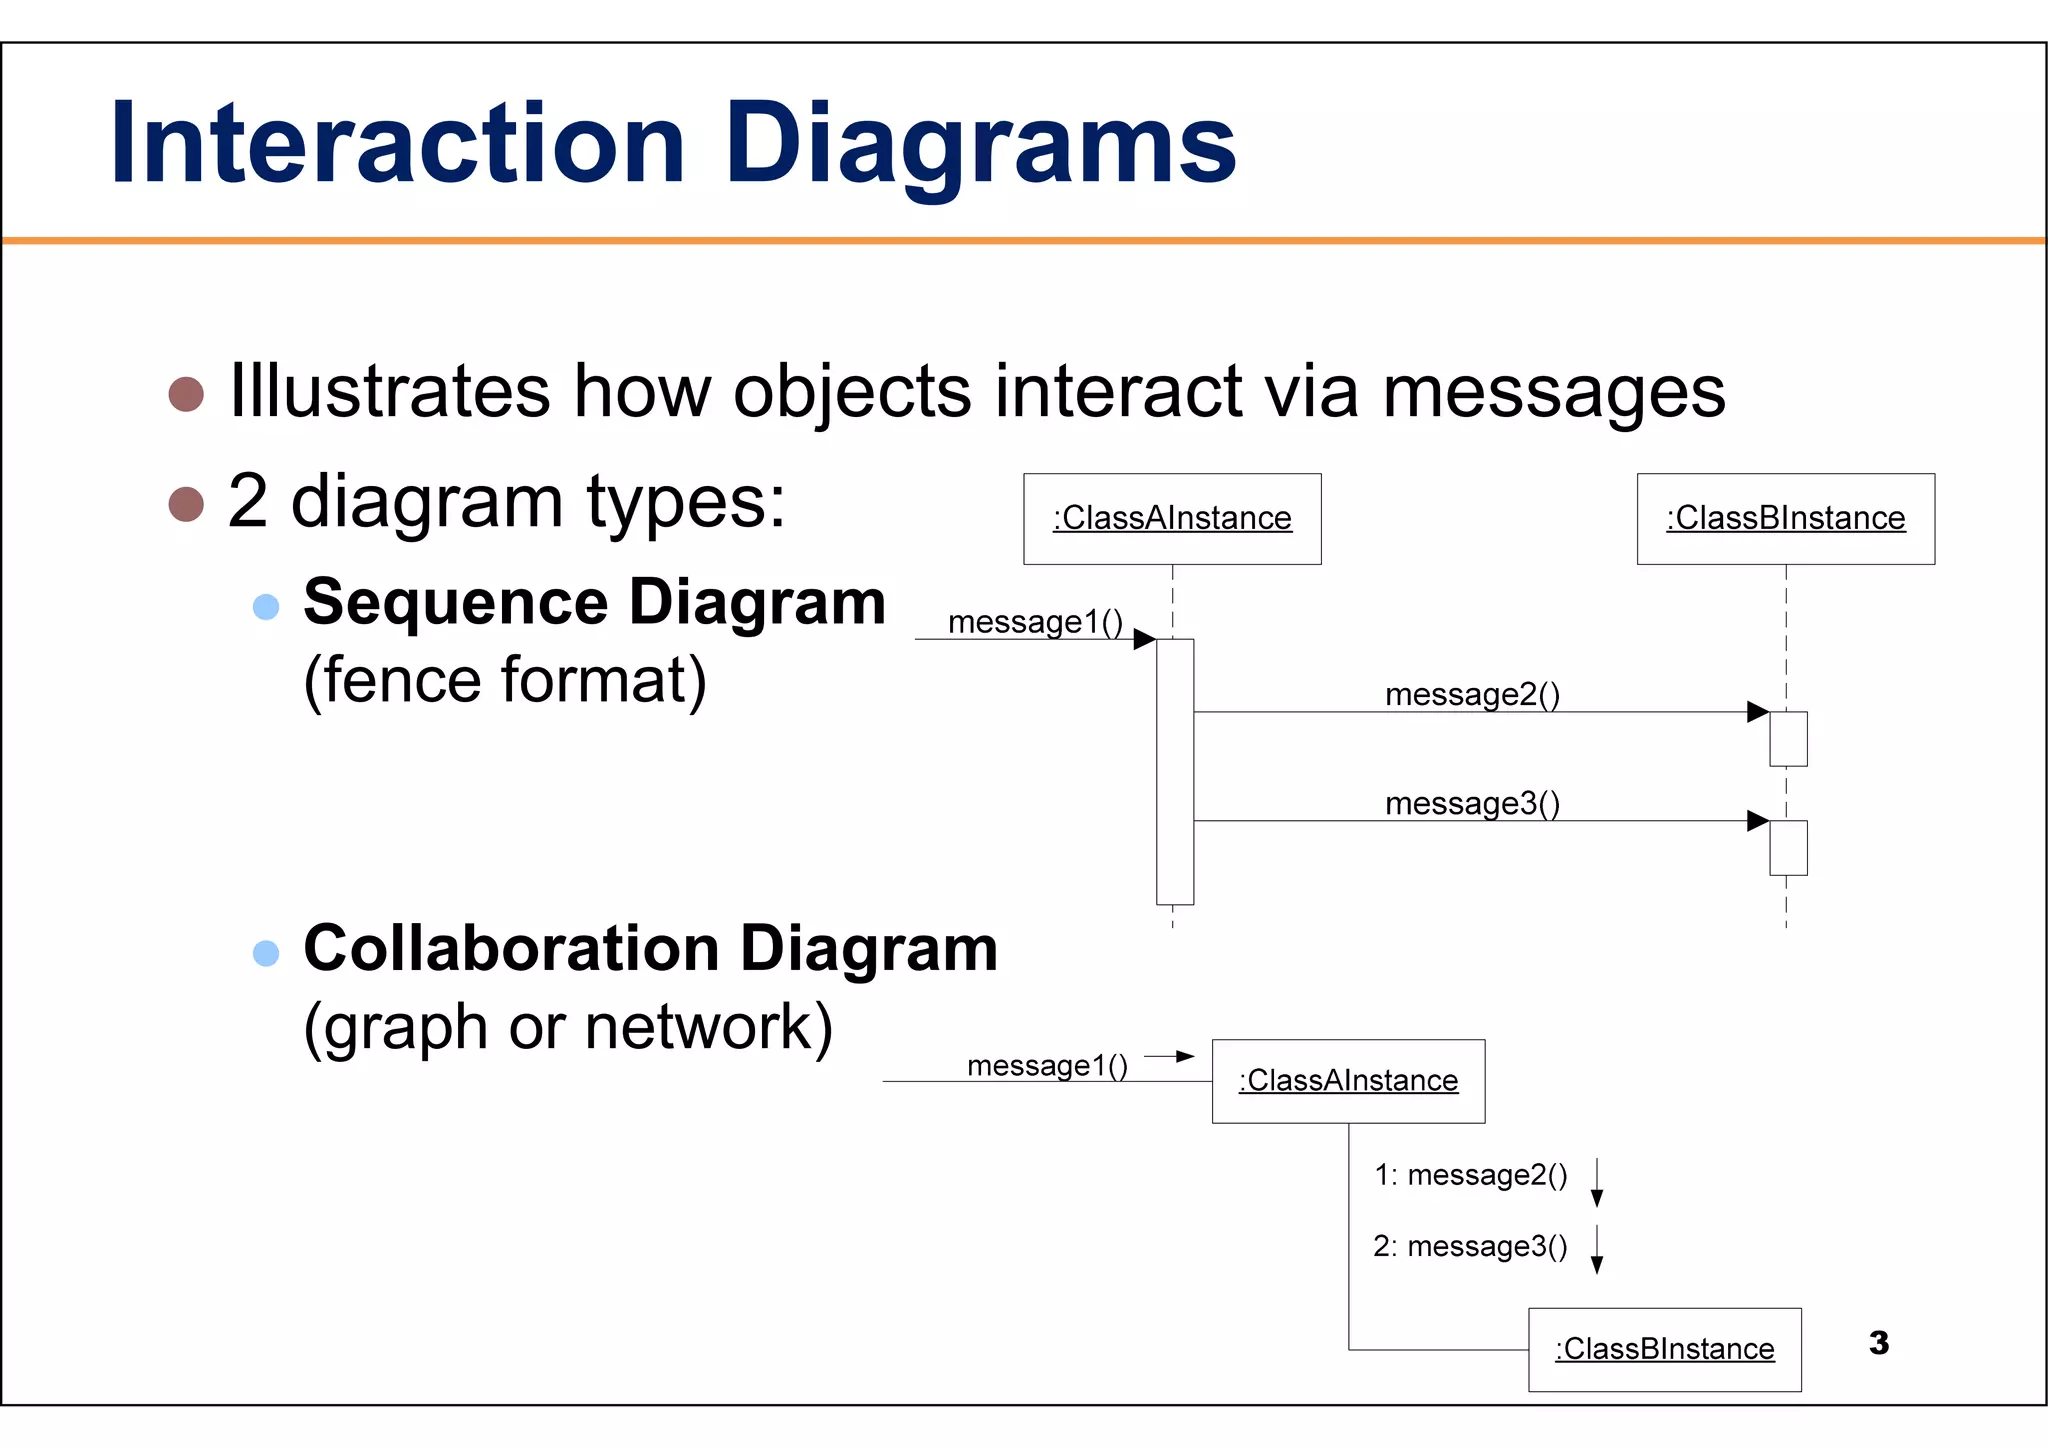
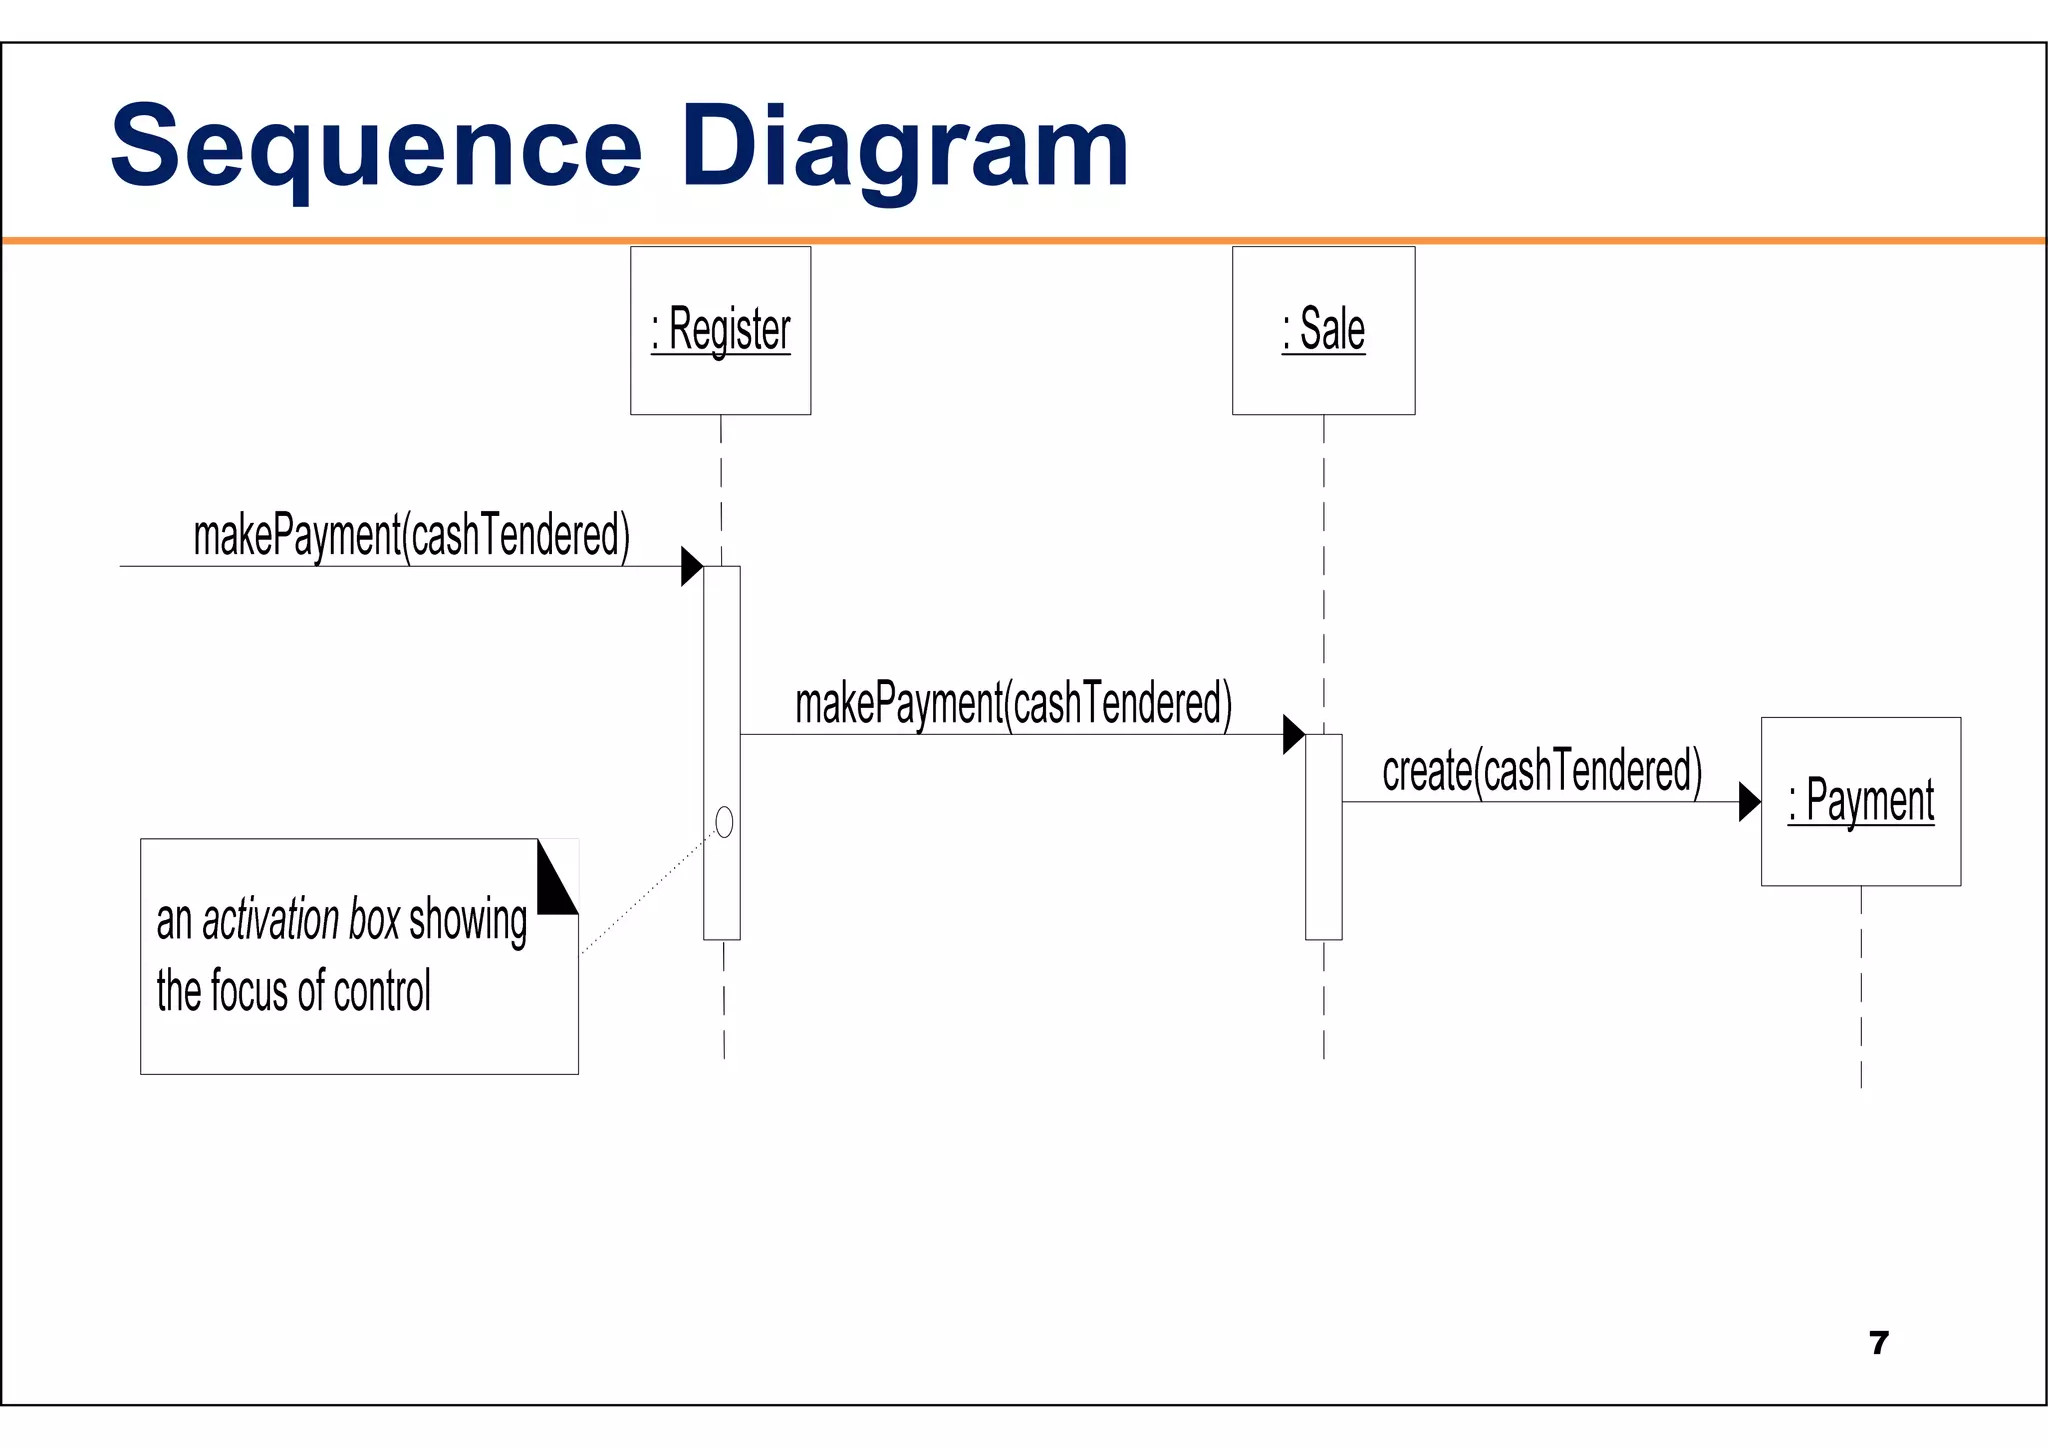
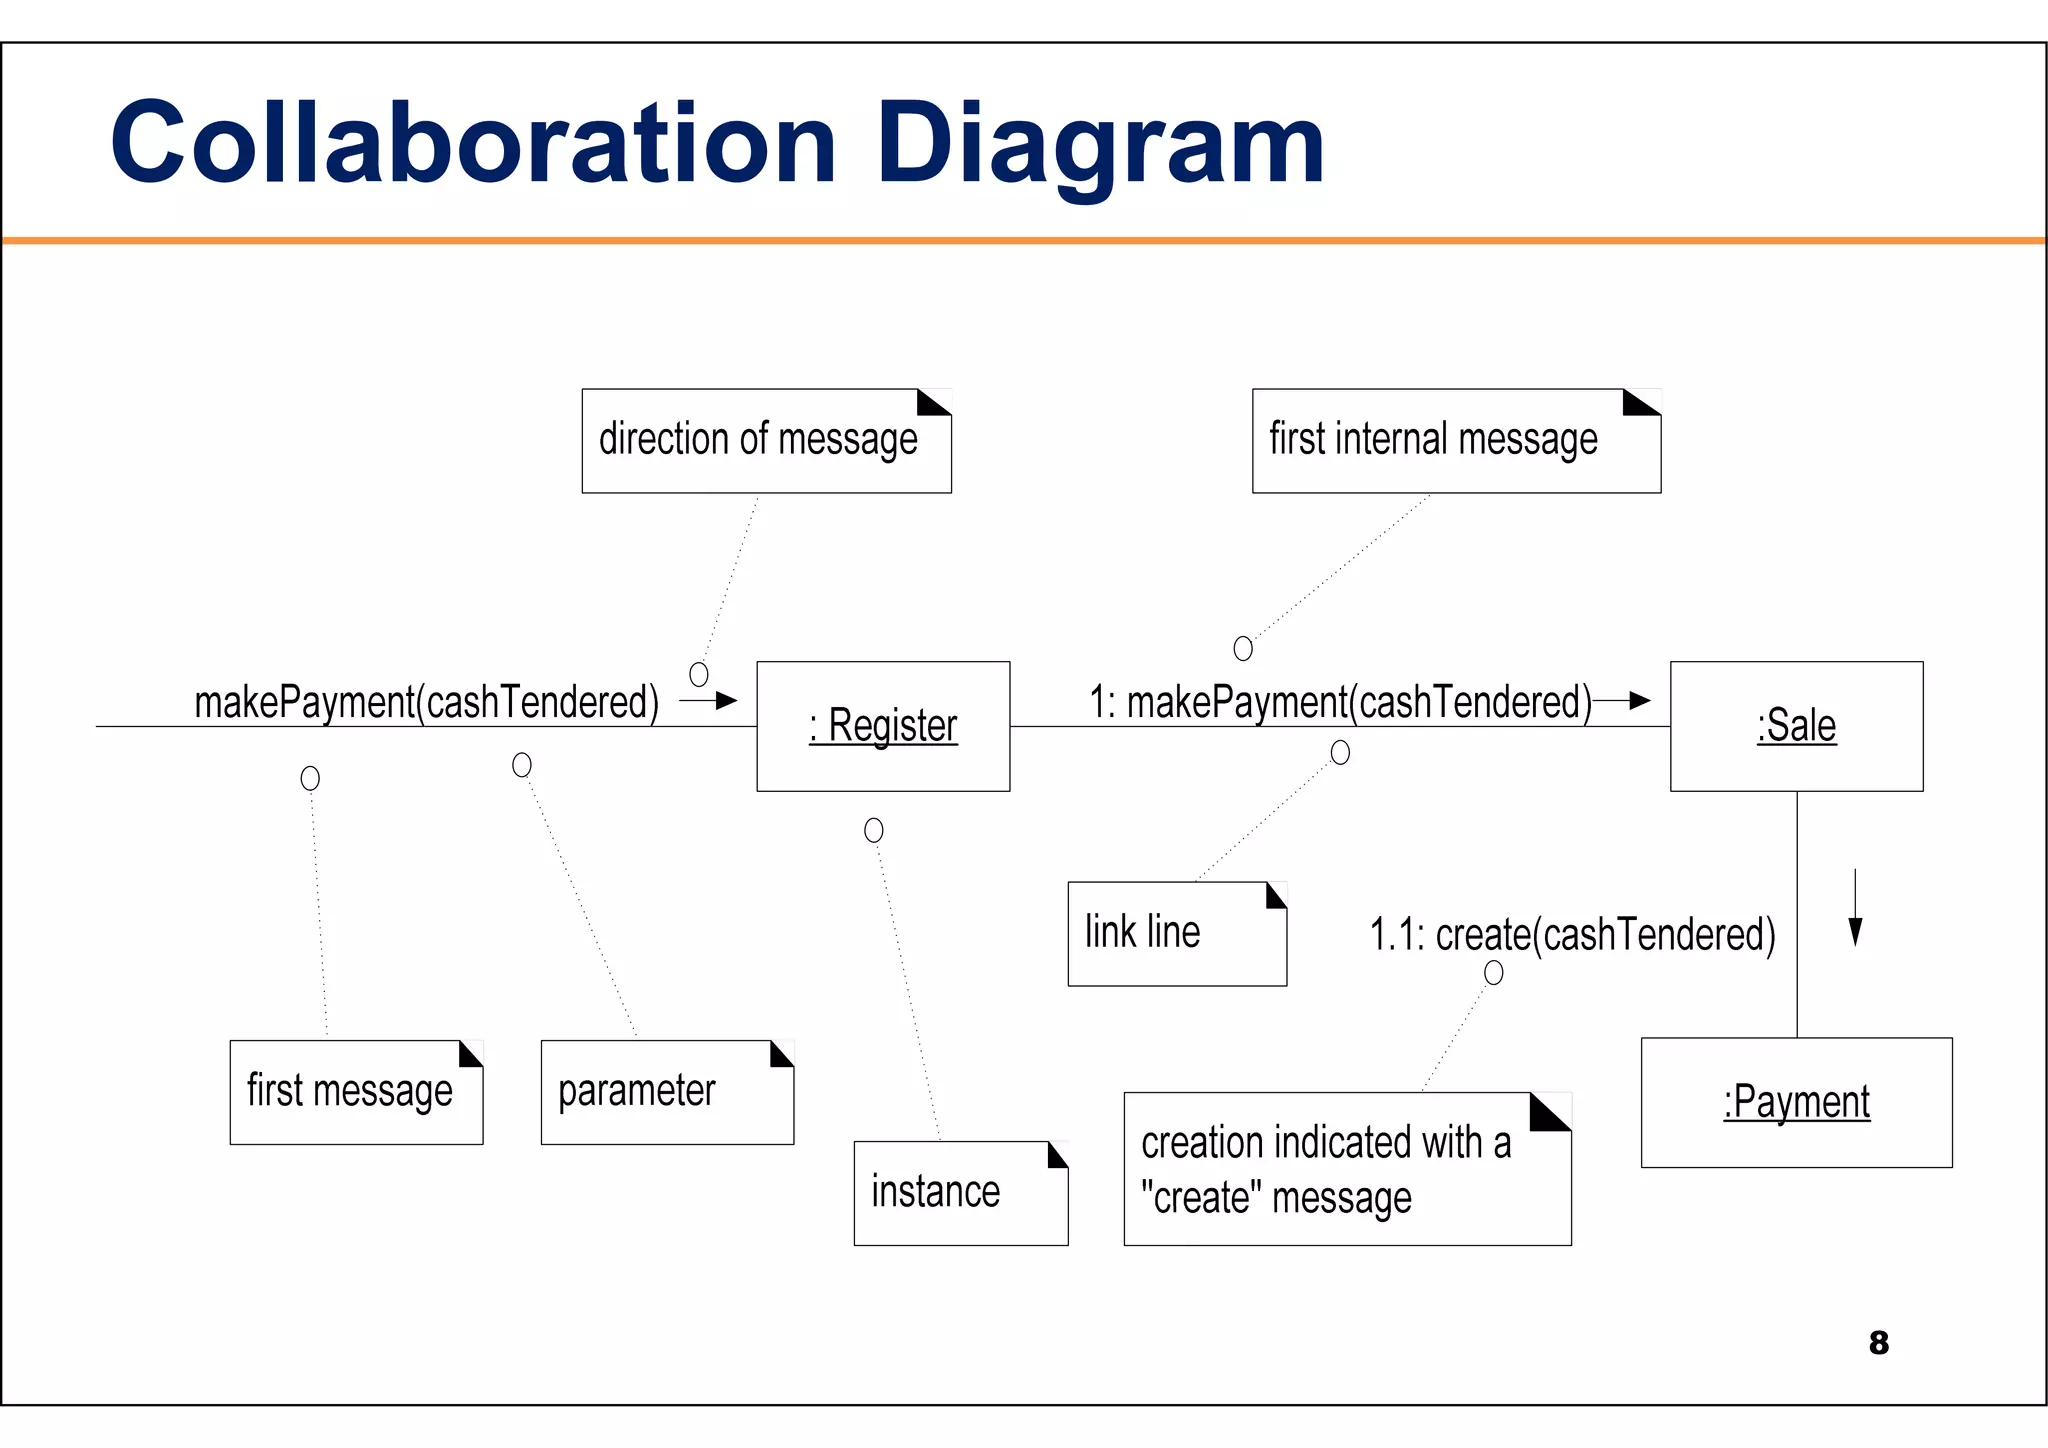
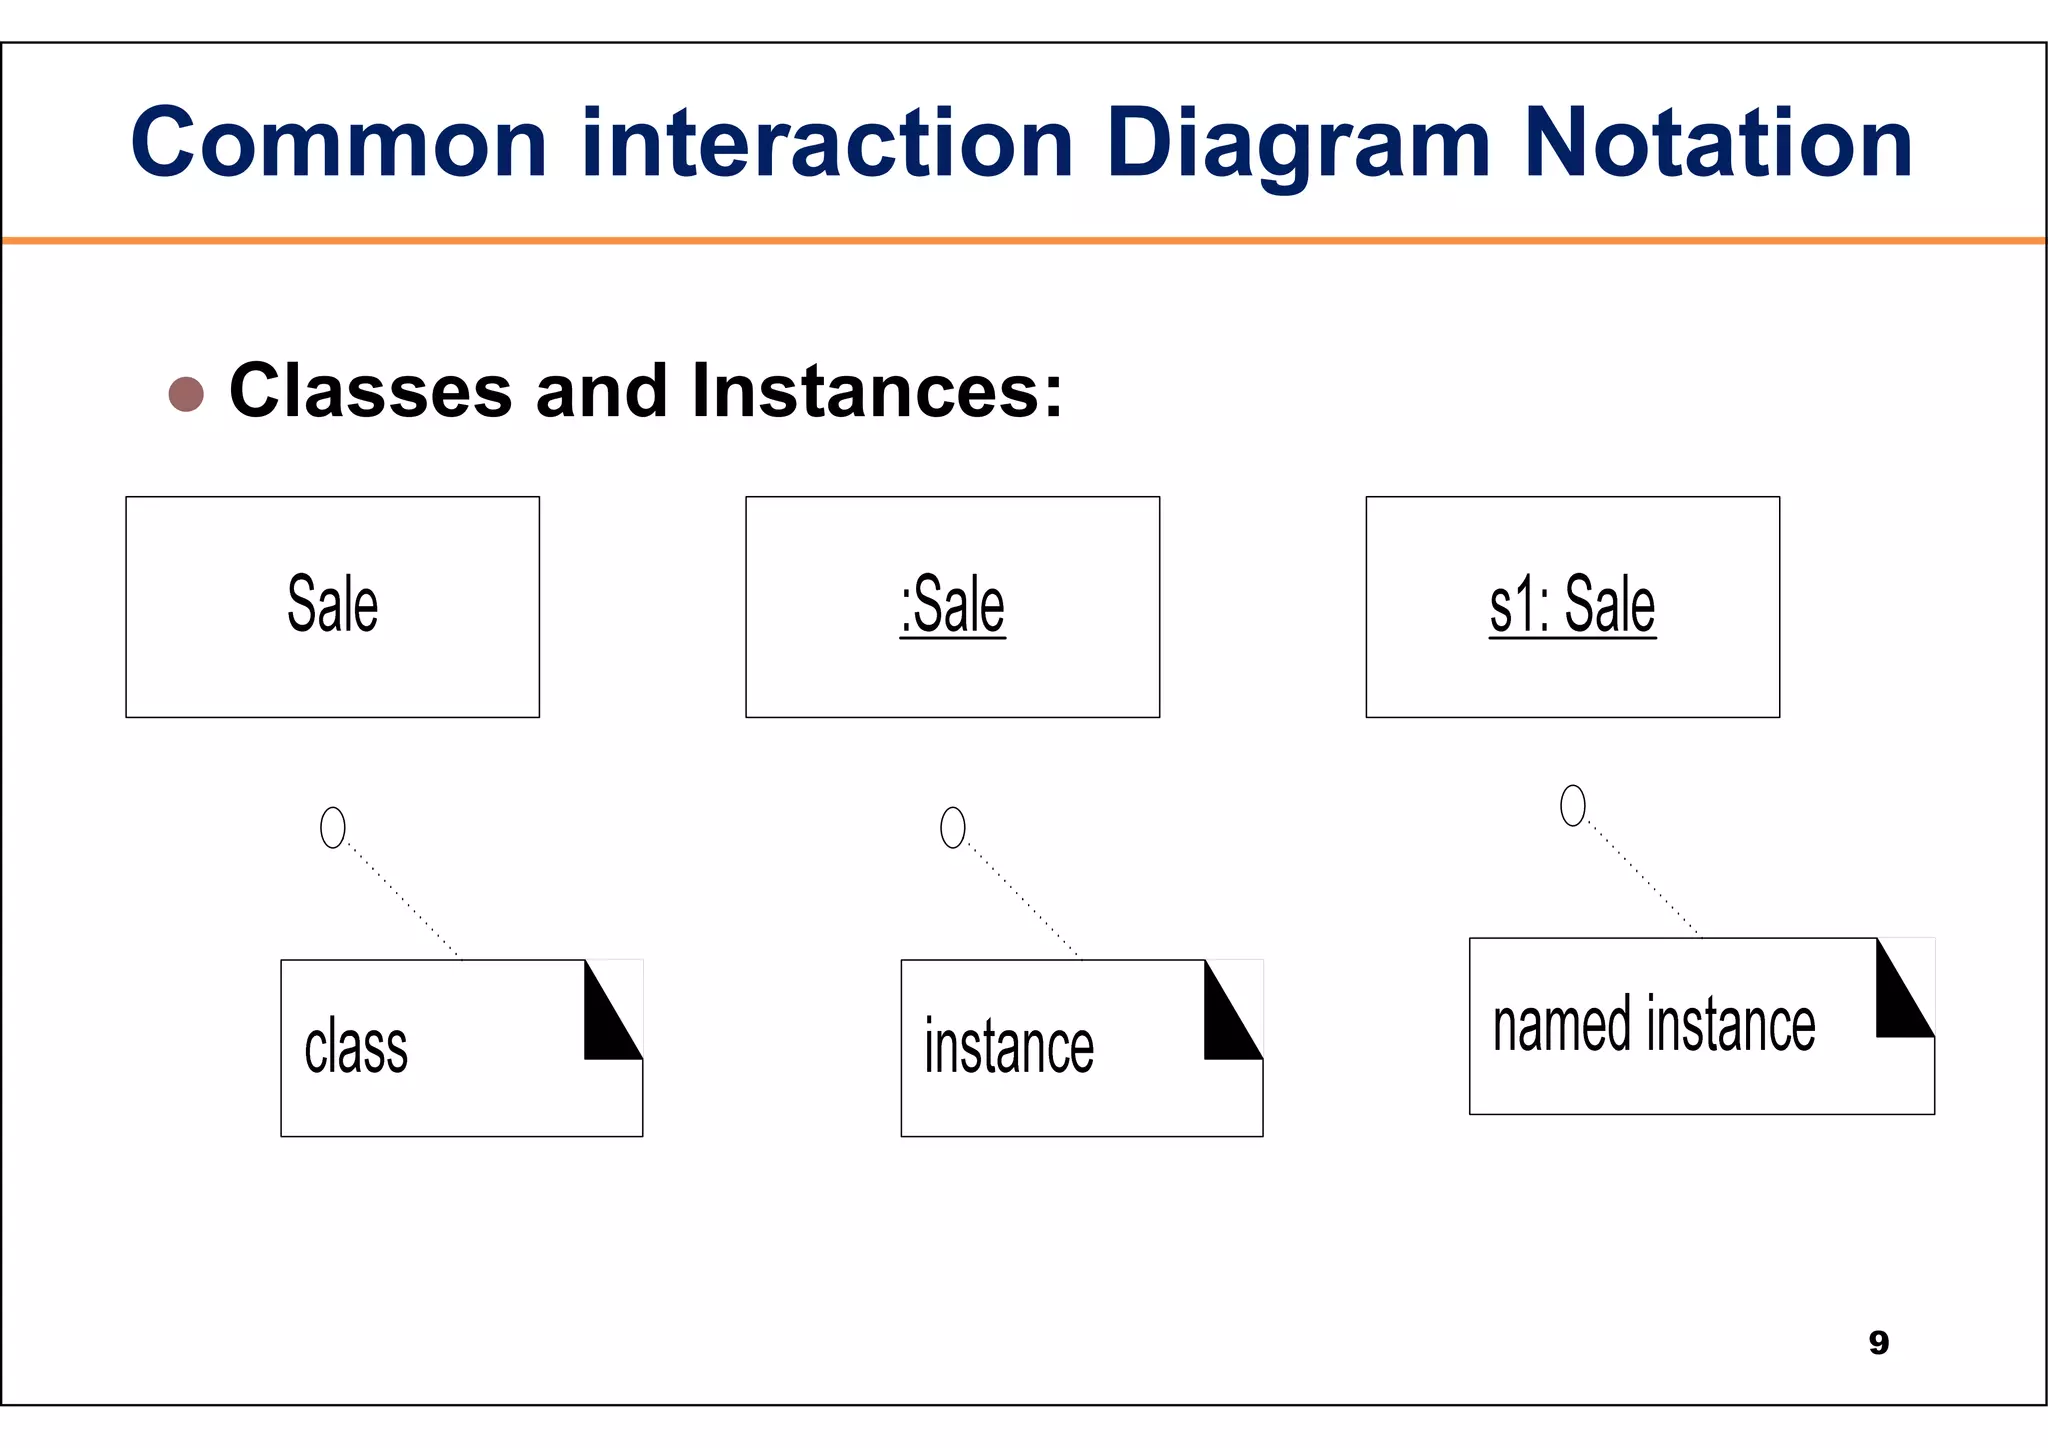
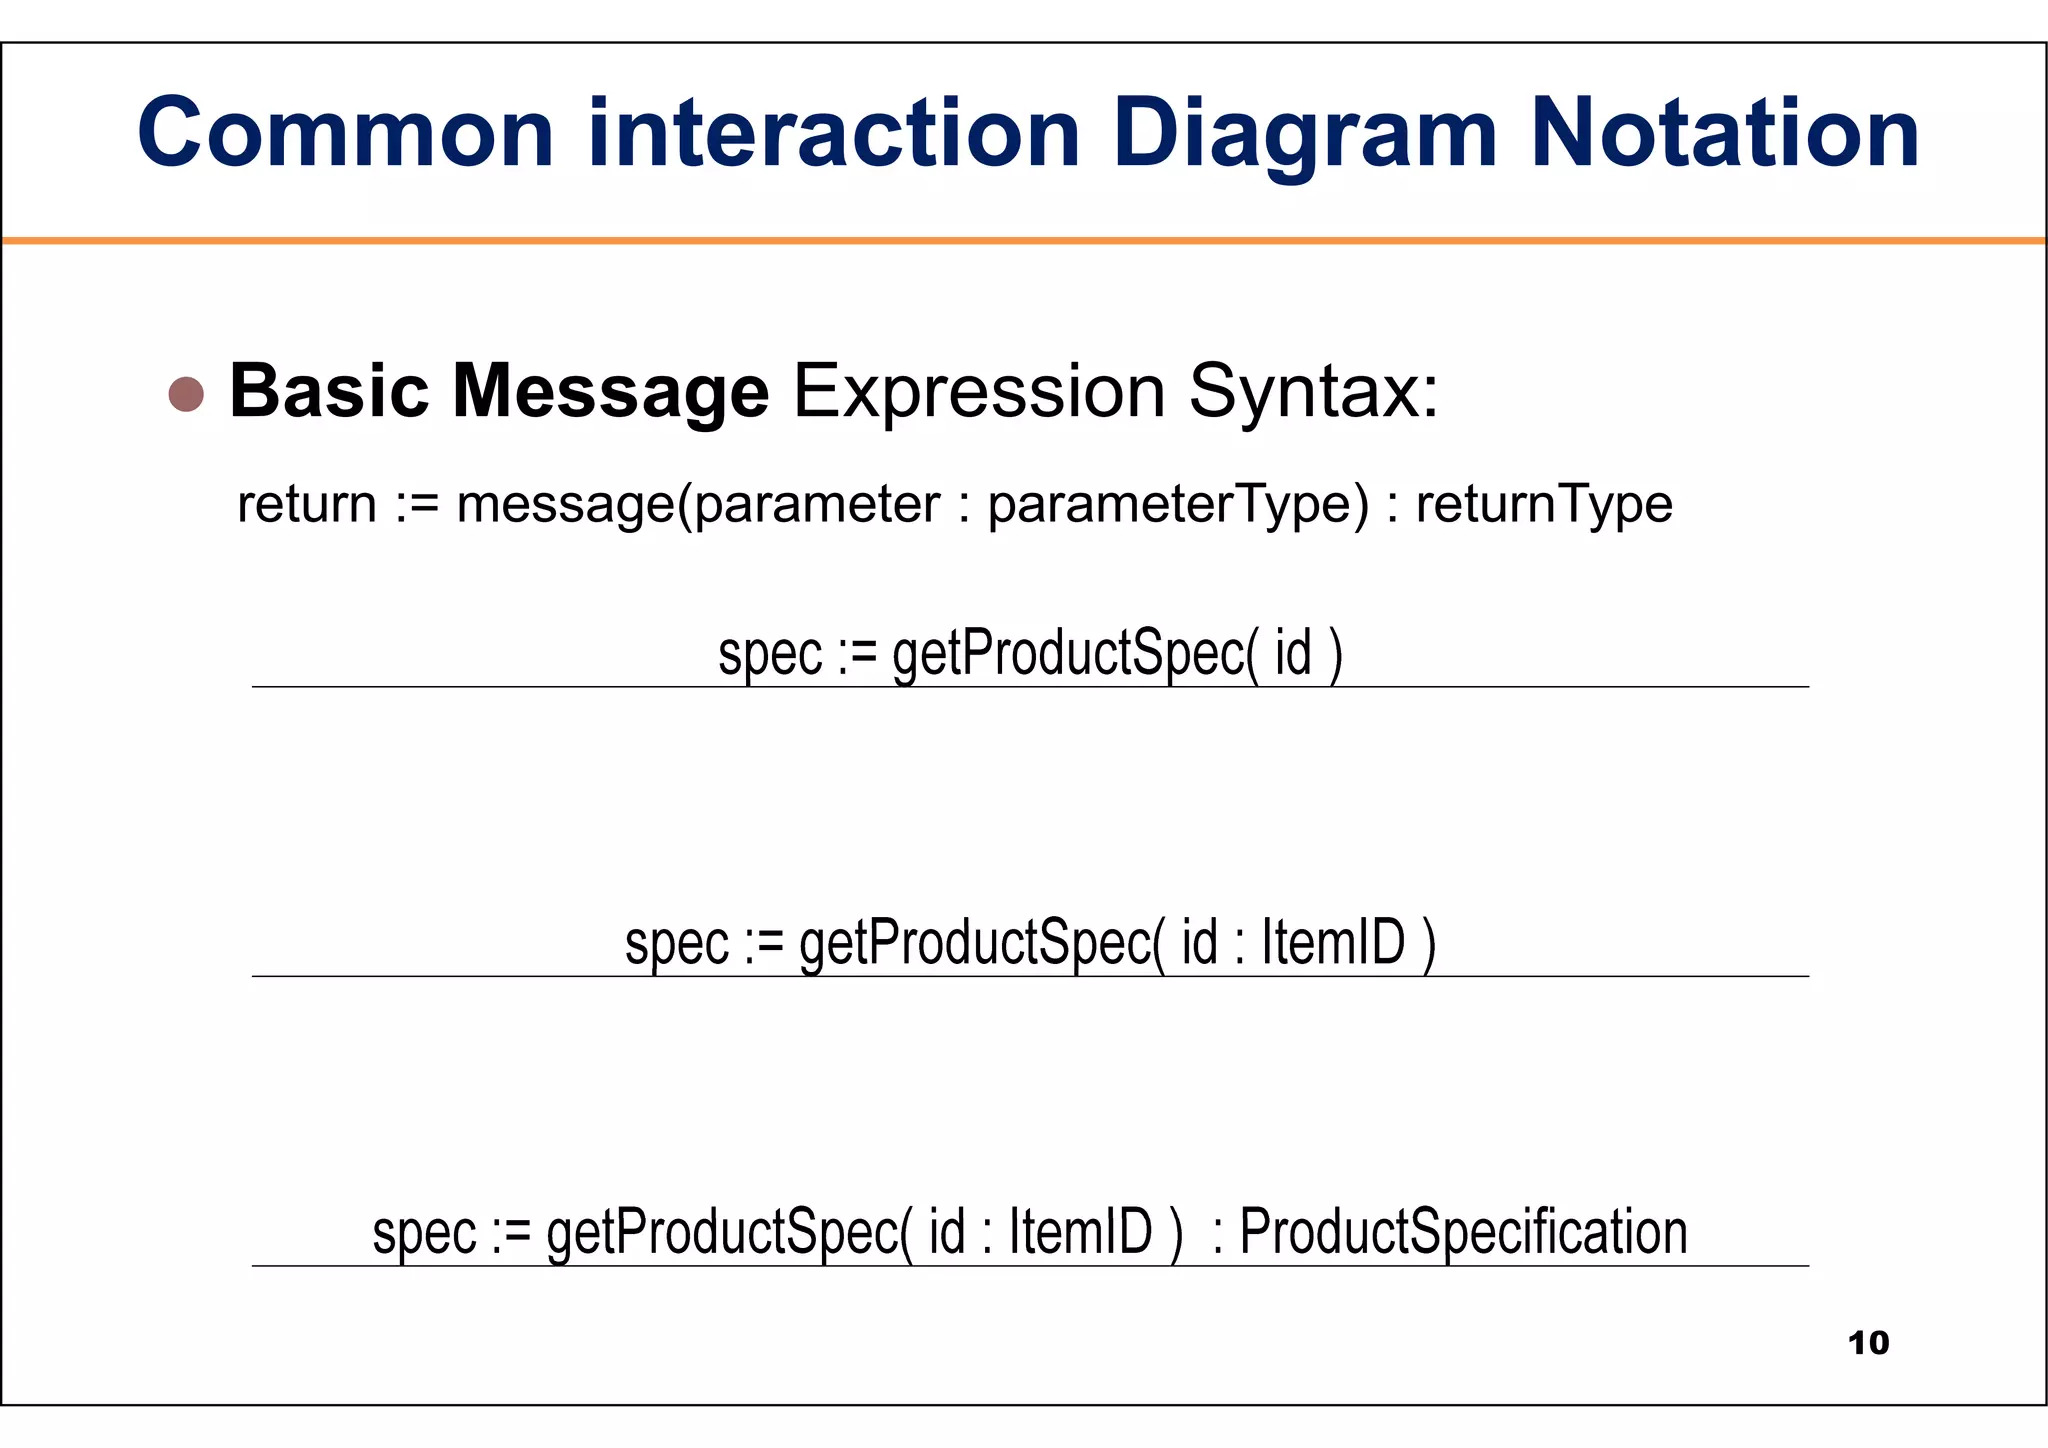
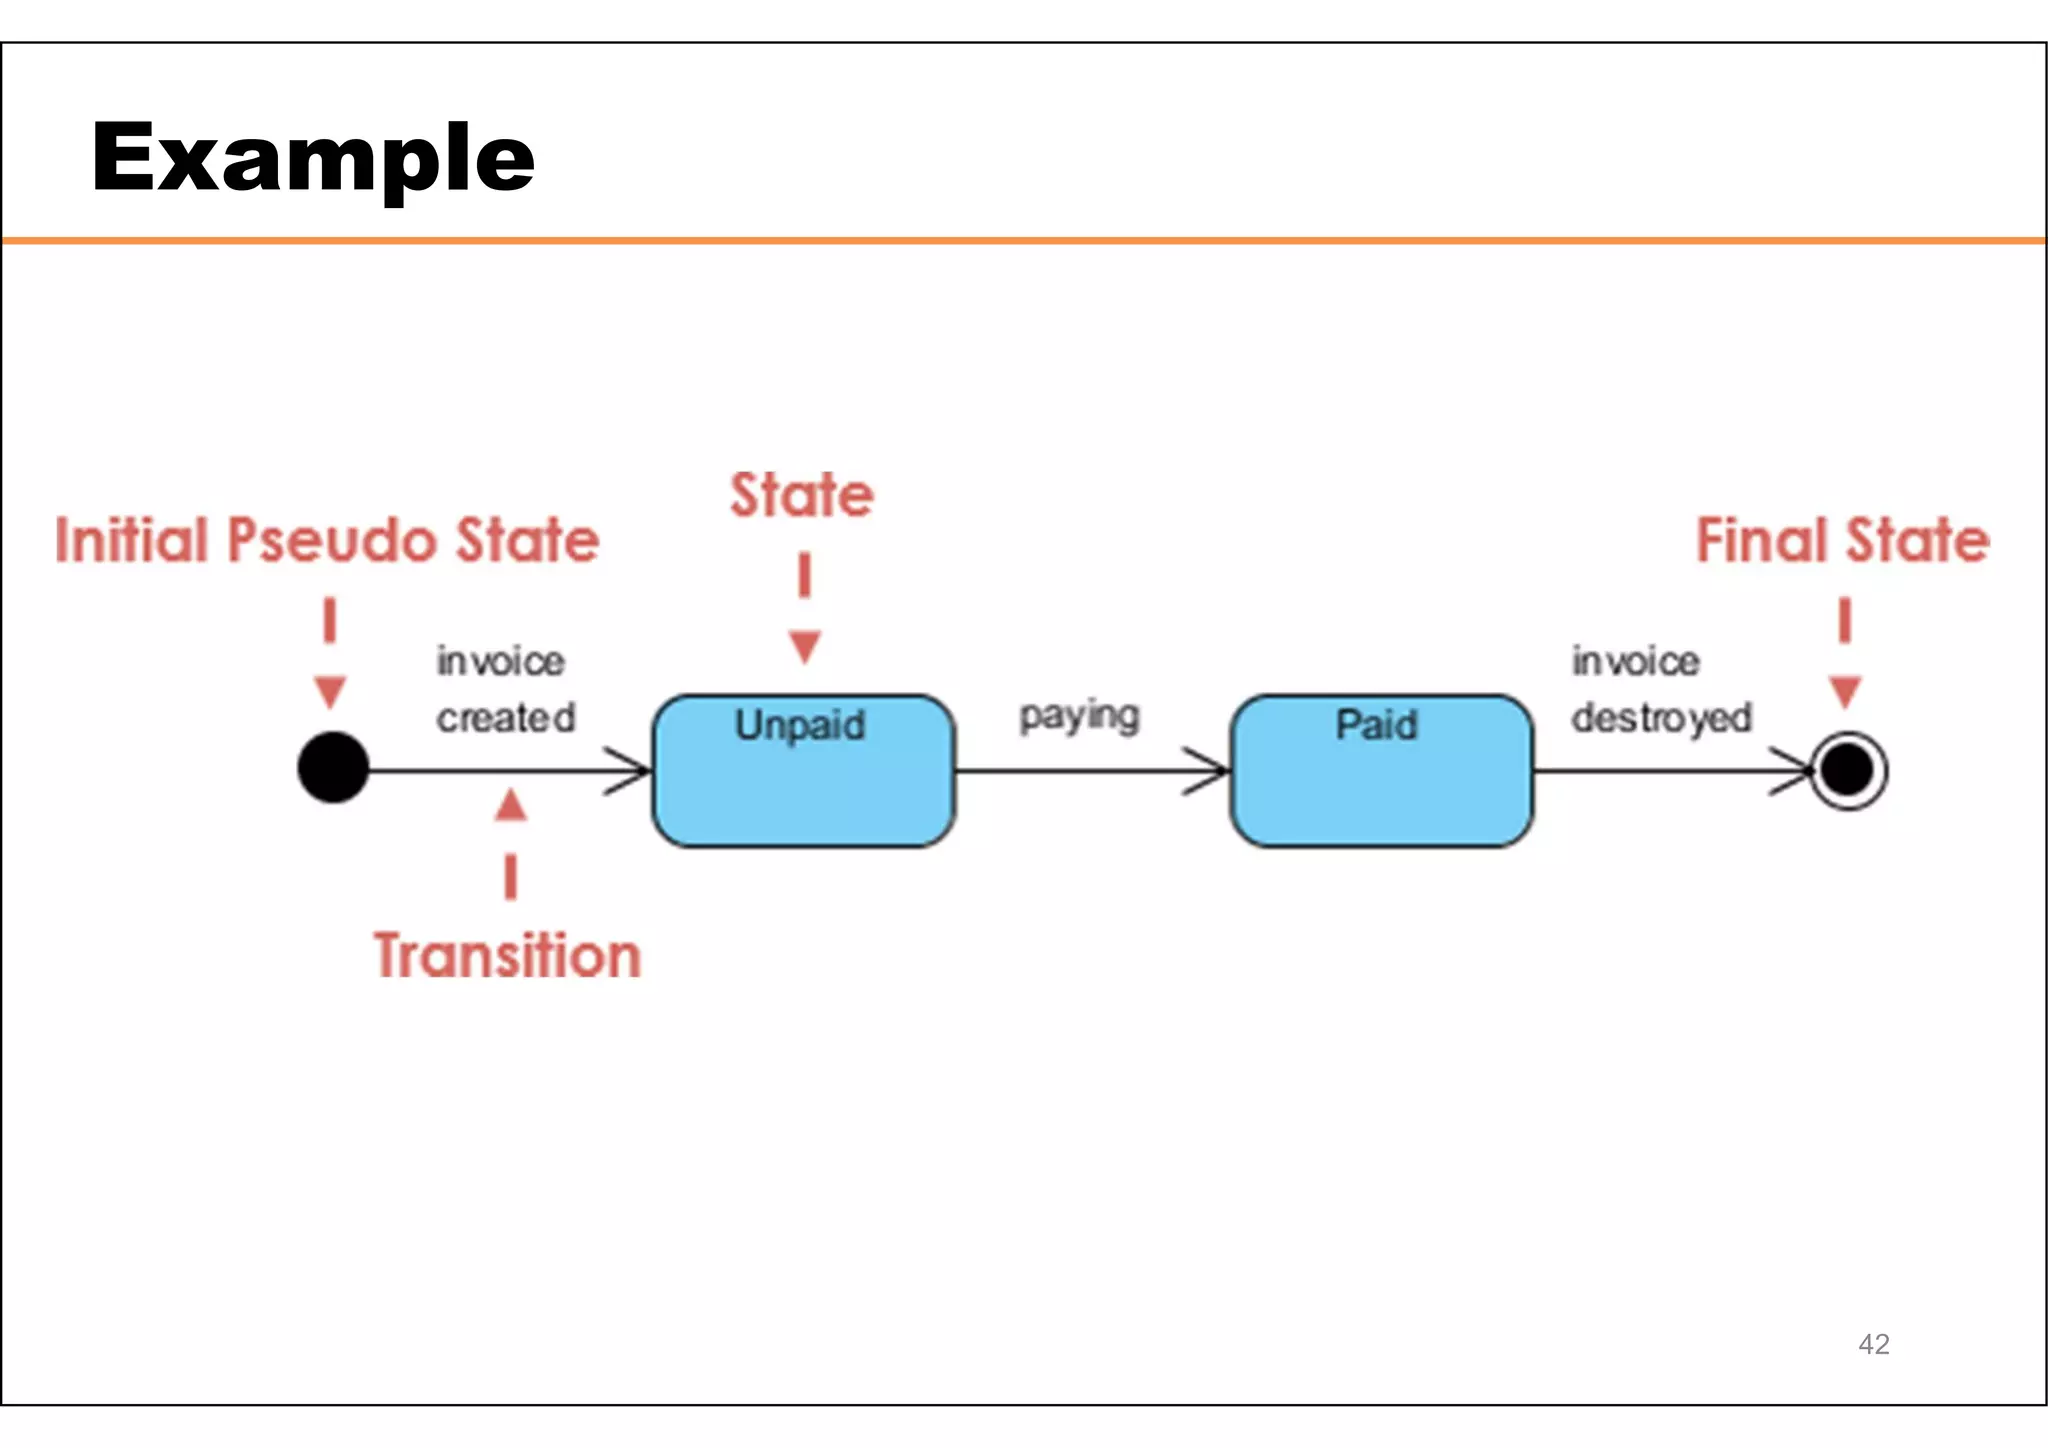
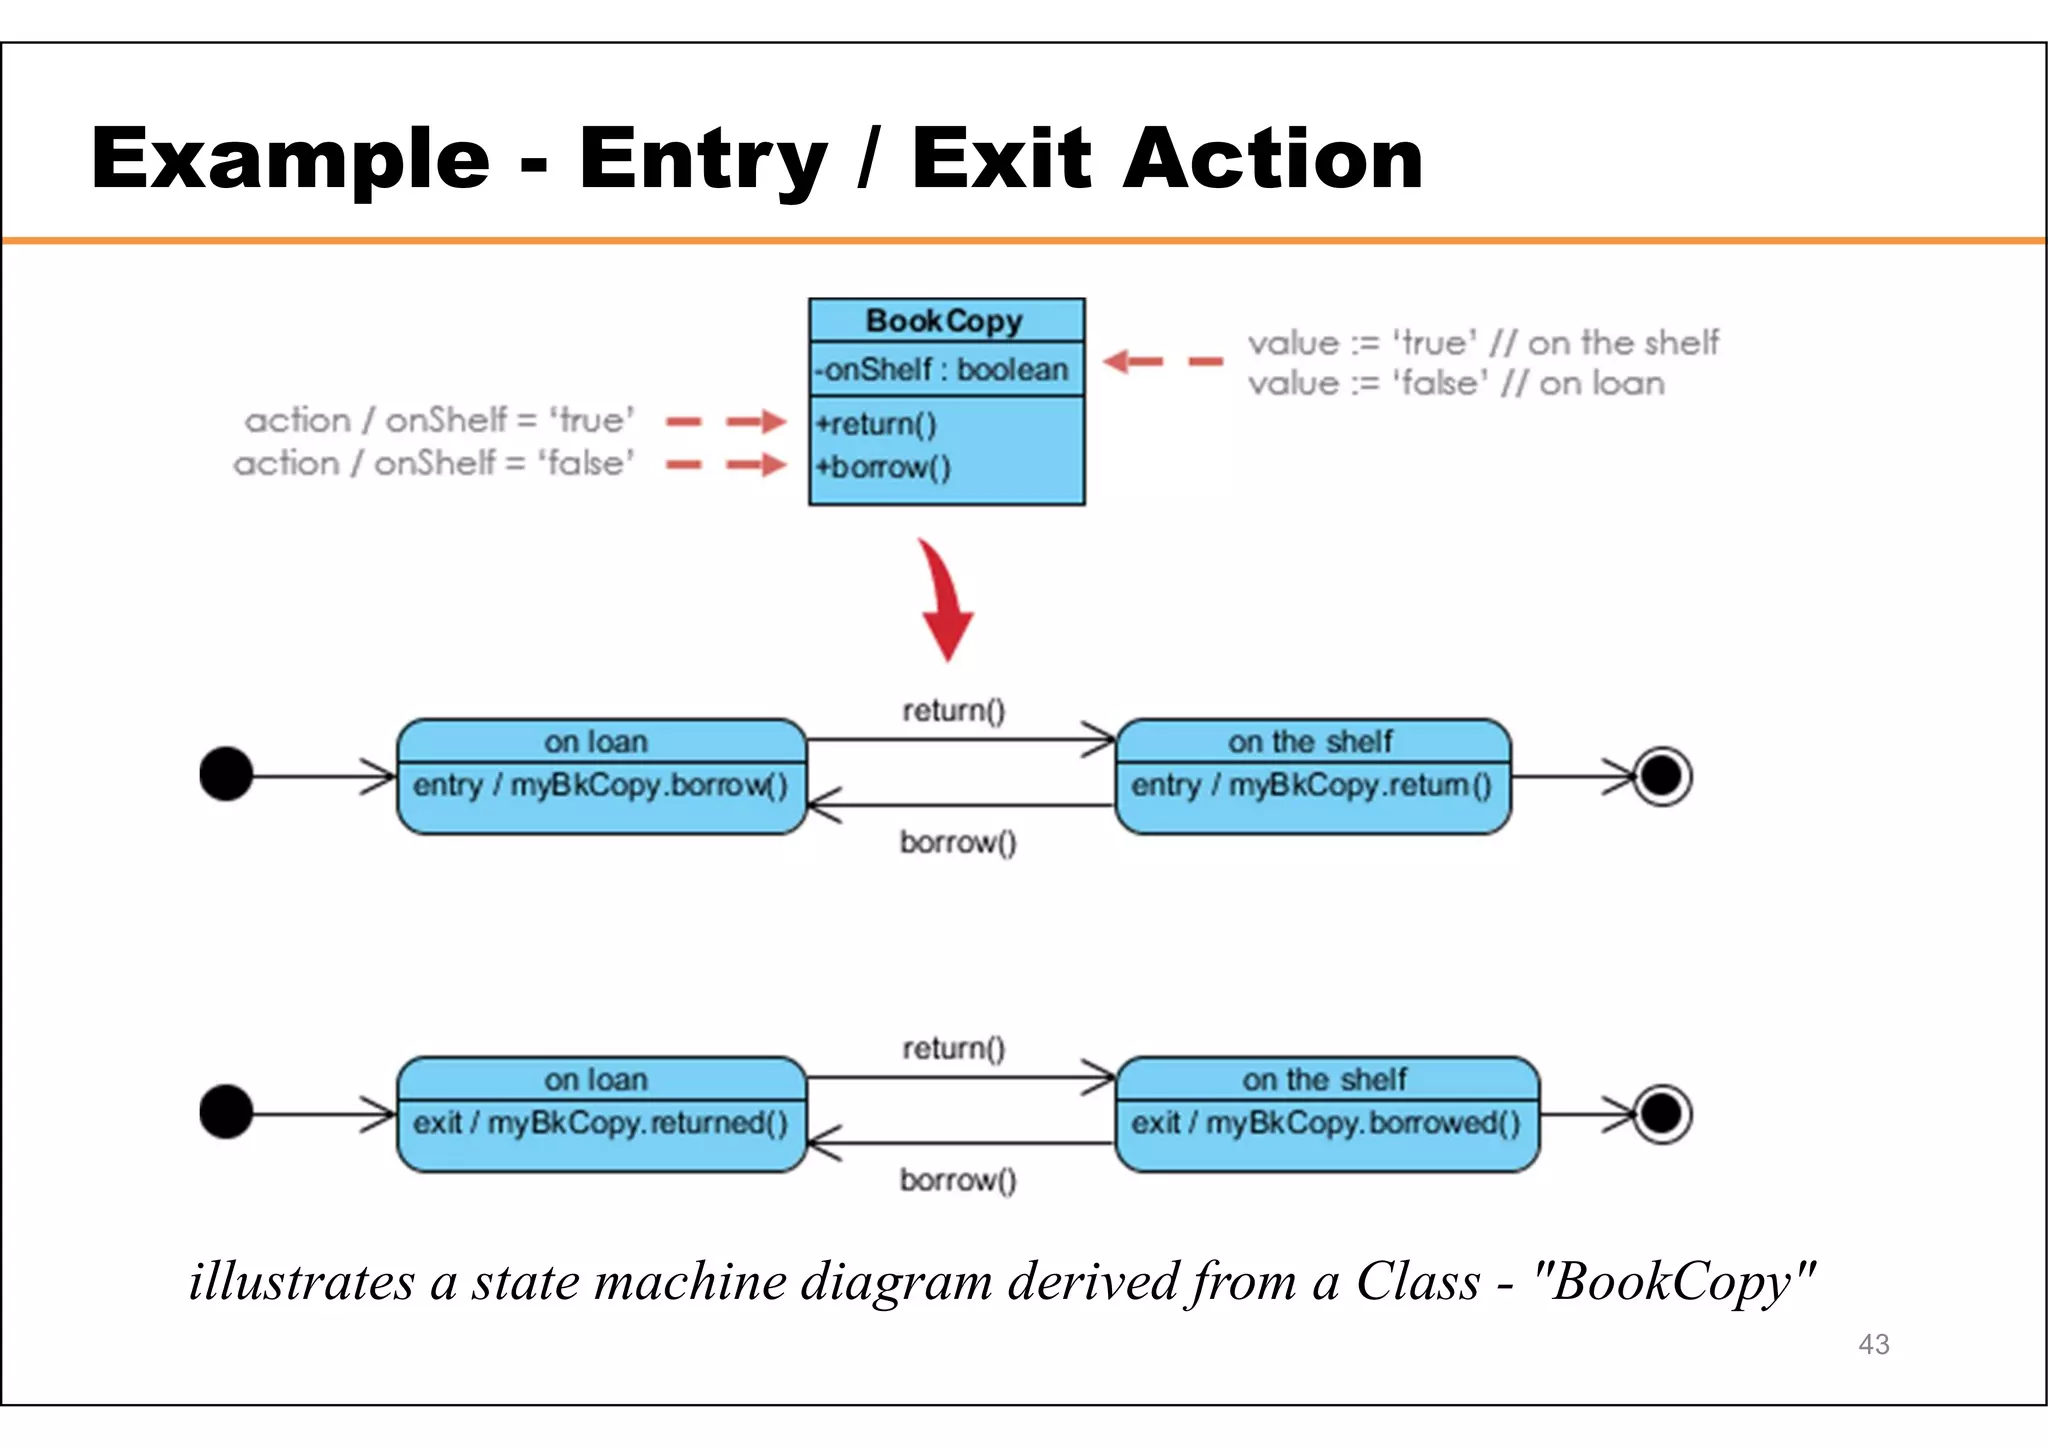
The document discusses various UML diagrams used for modeling dynamic and implementation aspects of software systems. It describes interaction diagrams like sequence diagrams and collaboration diagrams which are used to model object interactions. It also covers state machine diagrams and activity diagrams which are used to model dynamic system behavior. Finally, it discusses implementation diagrams like package diagrams, component diagrams, and deployment diagrams which are used to model system organization and deployment.