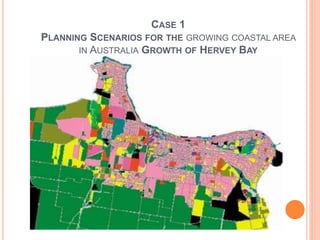
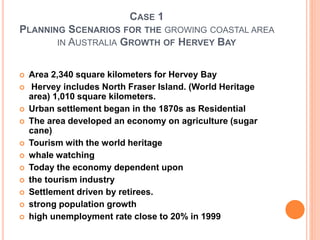
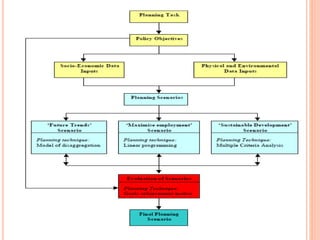
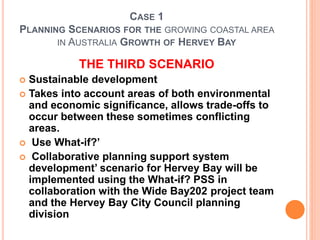
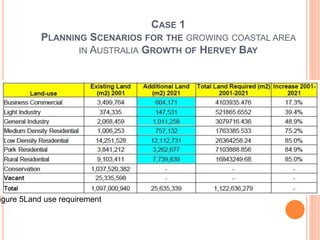
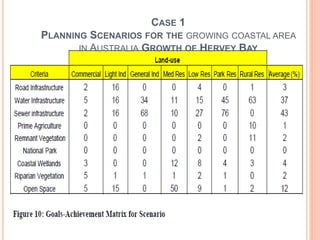
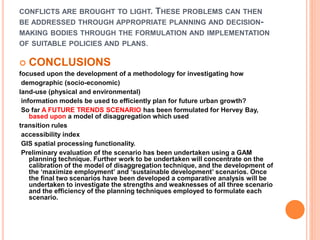
This document discusses three planning scenarios for managing urban growth in Hervey Bay, Australia:
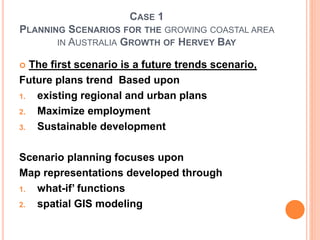
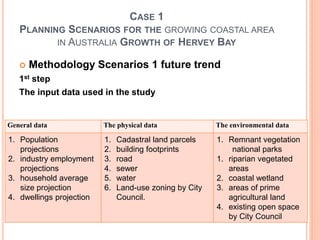
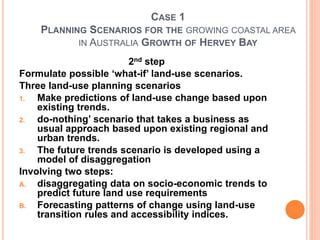
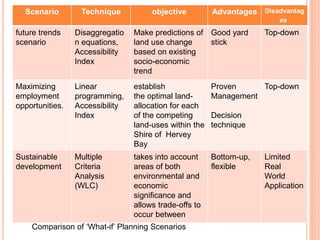
1. A future trends scenario based on existing plans and maximizing employment.
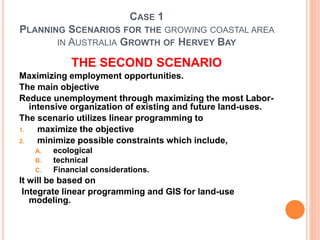
2. A scenario maximizing employment opportunities through a linear programming model.
3. A sustainable development scenario allowing trade-offs between environmental and economic areas.
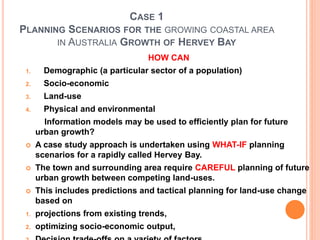
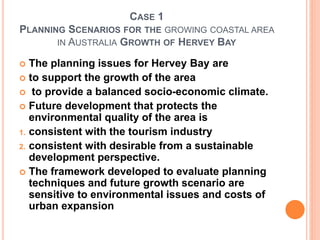
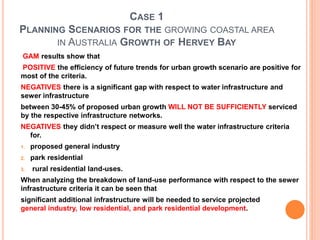
Demographic, socioeconomic, land use and environmental models are used to efficiently plan future growth. The scenarios are evaluated based on core objectives like employment, sustainability, and environmental protection.


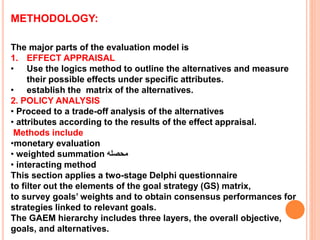
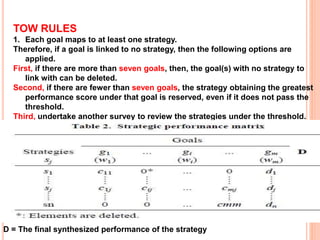
![1. CONSTRUCT AN INITIAL GS MATRIX.
Given m number of goals G = (g1, ..., gi, ..., gm) (m≥ 2) ,n number of
strategies S = (s1,..., sj, ..., sn) (n ≥ 2).
The elements of relation among goals and strategies are
shown in the GS matrix A = [aij]
2. UNDERTAKE THE FIRST DELPHI QUESTIONNAIRE SURVEY.
The questionnaire survey in this stage includes two sorts of data in the
GS matrix, i.e., m number of
goal’s weights W = [w1, ..., wi, ..., wm] (m ≥ 2), and the
relationship between the goal and strategy judged by q number of
interviewees. The interviewees need to decide if the strategy j can or
cannot reach goal i. If the interviewee f thinks that j strategy can achieve
i goal, then matrix element aij f (f = 1, 2, ..., q) gets one
point](https://image.slidesharecdn.com/goalachivementmaix-151220101436/85/Goal-achivement-matrix-53-320.jpg)