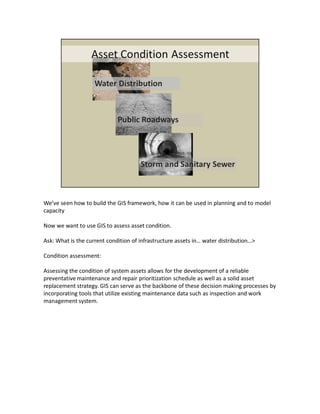
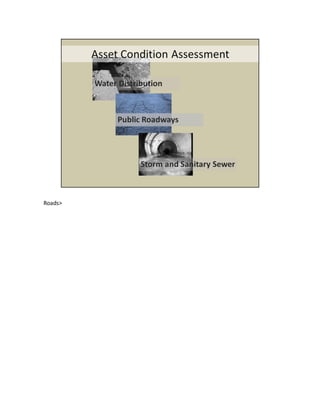
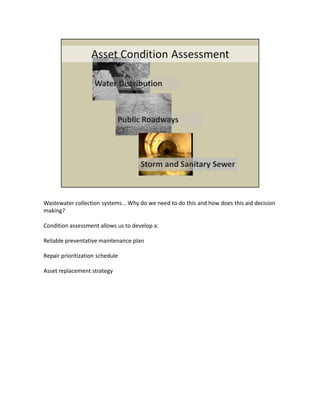
The document discusses how GIS can be used as an information backbone to support effective decision making. It provides examples of how GIS has been used for capacity analysis, capital improvements planning, and developing asset management strategies. Specifically, it describes how GIS data, modeling, and analytics can help infrastructure managers make informed decisions, minimize risks, and save time and expenses when planning maintenance and capital projects.
3D GIS brings enhanced depth into data collection and analysis by incorporating a z-value into mapping. Most commonly, that means including elevation data, but users have many options for adding layers of information.
While 3D models are more difficult to create and maintain than 2D ones, there are myriad 3D GIS applications where this technology is greatly beneficial.
The 3D-GIS in the Cloud main purpose is to evaluate the use-efficiency of both existing and planned spatial space.
DEFINITION :
GIS is a powerful set of tools for collecting, storing , retrieving at will, transforming and displaying spatial data from the real world for a particular set of purposes
APPLICATION AREAS OF GIS
Agriculture
Business
Electric/Gas utilities
Environment
Forestry
Geology
Hydrology
Land-use planning
Local government
Mapping
11. Military
12. Risk management
13. Site planning
14. Transportation
15. Water / Waste water industry
COMPONENTS OF GIS
DATA INPUT
SPATIAL DATA MODEL
Data Model:
It describes in an abstract way how the data is represented in an information system or in DBMS
Spatial Data Model :
The models or abstractions of reality that are intended to have some similarity with selected aspects of the real world
Creation of analogue and digital spatial data sets involves seven levels of model development and abstraction
SPATIAL DATA MODEL
Conceptual model : A view of reality
Analog model : Human conceptualization leads to analogue abstraction
Spatial data models : Formalization of analogue abstractions without any conventions
Database model : How the data are recorded in the computer
Physical computational model : Particular representation of the data structures in computer memory
Data manipulation model : Accepted axioms and rules for handling the data
SPATIAL DATA MODEL
SPATIAL DATA MODEL
Objects on the earth surface are shown as continuous and discrete objects in spatial data models
Types of data models
Raster data model
vector data models
RASTER DATA MODEL
Basic Elements :
Extent
Rows
Columns
Origin
Orientation
Resolution: pixel = grain = grid cell
Ex: Bit Map Image (BMP),Joint Photographic Expert Group (JPEG), Portable Network Graphics(PNG) etc
RASTER DATA MODEL
VECTOR DATA MODEL
Basic Elements:
Location (x,y) or (x,y,z)
Explicit, i.e. pegged to a coordinate system
Different coordinate system (and precision) require different values
o e.g. UTM as integer (but large)
o Lat, long as two floating point numbers +/-
Points are used to build more complex features
Ex: Auto CAD Drawing File(DWG), Data Interchange(exchange) File(DXF), Vector Product Format (VPF) etc
VECTOR DATA MODEL
RASTER vs VECTORRaster is faster but Vector is corrector
TESSELLATIONS OF CONTINUOUS FIELDS
Triangular Irregular Network: (TIN)
TIN is a vector data structure for representing geographical information that is continuous
Digital elevation model
TIN is generally used to create Digital Elevation Model (DEM)
DIGITAL ELEVATION MODEL
DATA STRUCTURES
Data structure tells about how the data is stored
Data organization in raster data structures
Each cell is referenced directly
Each overlay Is referenced directly
Each mapping unit is referenced directly
Each overlay is separate file with general header
This presentation is about the raster and vector data in GIS which is important and costly as well, through the presentation we will learn about both type of data.
Lisa McIntyre, Digital Asset Management Librarian at GSD&M, and Bob Canaway, CMO at Nuxeo present on the new use cases for digital asset management in the enterprise.
Remaining Agile with Billions of Documents: Appboy and Creative MongoDB SchemasMongoDB
In this talk, Appboy co-founder and CIO Jon Hyman will discuss various schemas that Appboy has evolved to use on MongoDB, remaining agile as Appboy has grown to massive scale. Jon will discuss topics such as random sampling of documents, multivariate testing and multi-arm bandit optimization of such tests, field tokenization, and how Appboy stores multi-dimensional data on an individual user basis to be able to quickly optimize for the best time to deliver messages to end users. Appboy is the global leader in Marketing Automation for Apps, helping clients such as Urban Outfitters, Shutterfly, Kixeye, PicsArt, USA Today Sports, and iHeartRadio increase engagement through automated messaging. Each month, Appboy collects tens of billions of data points from hundreds of millions of monthly active users.
Presentation given for the SQLPass community at SQLBits XIV in Londen. The presentation is an overview about the performance improvements provided to Hive with the Stinger initiative.
Real-time, Sensor-based Monitoring of Shipping Containersbenaam
This presentation describes a sensor-based solution for real-time monitoring of high-value assets in-transit so shippers can react quickly to unplanned events such as delays, cargo damage, and even thefts.
Selected as one of the best presentations at the 2012 Vail Computer Elements Workshop. For 42 years, this 4-day workshop has served leading architects of the computer industry. The agenda is 100% invited technical talks and the audience is mostly previous speakers.
Learn how to deconstruct what it means to be "Open," as well as how to engage developers, leverage users, and shape your data to make your platform ready for commercial use.
Presented April 14th, 2009, at BayCHI: http://www.baychi.org/calendar/20090414/
Hadoop & Greenplum: Why Do Such a Thing?Ed Kohlwey
Greenplum is using Hadoop in several interesting ways as part of a larger big data architecture with EMC Greenplum Database (a scale-out MPP SQL database) and EMC Isilon (a scale-out network-attached storage appliance). After a quick introduction of Greenplum Database and Isilon, I list some ways Greenplum is tightly integrating with Hadoop and why we would want to do such a thing. Integration points discussed include: Greenplum Database external tables to seamlessly access data in HDFS, querying HBase tables natively from Greenplum Database, Greenplum Database having its underlying storage on HDFS, and Isilon OneFS as a seamless replacement for HDFS.
This guide explains how to implement an Aruba 802.11n wireless network that must provide high-speed access to an auditorium-style room with 500 or more seats. Aruba Networks refers to such networks as high-density wireless LANs (HD WLANs). Lecture halls, hotel ballrooms, and convention centers are common examples of spaces with this requirement. Because the number of concurrent users on an AP is limited, to serve such a large number of devices requires access point (AP) densities well in excess of the usual AP per 2,500 – 5,000 ft2 (225 – 450 m2). Such coverage areas therefore have many special technical design challenges. This validated reference design provides the design principles, capacity planning methods, and physical installation knowledge needed to successfully deploy HD WLANs.
Best practice strategies to clean up and maintain your database with Hether G...Blackbaud Pacific
In this webinar Hether Ghelf, Blackbaud Pacific’s Senior Consultant & Project Manager, discusses a best practice approach to database cleaning and continued maintenance.
Cleansing your data can have an immediate impact on your business by increasing retention and response rates, decreasing the volume of mail returned from post, and ensuring mail is reaching your organisation’s constituents.
View the recording here: https://www.blackbaud.com.au/notforprofit-events/webinars/past
Sustainable Management Criteria BMP December 2017Val King
Presentation from Department of Water Resources review of criteria to support on-going development of groundwater sustainability plans. Important concepts around sustainability indicators.
This is a slidecast of our August lunch training session titled "The State of Sustainability in Southern California" which took place on August 25, 2011.
Chandra Krout, Principal of Krout and Associates, delivered an update on the current status of environmental planning occurring within Southern California, with a particular emphasis on climate change and adaptation.
BlueScape 2022 Update: CEQA Air Quality & Greenhouse Gas Impact Studies Webin...BlueScape
In 2022, developers completing an Environmental Impact Report (EIR) under the California Environmental Quality Act (CEQA) must complete Air Quality and Greenhouse Gas (GHG) impact technical studies to address the potential for significant environment impacts. In this webinar, you will learn about:
• Status in 2022 of the CEQA Guidelines, and local lead agency air quality and GHG analysis guidelines;
• When Air Quality and Greenhouse Gas technical studies must be completed under CEQA, or as otherwise required by reviewing agencies;
• Project strategies; working with agencies and the public through the process;
• Types of projects and air emission sources, the construction and operation phases, analysis types, and information needs;
• Pollutant types and typical CEQA air quality and GHG analysis significance thresholds;
• Difference between Project Design Elements and Mitigation;
• Typical air quality and GHG mitigation requirements: How to address mitigation and monitoring;
• How to review project alternatives and cumulative impacts with other projects;
• The role of California air districts in CEQA review and relationship to other actions such as air permitting;
• Special non-CEQA analysis cases, such as projects near schools and freeways;
• 2022 update on software tools and guidance documents, including CalEEMod, EMFAC, AERMOD, and HARP2;
• Elements of CEQA Air Quality and Greenhouse Gas technical study reports;
• An example Case Study.
About the instructor:
James A. Westbrook is the President of BlueScape Environmental, with over 30 years of experience completing CEQA Air Quality and Greenhouse Gas technical studies. He has led this type of work for the development of transmission lines, renewable energy farms, petroleum refinery expansion, power plants, manufacturing, landfills, rail expansion, airports, highways, seaports, retail centers, schools, and multifamily housing.
Eastern Panhandle GIS Users Group Meeting held on 14 September 2016 in Martinsburg, WV. Presenters Kathryn Wesson & Margaret Markham, Chesapeake Conservancy
Chesapeake Bay Watershed Implementation Planning ProcessMarti Donley
Presentation given May 16, 2011 by Asst. Secretary of Natural Resources Anthony Moore to GWRC Board of Directors.
In the above presentation, Asst. Secretary Moore discussed the State’s Watershed Implementation Plan process to comply with the federal Chesapeake Bay TMDL. The State has asked all 16 PDCs in the Chesapeake Bay watershed (including GWRC) to consider assisting the Va. Dept. of Conservation and Recreation by supporting “Community Conservation Information (CCI)” review by local governments and SWCDs of input data (i.e. land cover and installed Best Management Practices) and the preliminary local Total Maximum Daily Load (TMDL) allocations from the Chesapeake Bay Water Quality Model developed by the US EPA and other federal agencies. A meeting was held on May 17th with local storm water management program staff, environmental planners, representatives of the Hanover-Caroline SWCD and Tri-County/City SWCD, the Rappahannock River Basin Commission and the Friends of the Rappahannock to hear a presentation by DCR staff and discuss the merits of regional coordination of the WIP/TMDL data review process. The group consensus was that regional facilitation of the review had merit, but the selection of implementation measures and investments should be developed locally.
DCR staff have indicated that revised Chesapeake Bay Water Quality model results are anticipated in late June 2011 that will reflect enhancements to the model and the resulting revised TMDL allocation data will be distributed to local governments, SWCDs and PDCs. The State is developing also an on-line tool to facilitate the sensitivity testing of the effect of changing the inventory and mix of BMPs that exist in each community to help communities prioritize where to place implementation program emphasis based on the pollution reduction goals they are assigned in the WIP process.
This presentation was given on 26.11.15 at the Catchment Management Network Meeting in Tullamore.
The day included presentations on the approach to characterisation for the 2nd Cycle of the Water Framework Directive and how this would involve both the EPA and Local Authorities, along with other public bodies.
A key focus was the new Local Authority Water and Communities Office and its role in the 2nd cycle.
Presentations on integrating planning and the WFD, the UK 'Love Your River Telford' project and 'The Living Loobagh' from Limerick were also included.
Dev Dives: Train smarter, not harder – active learning and UiPath LLMs for do...UiPathCommunity
💥 Speed, accuracy, and scaling – discover the superpowers of GenAI in action with UiPath Document Understanding and Communications Mining™:
See how to accelerate model training and optimize model performance with active learning
Learn about the latest enhancements to out-of-the-box document processing – with little to no training required
Get an exclusive demo of the new family of UiPath LLMs – GenAI models specialized for processing different types of documents and messages
This is a hands-on session specifically designed for automation developers and AI enthusiasts seeking to enhance their knowledge in leveraging the latest intelligent document processing capabilities offered by UiPath.
Speakers:
👨🏫 Andras Palfi, Senior Product Manager, UiPath
👩🏫 Lenka Dulovicova, Product Program Manager, UiPath
Builder.ai Founder Sachin Dev Duggal's Strategic Approach to Create an Innova...Ramesh Iyer
In today's fast-changing business world, Companies that adapt and embrace new ideas often need help to keep up with the competition. However, fostering a culture of innovation takes much work. It takes vision, leadership and willingness to take risks in the right proportion. Sachin Dev Duggal, co-founder of Builder.ai, has perfected the art of this balance, creating a company culture where creativity and growth are nurtured at each stage.
Epistemic Interaction - tuning interfaces to provide information for AI supportAlan Dix
Paper presented at SYNERGY workshop at AVI 2024, Genoa, Italy. 3rd June 2024
https://alandix.com/academic/papers/synergy2024-epistemic/
As machine learning integrates deeper into human-computer interactions, the concept of epistemic interaction emerges, aiming to refine these interactions to enhance system adaptability. This approach encourages minor, intentional adjustments in user behaviour to enrich the data available for system learning. This paper introduces epistemic interaction within the context of human-system communication, illustrating how deliberate interaction design can improve system understanding and adaptation. Through concrete examples, we demonstrate the potential of epistemic interaction to significantly advance human-computer interaction by leveraging intuitive human communication strategies to inform system design and functionality, offering a novel pathway for enriching user-system engagements.
GraphRAG is All You need? LLM & Knowledge GraphGuy Korland
Guy Korland, CEO and Co-founder of FalkorDB, will review two articles on the integration of language models with knowledge graphs.
1. Unifying Large Language Models and Knowledge Graphs: A Roadmap.
https://arxiv.org/abs/2306.08302
2. Microsoft Research's GraphRAG paper and a review paper on various uses of knowledge graphs:
https://www.microsoft.com/en-us/research/blog/graphrag-unlocking-llm-discovery-on-narrative-private-data/
Kubernetes & AI - Beauty and the Beast !?! @KCD Istanbul 2024Tobias Schneck
As AI technology is pushing into IT I was wondering myself, as an “infrastructure container kubernetes guy”, how get this fancy AI technology get managed from an infrastructure operational view? Is it possible to apply our lovely cloud native principals as well? What benefit’s both technologies could bring to each other?
Let me take this questions and provide you a short journey through existing deployment models and use cases for AI software. On practical examples, we discuss what cloud/on-premise strategy we may need for applying it to our own infrastructure to get it to work from an enterprise perspective. I want to give an overview about infrastructure requirements and technologies, what could be beneficial or limiting your AI use cases in an enterprise environment. An interactive Demo will give you some insides, what approaches I got already working for real.
Neuro-symbolic is not enough, we need neuro-*semantic*Frank van Harmelen
Neuro-symbolic (NeSy) AI is on the rise. However, simply machine learning on just any symbolic structure is not sufficient to really harvest the gains of NeSy. These will only be gained when the symbolic structures have an actual semantics. I give an operational definition of semantics as “predictable inference”.
All of this illustrated with link prediction over knowledge graphs, but the argument is general.
State of ICS and IoT Cyber Threat Landscape Report 2024 previewPrayukth K V
The IoT and OT threat landscape report has been prepared by the Threat Research Team at Sectrio using data from Sectrio, cyber threat intelligence farming facilities spread across over 85 cities around the world. In addition, Sectrio also runs AI-based advanced threat and payload engagement facilities that serve as sinks to attract and engage sophisticated threat actors, and newer malware including new variants and latent threats that are at an earlier stage of development.
The latest edition of the OT/ICS and IoT security Threat Landscape Report 2024 also covers:
State of global ICS asset and network exposure
Sectoral targets and attacks as well as the cost of ransom
Global APT activity, AI usage, actor and tactic profiles, and implications
Rise in volumes of AI-powered cyberattacks
Major cyber events in 2024
Malware and malicious payload trends
Cyberattack types and targets
Vulnerability exploit attempts on CVEs
Attacks on counties – USA
Expansion of bot farms – how, where, and why
In-depth analysis of the cyber threat landscape across North America, South America, Europe, APAC, and the Middle East
Why are attacks on smart factories rising?
Cyber risk predictions
Axis of attacks – Europe
Systemic attacks in the Middle East
Download the full report from here:
https://sectrio.com/resources/ot-threat-landscape-reports/sectrio-releases-ot-ics-and-iot-security-threat-landscape-report-2024/
Software Delivery At the Speed of AI: Inflectra Invests In AI-Powered QualityInflectra
In this insightful webinar, Inflectra explores how artificial intelligence (AI) is transforming software development and testing. Discover how AI-powered tools are revolutionizing every stage of the software development lifecycle (SDLC), from design and prototyping to testing, deployment, and monitoring.
Learn about:
• The Future of Testing: How AI is shifting testing towards verification, analysis, and higher-level skills, while reducing repetitive tasks.
• Test Automation: How AI-powered test case generation, optimization, and self-healing tests are making testing more efficient and effective.
• Visual Testing: Explore the emerging capabilities of AI in visual testing and how it's set to revolutionize UI verification.
• Inflectra's AI Solutions: See demonstrations of Inflectra's cutting-edge AI tools like the ChatGPT plugin and Azure Open AI platform, designed to streamline your testing process.
Whether you're a developer, tester, or QA professional, this webinar will give you valuable insights into how AI is shaping the future of software delivery.
23. Basin 1 Union Zoning Basin Total Acres Average Impervious Soil B-2 1 5.6112 0.7000 C PI 1 0.9101 0.3000 C R-1 1 49.5925 0.4200 C R-2 1 1.2338 0.4200 C RB-1 1 1.7194 0.5000 C WC 1 3.0609 0.7000 C
51. Governmental Accounting Standards Board – Statement 34 (GASB 34) National Pollutant Discharge Elimination System (NPDES) Regulatory Compliance
52. Governmental Accounting Standards Board – Statement 34 Accounting Regulation Requires: Assess Valuation and Depreciation Goal: Transparency GIS Can Facilitate assessment of condition to determine value and depreciation GASB 34
53. National Pollutant Discharge Elimination System Requires: Manage and monitor pollutant discharge Goal: Water quality GIS Can Map It! Manage Asset Inspections Manage Asset Monitoring NPDES
54. PACP Pipeline Assessment Certification Program WRC Water Resource Centre PCI Pavement Condition Index Home Baked Assessment Measuring Systems