

Recommended
More Related Content
What's hot
What's hot (20)
Similar to Weekly market report
Similar to Weekly market report (20)
More from QNB Group
More from QNB Group (20)
Recently uploaded
Recently uploaded (20)
Weekly market report
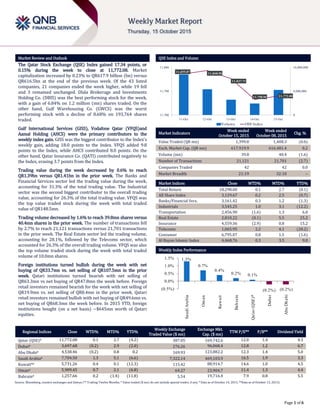
- 1. ` Page 1 of 6 Market Review and Outlook QSE Index and Volume The Qatar Stock Exchange (QSE) Index gained 17.34 points, or 0.15% during the week to close at 11,772.08. Market capitalization increased by 0.23% to QR617.9 billion (bn) versus QR616.5bn at the end of the previous week. Of the 43 listed companies, 21 companies ended the week higher, while 19 fell and 3 remained unchanged. Dlala Brokerage and Investments Holding Co. (DBIS) was the best performing stock for the week, with a gain of 6.84% on 1.2 million (mn) shares traded. On the other hand, Gulf Warehousing Co. (GWCS) was the worst performing stock with a decline of 8.68% on 193,764 shares traded. Gulf International Services (GISS), Vodafone Qatar (VFQS)and Aamal Holding (AHCS) were the primary contributors to the weekly index gain. GISS was the biggest contributor to the Index’s weekly gain, adding 18.0 points to the Index. VFQS added 9.8 points to the Index, while AHCS contributed 8.0 points. On the other hand, Qatar Insurance Co. (QATI) contributed negatively to the Index, erasing 3.7 points from the Index. Trading value during the week decreased by 0.6% to reach QR1.39bn versus QR1.41bn in the prior week. The Banks and Financial Services sector led the trading value during the week, accounting for 31.3% of the total trading value. The Industrial sector was the second biggest contributor to the overall trading value, accounting for 26.3% of the total trading value. VFQS was the top value traded stock during the week with total traded value of QR148.5mn. Trading volume decreased by 1.6% to reach 39.8mn shares versus 40.4mn shares in the prior week. The number of transactions fell by 2.7% to reach 21,121 transactions versus 21,701 transactions in the prior week. The Real Estate sector led the trading volume, accounting for 28.1%, followed by the Telecoms sector, which accounted for 26.3% of the overall trading volume. VFQS was also the top volume traded stock during the week with total traded volume of 10.0mn shares. Foreign institutions turned bullish during the week with net buying of QR33.7mn vs. net selling of QR107.5mn in the prior week. Qatari institutions turned bearish with net selling of QR63.3mn vs net buying of QR47.8mn the week before. Foreign retail investors remained bearish for the week with net selling of QR19.9mn vs. net selling of QR8.4mn in the prior week. Qatari retail investors remained bullish with net buying of QR49.6mn vs. net buying of QR68.3mn the week before. In 2015 YTD, foreign institutions bought (on a net basis) ~$645mn worth of Qatari equities. Market Indicators Week ended October 15, 2015 Week ended October 08, 2015 Chg. % Value Traded (QR mn) 1,399.8 1,408.3 (0.6) Exch. Market Cap. (QR mn) 617,919.9 616,481.4 0.2 Volume (mn) 39.8 40.4 (1.6) Number of Transactions 21,121 21,701 (2.7) Companies Traded 42 42 0.0 Market Breadth 21:19 32:10 – Market Indices Close WTD% MTD% YTD% Total Return 18,298.00 0.1 2.7 (0.1) All Share Index 3,129.67 0.2 2.5 (0.7) Banks/Financial Svcs. 3,161.42 0.3 1.2 (1.3) Industrials 3,545.25 1.0 3.1 (12.2) Transportation 2,456.90 (1.6) 1.3 6.0 Real Estate 2,810.22 (0.1) 5.5 25.2 Insurance 4,559.36 (2.9) 0.8 15.2 Telecoms 1,065.95 2.2 4.1 (28.2) Consumer 6,795.07 0.8 1.5 (1.6) Al Rayan Islamic Index 4,468.76 0.3 3.5 9.0 Market Indices Weekly Index Performance Regional Indices Close WTD% MTD% YTD% Weekly Exchange Traded Value ($ mn) Exchange Mkt. Cap. ($ mn) TTM P/E** P/B** Dividend Yield Qatar (QSE)* 11,772.08 0.1 2.7 (4.2) 387.05 169,742.6 12.0 1.4 4.3 Dubai# 3,697.68 (0.2) 2.9 (2.0) 276.26 96,068.4 12.8 1.2 6.7 Abu Dhabi# 4,538.46 (0.2) 0.8 0.2 169.93 123,882.2 12.3 1.4 5.0 Saudi Arabia# 7,784.50 1.3 5.1 (6.6) 7,322.14 469,103.9 16.5 1.9 3.3 Kuwait## 5,731.26 0.4 0.1 (12.3) 115.42 88,914.7 14.6 1.0 4.5 Oman# 5,909.45 0.7 2.1 (6.8) 64.27 23,904.7 11.4 1.3 4.4 Bahrain# 1,257.66 0.2 (1.4) (11.8) 5.54 19,716.4 7.9 0.8 5.5 Source: Bloomberg, country exchanges and Zawya (** Trailing Twelve Months; * Value traded ($ mn) do not include special trades, if any; # Data as of October 14, 2015, ##Data as of October 13, 2015) 11,855.87 11,868.90 11,837.71 11,758.96 11,772.08 0 8,000,000 16,000,000 11,700 11,790 11,880 11-Oct 12-Oct 13-Oct 14-Oct 15-Oct Volume QSEIndex 1.3% 0.7% 0.4% 0.2% 0.1% (0.2%) (0.2%)(0.5%) 0.0% 0.5% 1.0% 1.5% SaudiArabia Oman Kuwait Bahrain Qatar(QSE)* Dubai AbuDhabi
- 2. Page 2 of 6 News Market & Corporate News QIBK’s 3Q2015 QoQ net income growth driven by strong fees, cost control and lower investment provisions – Qatar Islamic Bank (QIBK) reported a net profit of QR515.24mn in 3Q2015, gaining by 4.2% QoQ (+27.3% YoY), in-line with our estimate of QR494.01mn (+4.3% variation) vs. BBG consensus of QR487.25mn. The bank generated net interest and investment income of QR708.78mn, also in-line with our estimate (QR705.05mn). Net interest and investment income declined by 3.3% QoQ (+24.5% YoY). The QoQ appreciation in net income was aided by robust fees & commissions (+24.2% and +38.1% QoQ and YoY, respectively), cost control (opex down by 2.6% QoQ while the cost to income ratio improved to 29.1% vs. 29.9% and 32.9% in 2Q2015 and 3Q2014, respectively) and lower investment provisions (down 18.0% QoQ). QIBK’s net loans expanded by 7.1% QoQ (+37.5% YTD) to 82.05bn while deposits gained by 2.2% QoQ (+30.1% YTD) to 86.63bn. As such QIBK’s LDR moved to 95% vs. 90% in 2Q2015 (101% in 3Q2014). The bank’s NPL ratio improved to 0.7% vs. 0.9% at the end of 2014. Moreover QIBK’s coverage ratio also improved to 106% vs. 94% at the end of 2014. QIBK’s CAR stood at 14.2% at the end of 3Q2015. (QNBFS Research, Company Financials) QIBK mandate banks to arrange investor meetings for Sukuk program – Qatar Islamic Bank (QIBK) has mandated Barwa Bank, Citi, HSBC, Noor Bank, QInvest and Standard Chartered Bank as Joint Lead Managers to arrange a series of fixed income investor meetings in Asia, Middle East and Europe commencing on October 16, 2015. A benchmark USD Regulation S Senior Sukuk offering under the existing QIBK Sukuk Ltd $1.5bn Trust Certificate Issuance Program may follow subject to market conditions. (QSE) ABQK 3Q2015 bottom-line slips QoQ due to muted investment gains and flat net interest income, in-line with our estimate – Ahli Bank (ABQK) reported a net profit of QR166.59mn in 3Q2015, declining marginally by 1.7% QoQ (+7.2% YoY). Earnings were in-line with our estimate of QR160.46mn (+3.8% variation). The marginal decline in the sequential net profit was mainly due to drop in income from investment securities to QR1.33mn vs. 18.82mn in 2Q2015. The net interest income was largely flat at QR185.15mn (-3.8% YoY). The bank’s total assets grew by 2.6% YTD (down 3.3% QoQ) to QR32.2bn in 3Q2015. ABQK’s loans & advances grew by 5.2% YTD (up 0.5% QoQ) to QR22.43bn, while customer deposits rose 6.8% YTD (down 1.9% QoQ) to QR21.25bn. (QNBFS Research, Company Financials) MRDS reports a flat bottom-line in 3Q2015 on a sequential basis – Mazaya Qatar Real Estate Development Co. (MRDS) reported a flat net profit of QR33.23mn in 3Q2015 compared to QR33.24mn in 2Q2015. However, the net profit rose marginally by 0.6% YoY. EPS amounted to QR0.32 in 3Q2015 as compared to QR0.31 in 2Q2015. The company’s construction revenue jumped 49.8% QoQ to QR80.2mn (up 4.4% YoY) in 3Q2015. However, the gain in the construction revenue was almost entirely offset by increased construction costs (QR44.1mn in 3Q2015 vs. QR18.5mn in 2Q2015). As a result, income from operations marginally inched up to QR46.3mn in 3Q2015 compared to QR45.6mn in 2Q2015. However, it declined 11.4% on a YoY basis. (QSE, QNBFS Research) MRDS considering possibility of increasing capital –Mazaya Qatar Real Estate Development Co. (MRDS) in its board meeting showed the intention to study the increase in capital of the company and requested the executive management to examine the possibility of increasing the company’s capital and provide the board with the required procedures and available options for further discussion. (QSE) Kahramaa hikes water, electricity tariffs – The Qatar General Electricity and Water Corporation (Kahramaa) has hiked water and electricity charges with effect from September 2015. Consumers were surprised to receive the "inflated bills" in October since there was no prior notification from Kahramaa about the increase. However, the September bill which the consumers received this month carried a note saying "The tariff has been revised from September 2015". According to sources, the water tariff which remained the same at QR4.40 per cubic meter for consumers big and small earlier has been replaced by a slab system, whereby customers will be charged on the basis of their consumption. Customers still have to pay only QR4.40 per cubic meter for up to 20 cubic meters of water. Those who consume more will have to pay according to the following slab: QR5.40 per cubic meter for 20 -50 cubic meters, QR6.40 for 50- 100 and QR7.40 for 100- 150 cubic meters. For electricity also a similar hike has been applied. While the tariffs differed only after 4,000 kilowatt per hour (kwh) earlier, now the minimum rate of QR0.08/kwh is applicable only to consumption up to 2,000 kwh. Thereafter, the revised rate of QR0.09/kwh will be charged up to consumption of 4,000kwh. Those using more than 4,000kwh will have to pay QR0.10 per additional unit. There are additional slabs for every 2,000kwh. Moreover, it is understood that villa compounds and workers accommodations, mainly large labor camps, may have to pay more as the combined use of electricity and water in such places would attract higher rates than in individual residential units. (Gulf-Times.com) QNB Group in preliminary talks to buy Turkey's Finansbank – QNB Group (QNBK) is holding preliminary talks to buy National Bank of Greece's Turkish arm Finansbank. The bank said that no material developments have yet taken place and QNBK will make further announcements to the Qatar Stock Exchange (QSE) regarding the possible acquisition if and when necessary. (QSE) DBIS to announce financial statements on October 19 – Dlala Brokerage and Investment Holding Company (DBIS) will disclose its financial reports for the period ending September 30, 2015 on October 19, 2015. (QSE) NLCS to announce financial statements on Oct 29 – National Leasing (NLCS) will disclose its financial reports for the period ending September 30, 2015 on October 29, 2015. (QSE) IHGS approves 50% capital increase – Islamic Holding Group (IHGS) in its Extraordinary General Assembly (EGM) meeting has approved a 50% capital increase from QR40mn to QR60mn by issuing 2mn new shares. The shares will be offered for subscription to the eligible shareholders that have the right to subscribe at a rate of one new share for each two existing shares at nominal value of QR10 plus a share premium of QR40 per share. The shareholders owning the shares as on December 1, 2015 will be eligible to participate in the right issue. (QSE) IQCD to disclose financial statements on October 28 – Industries Qatar Company (IQCD) will announce its financial reports for the period ending September 30, 2015 on October 28, 2015. (QSE) MPHC to disclose financial statements on October 27 – Mesaieed Petrochemical Holding Company (MPHC) will announce its financial reports for the period ending September 30, 2015 on October 27, 2015. (QSE)
- 3. Page 3 of 6 Qatar Stock Exchange Top Gainers Top Decliners Source: Qatar Stock Exchange (QSE) Source: Qatar Stock Exchange (QSE) Most Active Shares by Value (QR Million) Most Active Shares by Volume (Million) Source: Qatar Stock Exchange (QSE) Source: Qatar Stock Exchange (QSE) Investor Trading Percentage to Total Value Traded Net Traded Value by Nationality (QR Million) Source: Qatar Stock Exchange (QSE) Source: Qatar Stock Exchange (QSE) 6.8% 6.1% 4.8% 4.1% 3.8% 0.0% 3.0% 6.0% 9.0% Dlala Holding Vodafone Qatar Gulf International Services Qatar Fuel Qatar National Cement -8.7% -7.0% -4.0% -3.9% -3.7% -9.0% -6.0% -3.0% 0.0% Gulf Warehousing Qatar German Co. for Medical Devices Medicare Group Islamic Holding Group Qatar Insurance 148.5 136.3 111.9 111.5 105.2 0.0 50.0 100.0 150.0 Vodafone Qatar Masraf Al Rayan Industries Qatar QNB Group Barwa Real Estate 10.0 6.2 3.1 2.3 2.1 0.0 4.0 8.0 12.0 Vodafone Qatar Mazaya Qatar Masraf Al Rayan Barwa Real Estate Ezdan Real Estate 0% 20% 40% 60% 80% 100% Buy Sell 46.21% 42.67% 11.93% 16.45% 15.20% 16.62% 26.66% 24.25% Qatari Individuals Qatari Institutions Non-Qatari Individuals Non-Qatari Institutions 814 586 828 572 (14) 14 (200) - 200 400 600 800 1,000 Qatari Non-Qatari Net Investment Total Sold Total Bought
- 4. Page 4 of 6 TECHNICAL ANALYSIS OF THE QSE INDEX Source: Bloomberg The QSE Index moved up by only 0.15% on lower volumes vs the week before. The Index has been maintaining its ranging attitude; technical indicators are idle due to thin market activity. As a result, we reiterate the weekly support and resistance levels around the 11,000 level and the 12,000 level, respectively. DEFINITIONS OF KEY TERMS USED IN TECHNICAL ANALYSIS RSI (Relative Strength Index) indicator – RSI is a momentum oscillator that measures the speed and change of price movements. The RSI oscillates between 0 to 100. The index is deemed to be overbought once the RSI approaches the 70 level, indicating that a correction is likely. On the other hand, if the RSI approaches 30, it is an indication that the index may be getting oversold and therefore likely to bounce back. MACD (Moving Average Convergence Divergence) indicator – The indicator consists of the MACD line and a signal line. The divergence or the convergence of the MACD line with the signal line indicates the strength in the momentum during the uptrend or downtrend, as the case may be. When the MACD crosses the signal line from below and trades above it, it gives a positive indication. The reverse is the situation for a bearish trend. Candlestick chart – A candlestick chart is a price chart that displays the high, low, open, and close for a security. The ‘body’ of the chart is portion between the open and close price, while the high and low intraday movements form the ‘shadow’. The candlestick may represent any time frame. We use a one-day candlestick chart (every candlestick represents one trading day) in our analysis. Doji candlestick pattern – A Doji candlestick is formed when a security's open and close are practically equal. The pattern indicates indecisiveness, and based on preceding price actions and future confirmation, may indicate a bullish or bearish trend reversal. Shooting Star/Inverted Hammer candlestick patterns – These candlestick patterns have a small real body (open price and close price are near to each other), and a long upper shadow (large intraday movement on the upside). The Shooting Star is a bearish reversal pattern that forms after a rally. The Inverted Hammer looks exactly like a Shooting Star, but forms after a downtrend. Inverted Hammers represent a potential bullish trend reversal.
- 5. Page 5 of 6 Source: Bloomberg Company Name Price (Oct 15) % Change WTD % Change YTD Market Cap. QR Million TTM P/E P/B Div. Yield Qatar National Bank 188.00 0.05 (11.70) 131,549 11.8 2.4 4.0 Qatar Islamic Bank 118.20 0.94 15.66 27,930 15.0 0.3 3.6 Commercial Bank of Qatar 56.90 0.89 (8.63) 18,585 9.9 1.1 5.6 Doha Bank 50.00 (0.60) (12.28) 12,919 9.4 1.0 8.0 Al Ahli Bank 47.60 (1.86) (4.10) 8,650 13.3 N/A 2.8 Qatar International Islamic Bank 76.00 1.20 (6.98) 11,504 13.4 2.2 5.3 Masraf Al Rayan 43.95 0.11 (0.57) 32,963 15.7 3.3 4.0 Al Khaliji Bank 21.60 (0.46) (2.04) 7,776 12.8 1.3 4.6 National Leasing 18.24 0.77 (8.80) 903 N/A 0.8 4.7 Dlala Holding 22.34 6.84 (33.19) 635 N/A 2.2 N/A Qatar & Oman Investment 14.29 1.28 (7.21) 450 7.0 1.3 5.6 Islamic Holding Group 104.20 (3.87) (16.31) 417 28.6 6.7 2.9 Banking and Financial Services 254,279 Zad Holding 94.00 0.53 11.90 1,230 10.6 1.6 4.3 Qatar German Co. for Medical Devices 14.51 (6.99) 42.96 168 N/A 1.1 N/A Salam International Investment 12.75 0.55 (19.56) 1,458 18.8 0.9 4.7 Medicare Group 167.60 (4.01) 43.25 4,717 24.0 5.3 1.1 Qatar Cinema & Film Distribution 38.00 0.00 (5.00) 239 18.4 1.7 2.4 Qatar Fuel 158.20 4.08 (22.56) 13,361 11.7 2.1 5.7 Widam Food Co. 53.80 (0.37) (10.93) 968 15.8 4.1 4.6 Al Meera Consumer Goods 243.50 (1.22) 21.75 4,870 22.7 3.7 3.7 Consumer Goods and Services 27,010 Qatar Industrial Manufacturing 42.00 (2.10) (3.11) 1,996 12.0 1.4 7.1 Qatar National Cement 108.90 3.81 (9.25) 5,882 13.8 2.2 3.3 Industries Qatar 125.70 0.64 (25.18) 76,049 12.8 2.4 5.6 Qatari Investors Group 47.30 0.42 14.25 5,881 25.2 2.6 1.6 Qatar Electricity and Water 209.20 (0.81) 11.57 23,012 14.4 3.5 3.6 Mannai Corp. 98.60 (1.99) (9.54) 4,498 9.2 2.1 6.1 Aamal 14.29 2.73 (1.22) 9,003 14.2 1.3 6.7 Gulf International Services 70.50 4.75 (27.39) 13,102 8.4 3.5 7.8 Mesaieed Petrochemical Holding 21.60 0.47 -26.8 27,136 21.0 2.0 5.1 Industrials 166,558 Qatar Insurance 94.10 (3.68) 19.44 17,373 18.4 3.0 2.3 Doha Insurance 23.50 (2.81) (18.97) 1,175 13.2 1.1 4.3 Qatar General Insurance & Reinsurance 56.00 0.00 9.15 4,455 4.7 0.8 3.1 Al Khaleej Takaful Insurance 35.00 0.00 (20.77) 893 16.5 1.4 3.7 Qatar Islamic Insurance 72.50 (3.07) (8.23) 1,088 14.5 3.5 5.5 Insurance 24,984 United Development 24.32 (0.65) 3.09 8,611 12.6 0.8 5.1 Barw a Real Estate 44.50 (1.22) 6.21 17,316 2.8 1.0 4.9 Ezdan Real Estate 19.90 0.51 33.38 52,785 36.2 1.8 2.0 Mazaya Qatar Real Estate Development 16.16 (3.06) (11.39) 1,697 9.8 1.3 1.8 Real Estate 80,409 Ooredoo 78.50 0.64 (36.64) 25,145 17.6 1.2 5.1 Vodafone Qatar 14.89 6.13 (9.48) 12,588 N/A 2.4 1.4 Telecoms 37,733 Qatar Navigation (Milaha) 96.50 0.10 (3.02) 11,052 9.3 0.8 5.7 Gulf Warehousing 62.10 0.05 20.63 2,954 20.2 3.6 2.2 Qatar Gas Transport (Nakilat) 23.11 (3.31) 0.04 12,942 13.6 3.2 5.2 Transportation 26,947 Qatar Exchange 617,920
- 6. Contacts Saugata Sarkar Sahbi Kasraoui QNB Financial Services SPC Head of Research Head of HNI Contact Center: (+974) 4476 6666 Tel: (+974) 4476 6534 Tel: (+974) 4476 6544 PO Box 24025 saugata.sarkar@qnbfs.com.qa sahbi.alkasraoui@qnbfs.com.qa Doha, Qatar Disclaimer and Copyright Notice: This publication has been prepared by QNB Financial Services SPC (“QNBFS”) a wholly-owned subsidiary of QNB SAQ (“QNB”). QNBFS is regulated by the Qatar Financial Markets Authority and the Qatar Exchange QNB SAQ is regulated by the Qatar Central Bank. This publication expresses the views and opinions of QNBFS at a given time only. It is not an offer, promotion or recommendation to buy or sell securities or other investments, nor is it intended to constitute legal, tax, accounting, or financial advice. QNBFS accepts no liability whatsoever for any direct or indirect losses arising from use of this report. Any investment decision should depend on the individual circumstances of the investor and be based on specifically engaged investment advice. We therefore strongly advise potential investors to seek independent professional advice before making any investment decision. Although the information in this report has been obtained from sources that QNBFS believes to be reliable, we have not independently verified such information and it may not be accurate or complete. QNBFS does not make any representations or warranties as to the accuracy and completeness of the information it may contain, and declines any liability in that respect. For reports dealing with Technical Analysis, expressed opinions and/or recommendations may be different or contrary to the opinions/recommendations of QNBFS Fundamental Research as a result of depending solely on the historical technical data (price and volume). QNBFS reserves the right to amend the views and opinions expressed in this publication at any time. It may also express viewpoints or make investment decisions that differ significantly from, or even contradict, the views and opinions included in this report. This report may not be reproduced in whole or in part without permission from QNBFS COPYRIGHT: No part of this document may be reproduced without the explicit written permission of QNBFS. Page 6 of 6