QNBFS Weekly Market Report April 26, 2018
•
0 likes•154 views

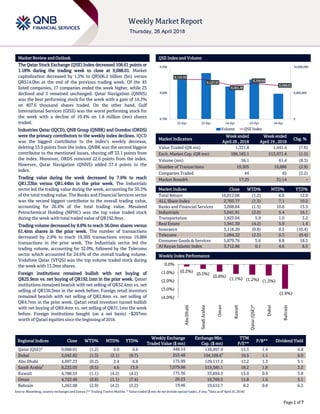
The Qatar Stock Exchange (QSE) Index decreased 108.61 points or 1.18% during the trading week to close at 9,088.01.

Recommended
More Related Content
What's hot
What's hot (20)
Similar to QNBFS Weekly Market Report April 26, 2018
Similar to QNBFS Weekly Market Report April 26, 2018 (20)
More from QNB Group
More from QNB Group (20)
Recently uploaded
Recently uploaded (20)
QNBFS Weekly Market Report April 26, 2018
- 1. ` Page 1 of 7 Market Review and Outlook QSE Index and Volume The Qatar Stock Exchange (QSE) Index decreased 108.61 points or 1.18% during the trading week to close at 9,088.01. Market capitalization decreased by 1.5% to QR506.2 billion (bn) versus QR514.0bn at the end of the previous trading week. Of the 45 listed companies, 17 companies ended the week higher, while 25 declined and 3 remained unchanged. Qatar Navigation (QNNS) was the best performing stock for the week with a gain of 16.3% on 407.6 thousand shares traded. On the other hand, Gulf International Services (GISS) was the worst performing stock for the week with a decline of 10.4% on 1.8 million (mn) shares traded. Industries Qatar (IQCD), QNB Group (QNBK) and Ooredoo (ORDS) were the primary contributors to the weekly index declines. IQCD was the biggest contributor to the index’s weekly decrease, deleting 53.9 points from the index. QNBK was the second biggest contributor to the mentioned losses, shaving off 33.1 points from the index. Moreover, ORDS removed 22.6 points from the index. However, Qatar Navigation (QNNS) added 37.4 points to the index. Trading value during the week decreased by 7.6% to reach QR1.33bn versus QR1.44bn in the prior week. The Industrials sector led the trading value during the week, accounting for 30.3% of the total trading value. The Banks and Financial Services sector was the second biggest contributor to the overall trading value, accounting for 26.4% of the total trading value. Mesaieed Petrochemical Holding (MPHC) was the top value traded stock during the week with total traded value of QR192.9mn. Trading volume decreased by 8.8% to reach 56.0mn shares versus 61.4mn shares in the prior week. The number of transactions decreased by 2.9% to reach 19,305 transactions versus 19,886 transactions in the prior week. The Industrials sector led the trading volume, accounting for 32.0%, followed by the Telecoms sector which accounted for 24.6% of the overall trading volume. Vodafone Qatar (VFQS) was the top volume traded stock during the week with 13.3mn shares. Foreign institutions remained bullish with net buying of QR25.9mn vs. net buying of QR192.1mn in the prior week. Qatari institutions remained bearish with net selling of QR32.4mn vs. net selling of QR156.3mn in the week before. Foreign retail investors remained bearish with net selling of QR2.8mn vs. net selling of QR4.7mn in the prior week. Qatari retail investors turned bullish with net buying of QR9.4mn vs. net selling of QR31.1mn the week before. Foreign institutions bought (on a net basis) ~$207mn worth of Qatari equities since the beginning of 2018. Market Indicators Week ended April 26 , 2018 Week ended April 19 , 2018 Chg. % Value Traded (QR mn) 1,331.8 1,441.4 (7.6) Exch. Market Cap. (QR mn) 506,183.1 513,971.4 (1.5) Volume (mn) 56.1 61.4 (8.3) Number of Transactions 19,305 19,886 (2.9) Companies Traded 44 45 (2.2) Market Breadth 17:25 31:14 – Market Indices Close WTD% MTD% YTD% Total Return 16,012.06 (1.2) 6.0 12.0 ALL Share Index 2,703.77 (1.3) 7.1 10.2 Banks and Financial Services 3,098.84 (1.5) 10.8 15.5 Industrials 3,041.91 (2.0) 5.4 16.1 Transportation 1,825.04 5.9 1.0 3.2 Real Estate 1,941.30 (4.2) 5.9 1.4 Insurance 3,118.20 (0.8) 0.5 (10.4) Telecoms 1,094.32 (2.5) 0.3 (0.4) Consumer Goods & Services 5,879.76 5.6 8.8 18.5 Al Rayan Islamic Index 3,712.86 0.1 4.6 8.5 Market Indices Weekly Index Performance Regional Indices Close WTD% MTD% YTD% Weekly Exchange Traded Value ($ mn) Exchange Mkt. Cap. ($ mn) TTM P/E** P/B** Dividend Yield Qatar (QSE)* 9,088.01 (1.2) 6.0 6.6 448.14 138,997.9 13.3 1.4 4.8 Dubai 3,042.82 (1.3) (2.1) (9.7) 253.48 104,108.6# 10.5 1.1 6.0 Abu Dhabi 4,697.23 (0.2) 2.4 6.8 175.99 129,117.2 12.2 1.3 5.1 Saudi Arabia# 8,233.05 (0.5) 4.6 13.9 7,079.88 519,585.1 18.2 1.8 3.2 Kuwait 4,788.55 (1.1) (4.2) (4.2) 175.56 33,694.5 15.0 0.9 3.8 Oman 4,722.46 (0.8) (1.1) (7.4) 20.23 19,769.5 11.8 1.0 5.1 Bahrain 1,263.08 (2.9) (4.2) (5.2) 19.46 19,615.7 8.2 0.8 6.5 Source: Bloomberg, country exchanges and Zawya (** Trailing Twelve Months; * Value traded ($ mn) do not include special trades, if any; # Data as of April 25, 2018) 9,155.55 9,157.57 9,091.33 9,109.64 9,088.01 0 8,000,000 16,000,000 8,700 9,000 9,300 22-Apr 23-Apr 24-Apr 25-Apr 26-Apr Volume QSE Index (0.2%) (0.5%) (0.8%) (1.1%) (1.2%) (1.3%) (2.9%) (4.0%) (3.0%) (2.0%) (1.0%) 0.0% AbuDhabi SaudiArabia Oman Kuwait Qatar(QSE)* Dubai Bahrain
- 2. Page 2 of 7 News Economic & Corporate News KCBK's bottom line rises 74.8% QoQ in 1Q2018, in-line with our estimate – Al Khalij Commercial Bank's (KCBK) net profit rose 74.8% QoQ (+5.3% YoY) to QR169.5mn in 1Q2018, in line with our estimate of QR160.1mn (variation of +5.9%). Net interest income increased 4.5% QoQ and 5.7% YoY in 1Q2018 to QR244mn. The company's total revenue came in at QR316.01mn in 1Q2018, which represents an increase of 11.5% QoQ (+1.2% YoY). The bank's total assets stood at QR55.2bn at the end of March 31, 2018, down 4.6% QoQ (-6.7% YoY). Loans and advances to customers were QR34.37bn, declining by 2.1% QoQ at the end of March 31, 2018. Customer deposits declined 3.8% QoQ to reach QR31.44bn at the end of March 31, 2018. EPS amounted to QR0.47 in 1Q2018 as compared to QR0.45 in 1Q2017. KCBK’s CEO Fahad Al-Khalifa said the bank reported a strong set of results for the three months ended March 31, 2018, led by growth in operating income. He said the key contributor to the increased operating income was net interest income, which KCBK grew by 5.7%, compared to 1Q2018. “This was a key goal in 2017 and remains so into 2018. We have also reported healthy growth in non-interest income in line with our strategy of maintaining a diversified revenue base. We have generated top line growth by de-leveraging non-core and low yielding assets, effectively managing our funding base,” he said. As the bank grew top line revenues, it has continued to maintain focus on operating costs, which are lower by 3% compared to 1Q2017, resulting in an improved efficiency ratio of 26%, which is one of the best in Qatar, Al-Khalifa said. “Risk management continues to remain at the heart of our operating philosophy. Our proactive approach in managing our loan portfolio, coupled with a conservative approach to provisioning has led to a reduction in net impairments compared to the same period last year,” he continued. Notwithstanding the introduction of IFRS 9 effective January 2018, net impairment charges were lower by 6% compared to the first quarter last year, according to Al-Khalifa. He said, “Our balance sheet remains strong and liquid with 26% of total assets comprising cash and high-quality investment securities, and our liquidity cover ratio (LCR) is well above the minimum regulatory requirement. Our capital adequacy ratio remains robust at 16.6%.” (QNBFS Research, QSE, Gulf-Times.com) DHBK reports QR381mn net profit in 1Q2018, in-line with our estimate – Doha Bank (DHBK) reported net profit of QR381.35mn, registering a rise of 520.8% QoQ and 4.7% YoY in 1Q2018 , in line with our estimate of QR371.33mn (variation of +2.7%). Net interest income decreased 7.3% QoQ in 1Q2018 to QR560.09mn. However, on YoY basis net interest income gained 7.5%. The company's net operating income came in at QR707.89mn in 1Q2018, which represents a decrease of 4.4% QoQ (-2% YoY). The bank's total assets stood at QR93.62bn at the end of March 31, 2018, up 0.1% QoQ (+3.2% YoY). Loans and advances to customers were QR59.88bn, registering a rise of 0.1% QoQ (+0.7% YoY) at the end of March 31, 2018. Customer deposits declined 0.2% QoQ to reach QR59.35bn at the end of March 31, 2018. However, on YoY basis customer deposits rose 9.9%. EPS amounted to QR1.23 in 1Q2018 as compared to QR1.41 in 1Q2017. Doha Bank managing director Sheikh Abdul Rehman bin Mohamad bin Jabor al-Thani said, “The bank has become extremely strong over the years with total equity, as on March 31, 2018, at QR12.4bn.” Through the strategic utilization of the shareholders’ funds by way of increasing the performance levels, the bank’s return on average shareholders’ equity stood at 16.3%, which is one of the best in the industry, he said. The bank, given the scale of its operations, has achieved a very high return on average assets at 1.63% at the end of March 31, 2018, which, according to Sheikh Abdul Rehman, is a clear demonstration of the effective utilization of shareholders’ funds and optimum asset allocation strategies. During the quarter, the annual general assembly meeting had agreed to issue debt notes ‘bonds’ through the Euro medium term note program and reduce the minimum amount per issuance under the commercial papers program to $1mn from $50mn. “Despite the challenging market conditions, DHBK’s strong performance throws light on its superior products and services, ongoing customer demand, capitalizing on market synergies,” its group Chief Executive Officer, R Seetharaman said. (QNBFS Research, QSE, Gulf- Times.com) GISS posts in-line revenue but net profit misses our estimate; Market Perform – Gulf International Services (GISS) reported a net profit of QR9.5mn in 1Q2018 as compared to QR62.8mn in 4Q2017, missing our estimate of QR46.4mn EPS amounted to QR0.05 in 1Q2018 as compared to QR0.34/QR0.08 in 4Q2017/1Q2017. Reported revenue of QR625mn (+3% QoQ & YoY) was right in-line with our estimate of QR628mn. The company does not provide segment details for 1Q/3Q but in its trading statement stated that insurance revenue improved significantly versus last year, while the drilling segment posted a more moderate growth in revenue. Aviation and catering segments were moderately down YoY. According to GISS, insurance uptick was based on growth in both the energy and medical lines of business, while better rig utilization rates helped the drilling segment. The helicopter business was affected by reduction in Qatar aviation operations, and Amwaj was impacted by the demobilization of major catering contracts. GISS’ gross margins at 15% was up relative to the 14.4% posted in 1Q2017 but down significantly vs. GM of 26.1% in 4Q2017. Higher finance charges also caused net margin to narrow to 1.5% in 1Q2018 vs. 10.3% in 4Q2017 and 2.5% in 1Q2017. The company ended the quarter with cash of QR882mn. We continue to rate GISS a Market Perform. (QNBFS Research, QSE, Peninsula Qatar) QGTS' net profit declines 9.8% QoQ in 1Q2018, in-line with our estimate – Qatar Gas Transport Company Limited's (QGTS) net profit declined 9.8% QoQ to QR216.38mn in 1Q2018, in line with our estimate of QR200.95mn (variation of +7.7%). However, on YoY basis net profit rose 13.2%. The company's total income came in at QR890.3mn in 1Q2018, which represents a decrease of 4.9% QoQ. However, on YoY basis total income rose 1.5%. EPS amounted to QR0.39 in 1Q2018 as compared to QR0.34 in 1Q2017. The company has managed to achieve positive results across its operations through rationalization of operational costs, enhanced operational efficiency, and growth of international portfolio through the
- 3. Page 3 of 7 recent expansion with Maran Gas Ventures to include two additional liquefied natural gas (LNG) carriers. This most recent strategic alliance further strengthens QGTS’ fleet to a total of 69 vessels. QGTS’ board attributed this robust performance as a reflection of the company’s strength and resilience supported by cost-effective and reliable business operations. QGTS has managed to maintain a steady cash flow and generate positive value for its shareholders, by capitalizing on profitable business growth. During the first quarter, QGTS successfully deployed the company’s strategic plans towards maintaining its global leadership in LNG transportation and the integral role it plays in Qatar’s LNG supply chain. (QNBFS Research, QSE, Gulf-Times.com) BRES net profit narrows to ~QR405mn in 1Q2018, above our estimate – Barwa Real Estate Company (BRES) reported net profit of ~QR405mn in 1Q2018 as compared to QR482.5mn in 4Q2017, beating our estimate of QR251.7mn. However, adjusted net income (QR196.4mn) fell short of our estimates by 22%. It should be noted that fair value gains on investment properties contributed 52% to the bottom-line. EPS amounted to QR1.04 in 1Q2018 as compared to QR1.23 in 1Q2017. The Group successfully enhanced its operating revenues through increasing its net rental income by QR34mn representing an increase of 11%, despite the decrease in net profit for the period compared to the same period in 2017, resulting from the decrease in profits of non-recurring items such as property valuation gains and other income. The Group aims to increase its operating revenues with the start of the operations of the projects currently under construction that are expected to be completed in 2018, such as the Labor Accommodation Project on Salwa Road, Phase 2 of Madinat Al-Mawater, the Barwa Village extension project and the Dara A project. BRES is finalizing plans to start the development of the Dara B-F project, the Barwa Al Doha Project and the development of BRES’ land in Lusail City, which extends over an area of 3.4mn square meters. During the first quarter, BRES accomplished a number of key achievements, including increasing of the rental income, completion of the construction of Mustawdaat Project. The Board of Directors of BRES announced their intention to convene an extraordinary general assembly to look into the board’s proposal to approve increasing the Non-Qatari shareholding limit from 25% to 49%, in view of Qatar Exchange’s vision to enhance Qatar’s financial market to become a regional financial center attractive to international investments. (QNBFS Research, QSE, Gulf-Times.com) BRES intends to make a recommendation to its EGM to approve the raising of non-Qatari ownership to 49% – Barwa Real Estate Company’s (BRES) Board of Directors intends to invite the company’s shareholders to attend an Extraordinary General Assembly Meeting (EGM) to approve increasing the percentage of non-Qatari ownership in the company’s capital to 49% instead of 25% as per the related laws and regulations and subject to the approval of the Ministry of Economy and Commerce. (QSE) QATI reports ~QR230mn net profit in 1Q2018 – Qatar Insurance Company (QATI) reported net profit of ~QR230mn in 1Q2018 as compared to QR113.5mn in 4Q2017. EPS amounted to QR0.66 in 1Q2018 as compared to QR0.95 in 1Q2017. The group posted gross written premium (GWP) at 15% of QR3.5bn in 1Q2018. This was achieved, despite difficulties encountered by the insurance industry locally, regionally, and globally, as well as the dominating decrease in insurance rates, QATI stated. After the catastrophic events in 2017, and in order to follow up the vision of QATI to become a leading player in the international insurance industry, the group has taken a number of significant strategic decisions to put the company on the right track and find the best solutions for improving the profitability and enhancing the operational efficiency, according to the statement. Group President & CEO Khalifa Abdulla Turki al-Subaey said, “The first-quarter results for 2018, representing 55% of the full-year 2017 profits, demonstrate the capacity of the group to adapt to the variables of the economic environment.” He said the group intends to continue its efforts to realize the highest levels of efficiency in managing its operations, which will contribute to the increase of profitability and development of risk management process to be more effective. (QSE, Gulf-Times.com) QEWS reports QR394mn net profit in 1Q2018, exceeding our estimate – Qatar Electricity & Water Company (QEWS) reported net profit of QR394mn in 1Q2018 as compared to QR305mn in 4Q2017/QR350mn in 1Q2017, beating our estimate of QR351mn (variation of +12%). EPS amounted to QR3.59 in 1Q2018 as compared to QR3.18 in 1Q2017. The company’s reported revenue of QR660mn came in stronger than our estimate, contributing to the earnings beat. We retain our Outperform rating and QR223/sh. PT. (QNBFS Research, QSE) IHGS reports QR0.24mn net profit in 1Q2018 – Islamic Holding Group (IHGS) recorded net profit of QR0.24mn in 1Q2018 as compared to a net loss of QR0.73mn in 4Q2017. However, on YoY basis net profit declined 81.9%. The company's net brokerage & commission income came in at QR1.02mn in 1Q2018, which represents an increase of 71.8% QoQ. However, on YoY basis net brokerage & commission income fell 63.4%. EPS amounted to QR0.04 in 1Q2018 as compared to QR0.23 in 1Q2017. (QSE) WDAM's net profit declines 4.5% QoQ in 1Q2018 – Widam Food Company's (WDAM) net profit declined 4.5% QoQ to QR26.66mn in 1Q2018. However, on YoY basis net profit rose 16.2%. EPS amounted to QR1.48 in 1Q2018 as compared to QR1.28 in 1Q2017. (QSE) SIIS reports net loss of QR8.22mn in 1Q2018 – Salam International Investment Limited (SIIS) reported net loss of QR8.22mn in 1Q2018 as compared to QR96.96mn in 4Q2017. Loss per share amounted to QR0.07 in 1Q2018 as compared to earnings per share of QR0.18 in 1Q2017. (QSE) QGRI net profit narrows to ~QR55mn in 1Q2018 –Qatar General Insurance & Reinsurance Company’s (QGRI) net profit came in at ~QR55.1mn in 1Q2018 as compared to QR272.1mn in 4Q2017. EPS amounted to QR0.63 in 1Q2018 as compared to QR0.49 in 1Q2017. (QSE)
- 4. Page 4 of 7 Qatar Stock Exchange Top Gainers Top Decliners Source: Qatar Stock Exchange (QSE) Source: Qatar Stock Exchange (QSE) Most Active Shares by Value (QR Million) Most Active Shares by Volume (Million) Source: Qatar Stock Exchange (QSE) Source: Qatar Stock Exchange (QSE) Investor Trading Percentage to Total Value Traded Net Traded Value by Nationality (QR Million) Source: Qatar Stock Exchange (QSE) Source: Qatar Stock Exchange (QSE) 16.3% 11.6% 5.5% 4.3% 4.1% 0.0% 6.0% 12.0% 18.0% Milaha Qatar Fuel Doha Insurance Gulf Warehousing Qatar International Islamic Bank -10.4% -7.8% -5.7% -4.2% -4.1% -12.0% -8.0% -4.0% 0.0% Gulf International Services EzdanReal Estate National Leasing Ooredoo Zad Holding 192.9 127.5 125.9 98.5 86.7 0.0 100.0 200.0 300.0 Mesaieed Petrochemical Holding Company Qatar Fuel Vodafone Qatar Industries Qatar QNB Group 13.3 11.3 2.9 2.4 2.2 0.0 5.0 10.0 15.0 Vodafone Qatar Mesaieed Petrochemical Holding Company Qatar Gas Transport (Nakilat) Qatar First Bank Masraf Al Rayan 0% 20% 40% 60% 80% 100% Buy Sell 46.70% 46.00% 20.83% 23.27% 12.07% 12.29% 20.40% 18.45% Qatari Individuals Qatari Institutions Non-Qatari Individuals Non-Qatari Institutions 899 432 922 409 (23) 23 (200) - 200 400 600 800 1,000 Qatari Non-Qatari Net Investment Total Sold Total Bought
- 5. Page 5 of 7 TECHNICAL ANALYSIS OF THE QSE INDEX Source: Bloomberg The QE General Index dropped slightly for the week, and closed at 9,088.01 (only 1.18% down from the week before). We remain optimistic on the general movement for the Index and the good news is that the Index remains above its moving averages while the MACD moved above the zero line. Our immediate weekly resistance resides at the 9,500 level, while our current support remains at the 8,000 level. DEFINITIONS OF KEY TERMS USED IN TECHNICAL ANALYSIS RSI (Relative Strength Index) indicator – RSI is a momentum oscillator that measures the speed and change of price movements. The RSI oscillates between 0 to 100. The index is deemed to be overbought once the RSI approaches the 70 level, indicating that a correction is likely. On the other hand, if the RSI approaches 30, it is an indication that the index may be getting oversold and therefore likely to bounce back. MACD (Moving Average Convergence Divergence) indicator – The indicator consists of the MACD line and a signal line. The divergence or the convergence of the MACD line with the signal line indicates the strength in the momentum during the uptrend or downtrend, as the case may be. When the MACD crosses the signal line from below and trades above it, it gives a positive indication. The reverse is the situation for a bearish trend. Candlestick chart – A candlestick chart is a price chart that displays the high, low, open, and close for a security. The ‘body’ of the chart is portion between the open and close price, while the high and low intraday movements form the ‘shadow’. The candlestick may represent any time frame. We use a one-day candlestick chart (every candlestick represents one trading day) in our analysis. Doji candlestick pattern – A Doji candlestick is formed when a security's open and close are practically equal. The pattern indicates indecisiveness, and based on preceding price actions and future confirmation, may indicate a bullish or bearish trend reversal. Shooting Star/Inverted Hammer candlestick patterns – These candlestick patterns have a small real body (open price and close price are near to each other), and a long upper shadow (large intraday movement on the upside). The Shooting Star is a bearish reversal pattern that forms after a rally. The Inverted Hammer looks exactly like a Shooting Star, but forms after a downtrend. Inverted Hammers represent a potential bullish trend reversal.
- 6. Page 6 of 7 Source: Bloomberg Company Name Price April 26 % Change WTD % Change YTD Market Cap. QR Million TTM P/E P/B Div. Yield Qatar National Bank 150.12 (2.20) 19.13 138,657 11.0 2.2 4.0 Qatar Islamic Bank 106.76 (1.60) 10.06 25,227 11.4 1.8 4.7 Commercial Bank of Qatar 35.90 0.00 24.22 14,530 21.4 1.0 2.8 Doha Bank 26.85 (3.24) (5.79) 8,325 8.6 1.0 11.2 Al Ahli Bank 31.00 (0.48) (16.52) 6,521 10.0 1.3 3.1 Qatar International Islamic Bank 56.20 4.07 2.93 8,507 10.0 1.5 7.1 Masraf Al Rayan 36.00 (1.32) (4.64) 27,000 13.2 2.3 5.6 Al Khalij Commercial Bank 11.05 (1.16) (22.18) 3,978 7.9 0.8 6.8 Qatar First Bank 6.06 (0.33) (7.20) 1,212 N/A 0.8 N/A National Leasing 9.60 (5.70) (10.36) 475 127.3 0.5 5.2 Dlala Holding 11.15 0.00 (24.15) 317 33.9 1.4 N/A Qatar & Oman Investment 7.25 0.69 (8.23) 228 24.5 0.8 6.9 Islamic Holding Group 27.00 (3.57) (28.00) 153 N/A 1.1 N/A Banking and Financial Services 235,130 Zad Holding 70.00 (4.11) (4.94) 1,007 8.5 1.3 8.4 Qatar German Co. for Medical Devices 5.61 (3.28) (13.16) 65 N/A 1.2 N/A Salam International Investment 5.68 1.07 (17.56) 649 N/A 0.5 N/A Medicare Group 67.20 (1.45) (3.79) 1,891 22.9 2.1 2.7 Qatar Cinema & Film Distribution 22.61 0.00 (9.56) 142 18.1 1.1 4.4 Qatar Fuel 138.00 11.56 35.21 13,721 14.2 1.9 5.8 Widam Food Co. 63.80 (0.47) 2.08 1,148 10.3 3.4 6.7 Mannai Corp. 47.98 (0.99) (19.36) 2,189 4.3 0.8 8.3 Al Meera Consumer Goods 137.50 0.36 (5.11) 2,750 14.2 2.0 6.2 Consumer Goods and Services 23,563 Qatar Industrial Manufacturing 39.00 (2.26) (10.76) 1,853 9.4 1.2 7.7 Qatar National Cement 55.45 1.22 (11.84) 3,624 10.9 1.2 8.1 Industries Qatar 108.00 (4.00) 11.34 65,340 19.7 1.9 4.6 Qatari Investors Group 34.61 3.84 (5.44) 4,303 17.0 1.6 2.2 Qatar Electricity and Water 197.00 (2.47) 10.67 21,670 13.1 2.4 3.9 Aamal 11.08 (1.51) 27.65 6,980 14.0 0.9 5.4 Gulf International Services 18.53 (10.35) 4.69 3,444 43.5 0.9 N/A Mesaieed Petrochemical Holding 17.10 3.51 35.82 21,483 19.7 1.5 4.1 Invesment Holding Group 5.69 0.89 (6.72) 472 0.5 0.5 9.7 Industrials 129,169 Qatar Insurance 36.98 (2.17) (18.23) 11,793 43.4 1.3 3.5 Doha Insurance 12.98 5.53 (7.29) 649 15.2 0.6 5.8 Qatar General Insurance & Reinsurance 47.50 1.60 (3.06) 4,157 11.6 0.7 4.7 Al Khaleej Takaful Insurance 11.50 (0.09) (13.14) 294 20.1 0.6 4.3 Qatar Islamic Insurance 52.90 3.95 (3.77) 794 12.7 2.5 6.6 Insurance 17,686 United Development 14.62 3.18 1.67 5,177 9.6 0.5 8.6 Barw a Real Estate 36.65 1.10 14.53 14,261 8.8 0.8 6.8 Ezdan Real Estate 11.13 (7.79) (7.86) 29,522 17.2 1.0 N/A Mazaya Qatar Real Estate Development 7.13 (0.83) (20.78) 825 29.7 0.6 N/A Real Estate 49,786 Ooredoo 79.55 (4.16) (12.34) 25,481 13.6 1.1 4.4 Vodafone Qatar 9.30 0.22 15.96 7,862 N/A 1.8 N/A Telecoms 33,344 Qatar Navigation (Milaha) 60.45 16.25 8.06 6,923 14.6 0.5 5.8 Gulf Warehousing 42.66 4.30 (3.02) 2,500 11.3 1.6 4.0 Qatar Gas Transport (Nakilat) 14.59 (0.61) (9.38) 8,083 9.3 1.4 6.9 Transportation 17,506 Qatar Exchange 506,183
- 7. Contacts Saugata Sarkar, CFA, CAIA Shahan Keushgerian Zaid al-Nafoosi , CMT, CFTe Head of Research Senior Research Analyst Senior Research Analyst Tel: (+974) 4476 6534 Tel: (+974) 4476 6509 Tel: (+974) 4476 6535 saugata.sarkar@qnbfs.com.qa shahan.keushgerian@qnbfs.com.qa zaid.alnafoosi@qnbfs.com.qa Mohamed Abo Daff QNB Financial Services Co. W.L.L. Senior Research Analyst Contact Center: (+974) 4476 6666 Tel: (+974) 4476 6589 PO Box 24025 mohd.abodaff@qnbfs.com.qa Doha, Qatar Disclaimer and Copyright Notice: This publication has been prepared by QNB Financial Services Co. W.L.L. (“QNBFS”) a wholly-owned subsidiary of Qatar National Bank (Q.P.S.C.). QNBFS is regulated by the Qatar Financial Markets Authority and the Qatar Exchange. Qatar National Bank (Q.P.S.C.) is regulated by the Qatar Central Bank. This publication expresses the views and opinions of QNBFS at a given time only. It is not an offer, promotion or recommendation to buy or sell securities or other investments, nor is it intended to constitute legal, tax, accounting, or financial advice. QNBFS accepts no liability whatsoever for any direct or indirect losses arising from use of this report. Any investment decision should depend on the individual circumstances of the investor and be based on specifically engaged investment advice. We therefore strongly advise potential investors to seek independent professional advice before making any investment decision. Although the information in this report has been obtained from sources that QNBFS believes to be reliable, we have not independently verified such information and it may not be accurate or complete. QNBFS does not make any representations or warranties as to the accuracy and completeness of the information it may contain, and declines any liability in that respect. For reports dealing with Technical Analysis, expressed opinions and/or recommendations may be different or contrary to the opinions/recommendations of QNBFS Fundamental Research as a result of depending solely on the historical technical data (price and volume). QNBFS reserves the right to amend the views and opinions expressed in this publication at any time. It may also express viewpoints or make investment decisions that differ significantly from, or even contradict, the views and opinions included in this report. This report may not be reproduced in whole or in part without permission from QNBFS COPYRIGHT: No part of this document may be reproduced without the explicit written permission of QNBFS. Page 7 of 7