Weekly market report
•
0 likes•190 views

The document provides a weekly market review and outlook of the Qatar Stock Exchange (QSE) Index for the week ending October 1, 2015. It summarizes that the QSE Index gained 0.17% over the week to close at 11,453.13 points. Trading value and volume increased compared to the previous week. Foreign institutions turned to net buying while Qatari institutions net sold. The document also provides sector performance, top traded stocks, foreign holdings, and other market indicators for Qatar and neighboring markets.

Recommended
More Related Content
What's hot
What's hot (20)
Viewers also liked
Viewers also liked (14)
Similar to Weekly market report
Similar to Weekly market report (20)
More from QNB Group
More from QNB Group (20)
Recently uploaded
Recently uploaded (20)
Weekly market report
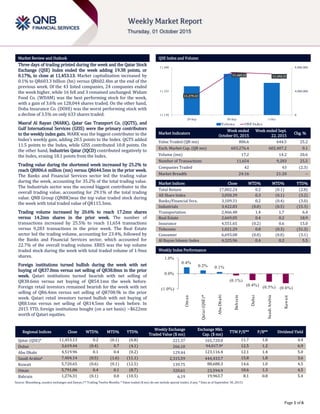
- 1. ` Page 1 of 6 Market Review and Outlook QSE Index and Volume Three days of trading printed during the week and the Qatar Stock Exchange (QSE) Index ended the week adding 19.38 points, or 0.17%, to close at 11,453.13. Market capitalization increased by 0.1% to QR603.3 billion (bn) versus QR602.4bn at the end of the previous week. Of the 43 listed companies, 24 companies ended the week higher, while 16 fell and 3 remained unchanged. Widam Food Co. (WDAM) was the best performing stock for the week, with a gain of 3.6% on 128,044 shares traded. On the other hand, Doha Insurance Co. (DOHI) was the worst performing stock with a decline of 3.5% on only 633 shares traded. Masraf Al Rayan (MARK), Qatar Gas Transport Co. (QGTS), and Gulf International Services (GISS) were the primary contributors to the weekly index gain. MARK was the biggest contributor to the Index’s weekly gain, adding 20.5 points to the Index. QGTS added 11.5 points to the Index, while GISS contributed 10.8 points. On the other hand, Industries Qatar (IQCD) contributed negatively to the Index, erasing 18.1 points from the Index. Trading value during the shortened week increased by 25.2% to reach QR806.6 million (mn) versus QR644.5mn in the prior week. The Banks and Financial Services sector led the trading value during the week, accounting for 35.2% of the total trading value. The Industrials sector was the second biggest contributor to the overall trading value, accounting for 29.1% of the total trading value. QNB Group (QNBK)was the top value traded stock during the week with total traded value of QR115.3mn. Trading volume increased by 20.6% to reach 17.2mn shares versus 14.2mn shares in the prior week. The number of transactions increased by 25.5% to reach 11,654 transactions versus 9,283 transactions in the prior week. The Real Estate sector led the trading volume, accounting for 23.4%, followed by the Banks and Financial Services sector, which accounted for 22.7% of the overall trading volume. ERES was the top volume traded stock during the week with total traded volume of 1.9mn shares. Foreign institutions turned bullish during the week with net buying of QR37.0mn versus net selling of QR38.8mn in the prior week. Qatari institutions turned bearish with net selling of QR38.6mn versus net buying of QR54.1mn the week before. Foreign retail investors remained bearish for the week with net selling of QR6.4mn versus net selling of QR708.9k in the prior week. Qatari retail investors turned bullish with net buying of QR8.1mn versus net selling of QR14.5mn the week before. In 2015 YTD, foreign institutions bought (on a net basis) ~$622mn worth of Qatari equities. Market Indicators Week ended October 01, 2015 Week ended Sept. 22, 2015 Chg. % Value Traded (QR mn) 806.6 644.5 25.2 Exch. Market Cap. (QR mn) 603,276.4 602,407.2 0.1 Volume (mn) 17.2 14.2 20.6 Number of Transactions 11,654 9,283 25.5 Companies Traded 42 43 (2.3) Market Breadth 24:16 21:20 – Market Indices Close WTD% MTD% YTD% Total Return 17,802.24 0.2 (0.1) (2.8) All Share Index 3,050.39 0.3 (0.1) (3.2) Banks/Financial Svcs. 3,109.31 0.2 (0.4) (3.0) Industrials 3,422.83 (0.0) (0.5) (15.3) Transportation 2,466.48 1.4 1.7 6.4 Real Estate 2,669.05 0.4 0.2 18.9 Insurance 4,551.65 (0.2) 0.6 15.0 Telecoms 1,021.29 0.8 (0.3) (31.3) Consumer 6,693.08 (0.0) (0.0) (3.1) Al Rayan Islamic Index 4,325.96 0.4 0.2 5.5 Market Indices Weekly Index Performance Regional Indices Close WTD% MTD% YTD% Weekly Exchange Traded Value ($ mn) Exchange Mkt. Cap. ($ mn) TTM P/E** P/B** Dividend Yield Qatar (QSE)* 11,453.13 0.2 (0.1) (6.8) 221.37 165,720.0 11.7 1.8 4.4 Dubai 3,619.44 (0.4) 0.7 (4.1) 266.10 94,017.9# 12.5 1.2 6.9 Abu Dhabi 4,519.96 0.1 0.4 (0.2) 129.44 123,116.4 12.1 1.4 5.0 Saudi Arabia# 7,404.14 (0.5) (1.6) (11.1) 2,315.59 444,433.7 15.8 1.8 3.6 Kuwait 5,720.65 (0.6) (0.1) (12.5) 139.75 88,688.3 14.6 1.0 4.5 Oman 5,791.06 0.4 0.1 (8.7) 320.61 23,594.9 10.6 1.3 4.5 Bahrain 1,276.31 (0.1) 0.0 (10.5) 6.19 19,963.7 8.1 0.8 5.4 Source: Bloomberg, country exchanges and Zawya (** Trailing Twelve Months; * Value traded ($ mn) do not include special trades, if any; # Data as of September 30, 2015) 11,275.12 11,465.22 11,453.13 0 4,000,000 8,000,000 11,150 11,325 11,500 29-Sep 30-Sep 1-Oct Volume QSEIndex 0.4% 0.2% 0.1% (0.1%) (0.4%) (0.5%) (0.6%)(1.0%) 0.0% 1.0% Oman Qatar(QSE)* AbuDhabi Bahrain Dubai SaudiArabia Kuwait
- 2. Page 2 of 6 News Economic News QCB: Qatar banking system set to see countercyclical buffers from 2016 – According to the Qatar Central Bank (QCB), Qatar is expected to implement “countercyclical buffers” in 2016 with a view to maintaining the health of the country’s banks. The modalities for maintenance of countercyclical buffers are being worked out and are expected to be implemented in 2016. Domestic systemically important banks (DSIBs) have also been instructed to maintain additional capital buffers in a phased manner from 2016. In July 2014, the QCB had issued guidelines on the framework for DSIBs which deal with identification, calibration and treatment of DSIBs in Qatar. The minimum liquidity coverage ratio (LCR) required has also been set at 60% starting from 2014 and will be increased by 10% every year to reach 100% in 2018. Banks are required to report LCR both on solo and consolidated basis. They are also notified to submit LCR in currencies which are significant for banks. In addition, banks are required to maintain the net stable funding ratio (NSFR) at a minimum of 70% starting from 2015, which will be increased by 10% every year to reach 100% by 2018. Financial penalties will be imposed on violation of the ratios. (Gulf-Times.com) IEA forecasts Qatar’s oil production to be 700,000 bpd in 2016 – The International Energy Agency (IEA) has forecasted Qatar’s oil production to be around 700,000 barrels per day (bpd) in 2016, which is equal to its current annual production. Al Sharq reported that Qatar’s oil reserves are estimated to be around 15bn barrels. The agency expects oil prices in the international market to average $50 in 2016 and accordingly Qatar’s oil revenue is estimated to be $12.8bn. Qatar Petroleum had recently invited international oil companies to develop and operate its Al Shaheen oilfield from mid-2017. (Peninsula Qatar) Qatar maintains lead in LNG exports – According to an International Gas Union report, Qatar has retained its top position in the world in the global Liquefied Natural Gas (LNG) export market. The country had exported around 77mn tons (MT) of LNG in 2014, which was approximately one-third of global supply. It remained the largest LNG exporter with a sizeable margin as the gap between Qatar and its competitors was huge. Malaysia and Australia — the world’s second and third largest LNG producers respectively — saw LNG exports reach an all-time high. In 2014, Malaysia had exported around 25MT LNG while Australia exported 23MT. Nigeria was the fourth largest exporter providing around 19MT to the market. Overall, LNG trade globally had reached around 241MT in 2014, a 4.3MT increase over the 2013 levels. (Peninsula Qatar) QCB to issue T-bills worth QR4bn on October 1 – The Qatar Central Bank (QCB) will issue new three-month treasury bills (T-bills) worth QR2bn, along with six-month and nine-month T-bills worth QR1bn each on October 1, 2015. (QCB) Ashghal awards sewage tunnel construction contracts to Bouygues – The Public Works Authority (Ashghal) has awarded two contracts for the design and construction of sewage tunnels to Bouygues Travaux Publics, a subsidiary of Bouygues Construction, in partnership with a local contractor UrbaCon Trading & Contracting. The two contracts are worth around €550mn, of which Bouygues' share amounts to roughly €285mn. The project began this summer and is expected to be completed by 2019. (Reuters) Market & Corporate News QSE Index, QSE Al Rayan Islamic Index and QSE All Share Index get rebalanced effective today – Al Meera Consumer Goods Company (MERS) will replace Qatari Investors Group (QIGD) in QSE Index with a weight of 1.09% of the Index. As per index rules, QNB Group (QNBK), whose weight exceeds 15% in the index as of market close September 30, 2015 has its weight capped at the 15% level and excess weight allocated to remaining stocks proportionately. Zad Holding (ZHCD) will join QSE Al Rayan Islamic Index, bringing the number of constituents to 18. The weight of ZHCD will be 1% of the Index. Ahli Bank (ABQK), recording a velocity lesser than 1%, is removed from both QSE All Share Index and QSE Banks and Financial Services Index. (QSE) QNBFS corners maximum value in brokerages – QNB Financial Services (QNBFS) has emerged as the topper in Qatar’s brokerage business in September 2015, by grabbing 25.66% of the total value of shares traded on the Qatar Stock Exchange (QSE) during September 2015. Through a total of 20,500 transactions, the combined value of total shares traded by QNBFS reached QR3.19bn in September. With a share of 21.18% of the total value or QR2.6bn, The Group Securities stood second in terms of total value of traded shares. However, on cumulative basis, The Group Securities continued to consolidate its position as the topper by grabbing 29.52% of the total value of shares traded on the bourse in September. Through a total of 848,641 transactions, the combined value of total shares traded by the brokerage company hit QR46bn. QNBFS, the brokerage arm of QNB Group, garnered 17.92% share of the total traded value in September cumulative from the beginning of 2015, marginally up from 17.24% posted in the previous month. Total value of shares traded by QNBFS on a cumulative basis stood at QR27bn. (Peninsula Qatar) QNB Group stops preliminary talks to acquire KFH’s Malaysia unit – QNB Group (QNBK) has stopped preliminary talks to acquire Kuwait Finance House’s (KFH) Malaysian unit without reaching an agreement. (QSE) ORDS subsidiary to pay $35.6mn interest to bondholders – Ooredoo International Finance Limited (OIFL), a wholly-owned subsidiary of Ooredoo (ORDS), will pay its Global Medium Term Note (GMTN)-holders principal and interest payments amounting to $16.87mn and $18.75mn, on October 14, 2015 and October 19, 2015, respectively. (QSE) QIBK to announce financial statements on Oct 13 – Qatar Islamic Bank (QIBK) will disclose its financial reports for the period ending September 30, 2015 on October 13, 2015. (QSE) MRDS to announce financial statements on October 14 – Mazaya Qatar Real Estate Development Company (MRDS) will disclose its financial reports for the period ending September 30, 2015 on October 14, 2015. (QSE) ABQK to disclose financial statements on October 14 – Ahli Bank (ABQK) will announce its financial reports for the period ending September 30, 2015 on October 14, 2015. (QSE) MCCS to announce financial statements on October 15 – Mannai Corporation (MCCS) will disclose its financial reports for the period ending September 30, 2015 on October 15, 2015. (QSE) MARK to disclose financial statements on Oct 25 – Masraf Al Rayan (MARK) will announce its financial reports for the period ending September 30, 2015 on October 25, 2015. (QSE) UDCD to disclose financial statements on October 26 – United Development Company (UDCD) will announce its financial reports for the period ending September 30, 2015 on October 26, 2015. (QSE)
- 3. Page 3 of 6 Qatar Stock Exchange Top Gainers Top Decliners Source: Qatar Stock Exchange (QSE) Source: Qatar Stock Exchange (QSE) Most Active Shares by Value (QR Million) Most Active Shares by Volume (Million) Source: Qatar Stock Exchange (QSE) Source: Qatar Stock Exchange (QSE) Investor Trading Percentage to Total Value Traded Net Traded Value by Nationality (QR Million) Source: Qatar Stock Exchange (QSE) Source: Qatar Stock Exchange (QSE) 3.6% 3.5% 3.4% 3.2% 3.2% 0.0% 1.5% 3.0% 4.5% Widam Food Co. Mannai Corp. Gulf Warehousing Gulf International Services Zad Holding -3.5% -2.4% -1.9% -1.5% -1.3% -4.5% -3.0% -1.5% 0.0% Doha Insurance Qatar Electricity and Water National Leasing Industries Qatar Al Khaliji 115.3 90.5 78.3 52.8 44.8 0.0 40.0 80.0 120.0 QNB Group Industries Qatar Gulf International Services Masraf Al Rayan Ooredoo 1.9 1.9 1.5 1.3 1.2 0.0 1.0 2.0 3.0 Ezdan Real Estate Vodafone Qatar Qatar Gas Transport (Nakilat) Salam International Investment Masraf Al Rayan 0% 20% 40% 60% 80% 100% Buy Sell 28.87% 27.87% 10.60% 15.39% 12.34% 13.14% 48.20% 43.61% Qatari Individuals Qatari Institutions Non-Qatari Individuals Non-Qatari Institutions 318 488 349 458 (31) 31 (100) - 100 200 300 400 500 600 Qatari Non-Qatari Net Investment Total Sold Total Bought
- 4. Page 4 of 6 TECHNICAL ANALYSIS OF THE QSE INDEX Source: Bloomberg The QSE Index inched up by 0.17% on low volumes vs the week before; it reflected the indecisiveness of market participants throughout the week. Technical indicators are flat, thus no solid signal can be derived at this junction. The expected support and resistance levels remain at 11,000 points and 12,000 points, respectively. DEFINITIONS OF KEY TERMS USED IN TECHNICAL ANALYSIS RSI (Relative Strength Index) indicator – RSI is a momentum oscillator that measures the speed and change of price movements. The RSI oscillates between 0 to 100. The index is deemed to be overbought once the RSI approaches the 70 level, indicating that a correction is likely. On the other hand, if the RSI approaches 30, it is an indication that the index may be getting oversold and therefore likely to bounce back. MACD (Moving Average Convergence Divergence) indicator – The indicator consists of the MACD line and a signal line. The divergence or the convergence of the MACD line with the signal line indicates the strength in the momentum during the uptrend or downtrend, as the case may be. When the MACD crosses the signal line from below and trades above it, it gives a positive indication. The reverse is the situation for a bearish trend. Candlestick chart – A candlestick chart is a price chart that displays the high, low, open, and close for a security. The ‘body’ of the chart is portion between the open and close price, while the high and low intraday movements form the ‘shadow’. The candlestick may represent any time frame. We use a one-day candlestick chart (every candlestick represents one trading day) in our analysis. Doji candlestick pattern – A Doji candlestick is formed when a security's open and close are practically equal. The pattern indicates indecisiveness, and based on preceding price actions and future confirmation, may indicate a bullish or bearish trend reversal. Shooting Star/Inverted Hammer candlestick patterns – These candlestick patterns have a small real body (open price and close price are near to each other), and a long upper shadow (large intraday movement on the upside). The Shooting Star is a bearish reversal pattern that forms after a rally. The Inverted Hammer looks exactly like a Shooting Star, but forms after a downtrend. Inverted Hammers represent a potential bullish trend reversal.
- 5. Page 5 of 6 Source: Bloomberg Company Name Price (Oct 01) % Change WTD % Change YTD Market Cap. QR Million TTM P/E P/B Div. Yield Qatar National Bank 185.50 0.27 (12.87) 129,800 11.8 2.3 4.0 Qatar Islamic Bank 115.00 (0.78) 12.52 27,174 15.5 1.9 3.7 Commercial Bank of Qatar 55.60 (0.71) (10.72) 18,161 9.7 1.1 5.7 Doha Bank 49.95 (1.09) (12.37) 12,906 9.4 1.0 8.0 Al Ahli Bank 49.50 0.00 (0.27) 8,995 14.1 2.1 2.8 Qatar International Islamic Bank 74.70 (0.13) (8.57) 11,307 13.2 2.2 5.4 Masraf Al Rayan 43.35 2.00 (1.92) 32,513 15.5 3.2 4.0 Al Khaliji Bank 21.02 (1.31) (4.67) 7,567 12.4 1.3 4.8 National Leasing 17.73 (1.88) (11.35) 877 N/A 0.7 4.8 Dlala Holding 20.00 0.35 (40.19) 568 N/A 2.0 N/A Qatar & Oman Investment 13.70 0.37 (11.04) 432 6.7 1.2 5.8 Islamic Holding Group 112.90 0.71 (9.32) 452 31.0 7.3 2.7 Banking and Financial Services 250,751 Zad Holding 94.00 3.18 11.90 1,230 10.6 1.6 4.3 Qatar German Co. for Medical Devices 13.38 1.67 31.82 155 N/A 1.0 N/A Salam International Investment 12.49 1.38 (21.20) 1,428 18.4 0.9 4.8 Medicare Group 165.00 (0.30) 41.03 4,644 23.6 5.3 1.1 Qatar Cinema & Film Distribution 38.00 0.00 (5.00) 239 18.4 1.7 2.4 Qatar Fuel 153.50 (0.65) (24.87) 12,965 11.3 2.0 5.9 Widam Food Co. 54.30 3.63 (10.10) 977 15.9 4.1 4.6 Al Meera Consumer Goods 249.00 (0.28) 24.50 4,980 23.2 3.8 3.6 Consumer Goods and Services 26,616 Qatar Industrial Manufacturing 42.10 (1.06) (2.88) 2,001 12.1 1.4 7.1 Qatar National Cement 104.60 0.10 (12.83) 5,650 13.3 2.1 3.5 Industries Qatar 121.70 (1.54) (27.56) 73,629 12.4 2.3 5.8 Qatari Investors Group 44.80 1.82 8.21 5,570 23.8 2.4 1.7 Qatar Electricity and Water 207.00 (2.36) 10.40 22,770 14.3 3.4 3.6 Mannai Corp. 101.80 3.46 (6.61) 4,644 9.5 2.1 5.9 Aamal 13.55 1.80 (6.34) 8,537 13.5 1.2 7.0 Gulf International Services 64.50 3.20 (33.57) 11,987 7.7 3.2 8.5 Mesaieed Petrochemical Holding 21.10 2.13 -28.5 26,508 20.5 2.0 5.2 Industrials 161,294 Qatar Insurance 94.00 0.00 19.32 17,354 18.4 3.0 2.3 Doha Insurance 23.15 (3.54) (20.17) 1,158 13.0 1.1 4.3 Qatar General Insurance & Reinsurance 55.40 (0.18) 7.98 4,407 4.7 0.8 3.1 Al Khaleej Takaful Insurance 35.40 1.14 (19.86) 904 16.7 1.4 3.7 Qatar Islamic Insurance 74.50 0.27 (5.70) 1,118 14.9 3.6 5.4 Insurance 24,940 United Development 23.50 1.73 (0.38) 8,321 12.2 0.8 5.3 Barw a Real Estate 43.20 0.58 3.10 16,810 2.7 0.9 5.1 Ezdan Real Estate 18.66 0.05 25.07 49,496 33.9 1.7 2.1 Mazaya Qatar Real Estate Development 16.00 2.56 (12.27) 1,680 9.7 1.3 1.8 Real Estate 76,307 Ooredoo 77.10 1.45 (37.77) 24,697 17.3 1.1 5.2 Vodafone Qatar 13.40 (0.74) (18.54) 11,328 N/A 2.1 1.6 Telecoms 36,025 Qatar Navigation (Milaha) 98.00 (1.01) (1.51) 11,223 9.4 0.8 5.6 Gulf Warehousing 69.30 3.43 22.87 3,296 20.6 3.7 2.2 Qatar Gas Transport (Nakilat) 22.90 2.92 (0.87) 12,824 13.5 3.2 5.2 Transportation 27,343 Qatar Exchange 603,276
- 6. Contacts Saugata Sarkar Sahbi Kasraoui QNB Financial Services SPC Head of Research Head of HNI Contact Center: (+974) 4476 6666 Tel: (+974) 4476 6534 Tel: (+974) 4476 6544 PO Box 24025 saugata.sarkar@qnbfs.com.qa sahbi.alkasraoui@qnbfs.com.qa Doha, Qatar Disclaimer and Copyright Notice: This publication has been prepared by QNB Financial Services SPC (“QNBFS”) a wholly-owned subsidiary of QNB SAQ (“QNB”). QNBFS is regulated by the Qatar Financial Markets Authority and the Qatar Exchange QNB SAQ is regulated by the Qatar Central Bank. This publication expresses the views and opinions of QNBFS at a given time only. It is not an offer, promotion or recommendation to buy or sell securities or other investments, nor is it intended to constitute legal, tax, accounting, or financial advice. QNBFS accepts no liability whatsoever for any direct or indirect losses arising from use of this report. Any investment decision should depend on the individual circumstances of the investor and be based on specifically engaged investment advice. We therefore strongly advise potential investors to seek independent professional advice before making any investment decision. Although the information in this report has been obtained from sources that QNBFS believes to be reliable, we have not independently verified such information and it may not be accurate or complete. QNBFS does not make any representations or warranties as to the accuracy and completeness of the information it may contain, and declines any liability in that respect. For reports dealing with Technical Analysis, expressed opinions and/or recommendations may be different or contrary to the opinions/recommendations of QNBFS Fundamental Research as a result of depending solely on the historical technical data (price and volume). QNBFS reserves the right to amend the views and opinions expressed in this publication at any time. It may also express viewpoints or make investment decisions that differ significantly from, or even contradict, the views and opinions included in this report. This report may not be reproduced in whole or in part without permission from QNBFS COPYRIGHT: No part of this document may be reproduced without the explicit written permission of QNBFS. Page 6 of 6