Weekly market report
•
0 likes•439 views

The Qatar Exchange Index lost 2.5% over the week. Trading value decreased 5.1% to QR3.4 billion while volume fell 6.1% to 78.1 million shares. Company earnings results were mixed, with Commercial Bank of Qatar reporting an 8.3% decline in profits due to higher provisions, while Masraf Al Rayan saw profits rise 9% from higher financing income and fees. Vodafone Qatar also posted a narrower loss. Foreign investors remained net buyers during the week.

More Related Content
What's hot
What's hot (20)
Viewers also liked
Similar to Weekly market report
Similar to Weekly market report (20)
More from QNB Group
More from QNB Group (20)
Recently uploaded
Recently uploaded (20)
Weekly market report
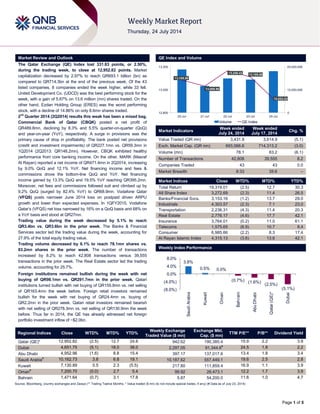
- 1. Page 1 of 5 Market Review and Outlook QE Index and Volume The Qatar Exchange (QE) Index lost 331.83 points, or 2.50%, during the trading week, to close at 12,952.82 points. Market capitalization decreased by 2.97% to reach QR693.1 billion (bn) as compared to QR714.3bn at the end of the previous week. Of the 43 listed companies, 8 companies ended the week higher, while 33 fell. United Development Co. (UDCD) was the best performing stock for the week, with a gain of 5.67% on 13.6 million (mn) shares traded. On the other hand, Ezdan Holding Group (ERES) was the worst performing stock, with a decline of 14.86% on only 8.6mn shares traded. 2nd Quarter 2014 (2Q2014) results this weak has been a mixed bag. Commercial Bank of Qatar (CBQK) posted a net profit of QR489.8mn, declining by 8.3% and 5.5% quarter-on-quarter (QoQ) and year-on-year (YoY), respectively. A surge in provisions was the primary cause of drop in profitability. The bank posted net provisions (credit and investment impairments) of QR227.1mn vs. QR59.3mn in 1Q2014 (2Q2013: QR148.2mn). However, CBQK exhibited healthy performance from core banking income. On the other, MARK (Masraf Al Rayan) reported a net income of QR471.4mn in 2Q2014, increasing by 9.0% QoQ and 12.1% YoY. Net financing income and fees & commissions drove the bottom-line QoQ and YoY. Net financing income gained by 13.3% QoQ and 19.5% YoY reaching QR395.2mn. Moreover, net fees and commissions followed suit and climbed up by 9.2% QoQ (surged by 82.4% YoY) to QR68.9mn. Vodafone Qatar (VFQS) posts narrower June 2014 loss on postpaid driven ARPU growth and lower than expected expenses. In 1QFY2015, Vodafone Qatar’s (VFQS) net loss narrowed by 16% on a QoQ basis and 68% on a YoY basis and stood at QR27mn. Trading value during the week decreased by 5.1% to reach QR3.4bn vs. QR3.6bn in the prior week. The Banks & Financial Services sector led the trading value during the week, accounting for 27.9% of the total equity trading value. Trading volume decreased by 6.1% to reach 78.1mn shares vs. 83.2mn shares in the prior week. The number of transactions increased by 8.2% to reach 42,808 transactions versus 39,555 transactions in the prior week. The Real Estate sector led the trading volume, accounting for 25.7%. Foreign institutions remained bullish during the week with net buying of QR98.1mn vs. QR291.7mn in the prior week. Qatari institutions turned bullish with net buying of QR155.8mn vs. net selling of QR163.4mn the week before. Foreign retail investors remained bullish for the week with net buying of QR24.4mn vs. buying of QR2.2mn in the prior week. Qatari retail investors remained bearish with net selling of QR278.3mn vs. net selling of QR130.9mn the week before. Thus far in 2014, the QE has already witnessed net foreign portfolio investment inflow of ~$2.0bn. Market Indicators Week ended July 24, 2014 Week ended July 17, 2014 Chg. % Value Traded (QR mn) 3,431.8 3,614.9 (5.1) Exch. Market Cap. (QR mn) 693,066.6 714,313.2 (3.0) Volume (mn) 78.1 83.2 (6.1) Number of Transactions 42,808 39,555 8.2 Companies Traded 43 43 0.0 Market Breadth 8:33 35:6 – Market Indices Close WTD% MTD% YTD% Total Return 19,319.01 (2.5) 12.7 30.3 All Share Index 3,272.69 (2.3) 11.4 26.5 Banks/Financial Svcs. 3,153.16 (1.2) 13.7 29.0 Industrials 4,303.57 (2.3) 7.1 23.0 Transportation 2,236.31 (4.3) 11.4 20.3 Real Estate 2,776.17 (4.6) 17.7 42.1 Insurance 3,764.01 (0.2) 11.0 61.1 Telecoms 1,575.65 (6.9) 10.7 8.4 Consumer 6,985.66 (2.2) 8.3 17.4 Al Rayan Islamic Index 4,315.13 (3.6) 13.6 42.1 Market Indices Weekly Index Performance Regional Indices Close WTD% MTD% YTD% Weekly Exchange Traded Value ($ mn) Exchange Mkt. Cap. ($ mn) TTM P/E** P/B** Dividend Yield Qatar (QE)* 12,952.82 (2.5) 12.7 24.8 942.62 190,385.4 15.9 2.2 3.9 Dubai 4,651.75 (5.1) 18.0 38.0 2,297.05 91,344.6# 24.5 1.8 2.2 Abu Dhabi 4,952.96 (1.6) 8.8 15.4 397.17 137,017.6 13.4 1.8 3.4 Saudi Arabia# 10,162.73 3.8 6.8 19.1 10,187.62 557,449.1 19.6 2.5 2.8 Kuwait 7,130.89 0.5 2.3 (5.5) 217.80 111,859.4 16.9 1.1 3.9 Oman# 7,200.70 (0.0) 2.7 5.4 99.92 26,473.1 12.2 1.7 3.9 Bahrain 1,471.64 (0.7) 3.1 17.8 5.87 54,200.0 11.6 1.0 4.7 Source: Bloomberg, country exchanges and Zawya (** Trailing Twelve Months; * Value traded ($ mn) do not include special trades, if any) (# Data as of July 23, 2014) 13,155.58 13,089.96 13,258.42 13,189.56 12,952.82 0 10,000,000 20,000,000 12,800 13,050 13,300 20-Jul 21-Jul 22-Jul 23-Jul 24-Jul Volume QE Index 3.8% 0.5% 0.0% (0.7%) (1.6%) (2.5%) (5.1%)(8.0%) (4.0%) 0.0% 4.0% 8.0% SaudiArabia Kuwait Oman Bahrain AbuDhabi Qatar(QE)* Dubai
- 2. Page 2 of 5 News Market & Corporate News CBQK 2Q2014 profitability slightly misses estimates on the back of higher-than-expected provisions. CBQK posted a net profit of QR489.8mn, slightly below (5.5%) our estimate of QR518.5mn (Bloomberg & Reuters consensus of QR513mn and QR512.75mn). Net income declined by 8.3% and 5.5% QoQ and YoY, respectively. A surge in provisions was the primary cause of drop in profitability and the miss. The bank posted net provisions (credit and investment impairments) of QR227.1mn vs. QR59.3mn in 1Q2014 (2Q2013: QR148.2mn). CBQK exhibited healthy performance from core banking income. Net interest income climbed up by 5.1% QoQ (+41.9% YoY; note YoY comparisons are impacted by Abank’s consolidation) to QR652.7mn. The bank’s NIM has shown signs of improvement, improving to 2.7% in 2Q2014 vs. 2.6% in 1Q2014. Fees & commissions surged by 28.1% QoQ (+64.2% YoY) to QR271.0mn. On the other hand, FX income was weak at QR24.3mn (down 42.5% and 39.1% QoQ and YoY, respectively). Share of profit from associates (QR101.8mn) displayed positive performance, growing by 11.1% QoQ and 27.7% YoY. Operating expenses marginally increased by 3.6% QoQ (+62.8% YoY). On the positive side, CBQK’s efficiency ratio improved from 39.6% in 1Q2014 to 36.3% in 2Q2014 (2Q2013: 38.8%). Loan growth is yet to materialize. CBQK’s loan book grew by 1.0% QoQ (3.8% YTD), reaching QR69.4bn. On the other hand, deposits receded by 3.7% QoQ (down 5.6% YTD) to QR59.8bn. As such, the LDR jumped to 116% in 2Q2014 vs. 111% in 1Q2013 (2013: 105%). Abank contributed 18.2% and 14.7% to overall loans and deposits, respectively. (QE, QNBFS) VFQS posts narrower June 2014 loss on postpaid driven ARPU growth and lower than expected expenses – In 1QFY2015, Vodafone Qatar’s (VFQS) net loss narrowed by 16% on a QoQ basis and 68% on a YoY basis and stood at QR27mn. We were expecting a net loss of QR35mn. Results were helped by an increase in revenue with June quarter revenue up 6% QoQ and 27% YoY to QR585mn. Reported revenue was 3% above our estimate of QR570mn. VFQS’ mobile customer growth was modestly disappointing at 2% QoQ; subs reached 1.354mn (up 18% YoY) vs. our estimate of 1.388mn. Quarterly ARPU however exceeded our expectation, coming in at QR131 (+2% QoQ, +7% YoY) vs. our estimates of flattish sequential ARPU at QR128. ARPU growth was driven by postpaid customers that contributed 18% of total revenue (vs. 17% in March 2014). The company reported a quarterly EBITDA margin of 27.2% vs. our estimate of 28.5% and March 2014 quarter’s 27.7%. VFQS’ June 2014 quarter's EBITDA of QR159mn (+4% QoQ, +61% YoY) was 2% lower than our estimate of QR163mn. (QE, QNBFS) GISS 1H2014 net profit rises 58% YoY to QR463.7mn – Gulf International Services (GISS) posted a net profit of QR463.7mn in 1H2014, up 58% on QR170.6mn in 1H2013. The rise in earnings stemmed from growth across all its business portfolios, particularly drilling operations. GISS recorded revenue of QR1.59bn in 1H2014. Robust performance from GDI drove the QoQ and YoY growth. Several initiatives drove GDI’s growth in 2Q2014. first and foremost, GISS completed the buy-out of Japan Drilling Company Limited’s 30% shareholding in Gulf Drilling International for a total consideration of $157.7mn, resulting in GDI becoming a 100% subsidiary of GISS with effect from May 1, 2014. The buy-out contributed an additional profit of QR40.0mn for two months period ended 30 June 2014. Revenue in the Drilling segment closed the first half of 2014 at QR697.6mn, a YoY increase of QR316.5mn, or 83%. QISI reports QR48.6mn net profit in 1H2014 – Qatar Islamic Insurance Company’s (QISI) net profit increased to QR48.6mn in 1H2014 from QR35.8mn in 1H2013. EPS stood at QR3.24 in 1H2014 as compared to QR2.39 in 1H2013. (QE) ORDS registers 2% YoY decline in 1H2014 net profit – Ooredoo’s (ORDS) net profit fell by 2% YoY to QR1.7bn in 1H2014. ORDS’ revenue dipped to QR16.5bn in 1H2014, down 3% compared to 1H2013, despite the strong performance in Qatar, Oman and Algeria that was offset by decline in revenue in Indonesia, Kuwait and Iraq. ORDS’ EBITDA decreased by 10% YoY to QR6.8bn in 1H2014 (1H2013: QR 7.6bn) with EBITDA margin decreasing to 42% (1H2013: 45%) due to lower revenues and the continued investment across the business into customer acquisition and retention, global brand roll-out, service launches and customer experience. The company’s customer base rose 2% YoY to 93.9 mn in 1H2014 backed by its increasing share across markets. (Peninsula Qatar) UDCD 1H2014 profit up 34% to QR521mn – United Development Company (UDCD) posted a 34% increase in net profit to QR521mn in 1H2014 compared with QR389mn in 1H2013 riding on strong show by group companies. UDCD’ EPS reached QR1.41 for 1H2014, compared with QR0.92 in 1H2013, up 53%. The Company’s gross profit stood at QR702mn in 1H2014, compared with QR508mn in 1H2013. (Gulfbase.com) BRES posts QR222.2mn net profit in 1H2014 – Barwa Real Estate Company (BRES) reported a net profit of QR222.2mn in 1H2014 as compared to QR199.2mn in 1H2013. The Company’s EPS amounted to QR0.58 in 1H2014 versus QR0.52 in 1H2013. (QE) IQCD to announce results on August 10 – Industries Qatar (IQCD) will disclose its financial reports for the period ending June 30, 2014, on August 10, 2014. (QE) ERES 1H2014 net profit reaches QR718.1mn – Ezdan Holding Group Company (ERES) reported a strong increase in its net profit reaching to QR718.1mn in 1H2014 as compared to QR478.7mn in 1H2013. EPS amounted to QR0.27 in 1H2014 as compared to QR0.18 in 1H2013. (QE) QIGD posts net profit of QR119.5mn in 1H2014 – Qatari Investors Group (QIGD) has posted a net profit of QR119.5mn in 1H2014 as compared to QR111.3mn in 1H2013. QIGD’s EPS stood at QR0.96 in 1H2014 vs. QR0.90 for 1H2013. (QE) Woqod posts net profit of QR530mn in 1H2014 – Woqod (QFLS) posted a 12.5% YoY increase in its net profit to QR530mn in 1H2014. The company’s assets exceeded QR10.4bn in 1H2014, up 9.65% as compared to 1H2013. EPS amounted to QR6.28 for 1H2014, compared with QR5.58 for 1H2013. During 1H2014, the total volume of sales of petroleum products (diesel, gasoline and jet fuel) reached 3,446mn litres, registering an increase of 11.6% as compared to 1H2013. (Gulf-Times.com) QIMD discloses a net profit of QR80.4mn in 1H2014 – Qatar Industrial Manufacturing Company (QIMD) reported a net profit of QR80.4mn in 1H2014 as compared to QR80.7mn in 1H2013. EPS stood at QR1.69 in 1H2014 versus QR1.70 in 1H2013.
- 3. Page 3 of 5 Qatar Exchange Top 5 Gainers Top 5 Decliners Source: Qatar Exchange (QE) Source: Qatar Exchange (QE) Most Active Shares by Value (QR Million) Most Active Shares by Volume (Million) Source: Qatar Exchange (QE) Source: Qatar Exchange (QE) Investor Trading Percentage to Total Value Traded Net Traded Value by Nationality (QR Million) Source: Qatar Exchange (QE) Source: Qatar Exchange (QE) 5.7% 3.4% 2.8% 1.9% 1.5% 0.0% 2.0% 4.0% 6.0% United Development QNB Group Gulf International Services Qatar Islamic Insurance Mesaieed Petrochemical Holding Company -14.9% -10.4% -10.0% -7.8% -7.4% -19.0% -13.0% -7.0% -1.0% Ezdan Real Estate Qatar Cinema & Film Distribution Barwa Real Estate Dlala Holding Milaha 382.3 370.1 299.6 230.8 187.8 0.0 133.0 266.0 399.0 United Development Masraf Al Rayan Barwa Real Estate Gulf International Services Ezdan Real Estate 13.6 8.6 7.2 6.9 6.7 0.0 5.0 10.0 15.0 United Development Ezdan Real Estate Salam International Investment Barwa Real Estate Masraf Al Rayan 0% 20% 40% 60% 80% 100% Buy Sell 47.47% 55.58% 21.42% 16.88% 14.47% 13.76% 16.64% 13.78% Qatari Individuals Qatari Institutions Non-Qatari Individuals Non-Qatari Institutions 2,364 1,068 2,487 945 (123) 123 (500) - 500 1,000 1,500 2,000 2,500 3,000 Qatari Non-Qatari Net Investment Total Sold Total Bought
- 4. Page 4 of 5 TECHNICAL ANALYSIS OF THE QE INDEX Source: Bloomberg The QE Index snapped its three-week winning streak and shed around 332 points to end below the 13,000.0 psychological level. The price action on Thursday was largely responsible for dragging the index below the important psychological level. Meanwhile, the index failed to make any further headway above the 13,350.0-13,400.0 levels and drifted lower in four out of the five trading sessions as traders opted to book profits. Looking ahead, the index has its immediate support near 12,900.0. Traders are advised to keep a close watch near this level, as any drop below this level could trigger selling pressure, which may pull the index further down to test the 55-day moving average (currently at 12,854.28), followed by 12,770.0. On the other hand, the index faces its resistance near the 13,000.0 and 13,100.0 psychological levels. Any move above these levels may spark increased optimism among traders and may push the index toward the 13,200.0-13,350.0 levels. For now, both the momentum indicators are providing bearish signals indicating that the weakness may continue. Thus, traders are advised to trade only when there is any further clarity on the direction of the index. DEFINITIONS OF KEY TERMS USED IN TECHNICAL ANALYSIS RSI (Relative Strength Index) indicator – RSI is a momentum oscillator that measures the speed and change of price movements. The RSI oscillates between 0 to 100. The index is deemed to be overbought once the RSI approaches the 70 level, indicating that a correction is likely. On the other hand, if the RSI approaches 30, it is an indication that the index may be getting oversold and therefore likely to bounce back. MACD (Moving Average Convergence Divergence) indicator – The indicator consists of the MACD line and a signal line. The divergence or the convergence of the MACD line with the signal line indicates the strength in the momentum during the uptrend or downtrend, as the case may be. When the MACD crosses the signal line from below and trades above it, it gives a positive indication. The reverse is the situation for a bearish trend. Candlestick chart – A candlestick chart is a price chart that displays the high, low, open, and close for a security. The ‘body’ of the chart is portion between the open and close price, while the high and low intraday movements form the ‘shadow’. The candlestick may represent any time frame. We use a one-day candlestick chart (every candlestick represents one trading day) in our analysis. Doji candlestick pattern – A Doji candlestick is formed when a security's open and close are practically equal. The pattern indicates indecisiveness, and based on preceding price actions and future confirmation, may indicate a bullish or bearish trend reversal. Shooting Star/Inverted Hammer candlestick patterns – These candlestick patterns have a small real body (open price and close price are near to each other), and a long upper shadow (large intraday movement on the upside). The Shooting Star is a bearish reversal pattern that forms after a rally. The Inverted Hammer looks exactly like a Shooting Star, but forms after a downtrend. Inverted Hammers represent a potential bullish trend reversal.
- 5. Contacts Saugata Sarkar Abdullah Amin, CFA Shahan Keushgerian Head of Research Senior Research Analyst Senior Research Analyst Tel: (+974) 4476 6534 Tel: (+974) 4476 6569 Tel: (+974) 4476 6509 saugata.sarkar@qnbfs.com.qa abdullah.amin@qnbfs.com.qa shahan.keushgerian@qnbfs.com.qa Sahbi Kasraoui Ahmed Al-Khoudary QNB Financial Services SPC Manager – HNWI Head of Sales Trading – Institutional Contact Center: (+974) 4476 6666 Tel: (+974) 4476 6544 Tel: (+974) 4476 6548 PO Box 24025 sahbi.alkasraoui@qnbfs.com.qa ahmed.alkhoudary@qnbfs.com.qa Doha, Qatar DISCLAIMER: This publication has been prepared by QNB Financial Services SPC (“QNBFS”) a wholly-owned subsidiary of Qatar National Bank (“QNB”). QNBFS is regulated by the Qatar Financial Markets Authority and the Qatar Exchange; QNB is regulated by the Qatar Central Bank. This publication expresses the views and opinions of QNBFS at a given time only. It is not an offer, promotion or recommendation to buy or sell securities or other investments, nor is it intended to constitute legal, tax, accounting, or financial advice. We therefore strongly advise potential investors to seek independent professional advice before making any investment decision. Although the information in this report has been obtained from sources that QNBFS believes to be reliable, we have not independently verified such information and it may not be accurate or complete. While this publication has been prepared with the utmost degree of care by our analysts, QNBFS does not make any representations warranties as to the accuracy and completeness of the information it may contain, and declines any liability in that respect. QNBFS reserves the right to amend the views and opinions expressed in this publication at any time. It may also express viewpoints or make investment decisions that differ significantly from, or even contradict, the views and opinions included in this report. COPYRIGHT: No part of this document may be reproduced without the explicit written permission of QNBFS. Page 5 of 5 Source: Bloomberg Com pany Nam e Price (July 24) % Change 5-Day % Change YTD Market Cap. QR Million TTM P/E P/B Div. Yield Qatar National Bank 183.30 3.38 6.57 128,260 13.0 2.4 3.8 Qatar Islamic Bank 103.00 (4.63) 49.28 24,338 17.2 2.1 3.9 Commercial Bank of Qatar 68.20 (3.54) 15.59 20,251 12.7 1.3 2.4 Doha Bank 56.20 (5.86) (3.44) 14,521 10.2 1.3 8.0 Al Ahli Bank 52.10 (1.51) 23.15 8,607 15.4 2.2 N/A Qatar International Islamic Bank 83.00 (4.49) 34.52 12,564 16.0 2.4 4.5 Masraf Al Rayan 53.60 (2.90) 71.25 40,200 22.5 3.9 2.8 Al Khaliji Bank 22.50 0.00 12.56 8,100 15.6 1.4 4.4 National Leasing 30.20 (4.28) 0.17 1,494 23.9 1.2 5.0 Dlala Holding 53.00 (7.83) 139.82 1,177 15.0 4.3 N/A Qatar & Oman Investment 14.85 (5.35) 18.61 468 19.0 1.4 4.0 Islamic Holding Group 68.60 (3.11) 49.13 274 22.6 4.6 2.5 Banking and Financial Services 260,254 Zad Holding 81.40 0.49 17.12 1,065 9.9 0.7 4.3 Qatar German Co. for Medical Devices 13.95 (1.34) 0.72 161 N/M 0.9 N/A Salam International Investment 19.00 (2.81) 46.04 2,172 16.9 1.4 5.3 Medicare Group 100.90 (0.39) 92.19 2,840 22.7 3.5 1.8 Qatar Cinema & Film Distribution 46.50 (10.40) 15.96 266 23.1 1.9 N/A Qatar Fuel 215.00 (2.27) (1.62) 18,159 15.2 3.0 3.6 Qatar Meat and Livestock 53.80 (5.61) 4.06 968 18.1 3.6 3.9 Al Meera Consumer Goods 181.00 (1.90) 35.78 3,620 16.5 2.9 4.4 Consum er Goods and Services 29,250 Qatar Industrial Manufacturing 46.55 0.00 10.40 2,212 11.0 1.5 N/A Qatar National Cement 132.80 (3.77) 11.60 6,521 14.6 2.7 4.5 Industries Qatar 174.90 (3.26) 3.55 105,815 15.0 3.7 6.3 Qatari Investors Group 51.30 (6.90) 17.39 6,378 27.9 2.9 1.5 Qatar Electricity and Water 185.50 (1.28) 12.18 20,405 13.9 3.4 3.7 Mannai Corp. 110.60 0.64 23.03 5,045 9.9 2.8 5.0 Aamal 16.00 (4.31) 6.67 9,600 18.2 1.4 N/A Gulf International Services 114.90 2.77 135.45 21,353 25.2 6.5 1.4 Mesaieed Petrochemical Holding 32.95 1.54 N/A 41,396 N/A 3.0 1.1 Industrials 218,724 Qatar Insurance 90.50 0.56 70.11 14,529 14.8 2.7 2.2 Doha Insurance 27.00 (2.35) 8.00 1,350 9.4 1.3 7.4 Qatar General Insurance & Reinsurance 45.00 (2.17) 12.73 3,113 2.2 0.7 2.8 Al Khaleej Takaful Insurance 45.00 (5.86) 60.27 999 11.7 1.5 N/A Qatar Islamic Insurance 82.60 1.85 42.66 1,239 14.8 4.8 4.5 Insurance 21,230 United Development 27.95 5.67 29.80 9,897 19.9 0.9 3.4 Barw a Real Estate 40.45 (10.01) 35.74 15,740 11.2 1.1 4.9 Ezdan Real Estate 20.00 (14.86) 17.65 53,050 41.1 1.8 1.6 Mazaya Qatar Real Estate Development 18.22 (4.61) 62.97 1,822 11.8 1.5 4.1 Real Estate 80,509 Qatar Telecom 128.00 (6.91) (6.71) 41,001 16.4 1.6 3.1 Vodafone Qatar 19.01 (7.04) 77.50 16,071 N/M 2.8 0.9 Telecom s 57,072 Qatar Navigation (Milaha) 92.00 (7.35) 10.84 10,536 11.7 0.8 5.4 Gulf Warehousing 50.20 (3.28) 20.96 2,388 20.4 3.0 3.0 Qatar Gas Transport (Nakilat) 23.40 (2.09) 15.56 13,104 15.9 3.5 4.7 Transportation 26,028 Qatar Exchange 693,067