Weekly market report
•
0 likes•255 views

The QSE Index gained slightly during the week but trading value and volume decreased. Ezdan Holding, Milaha, and Aamal Holding contributed most to the index gain, while Gulf International Services contributed negatively. Several companies reported quarterly earnings, with Milaha, Doha Bank, and Masraf Al Rayan reporting profits largely in line with estimates, while profits declined at Qatar Insurance, Medicare Group, United Development Company, and Gulf International Services. The market outlook and various companies' strategies were also discussed.

More Related Content
What's hot
What's hot (20)
Viewers also liked
Viewers also liked (20)
Similar to Weekly market report
Similar to Weekly market report (20)
More from QNB Group
More from QNB Group (20)
Recently uploaded
Recently uploaded (20)
Weekly market report
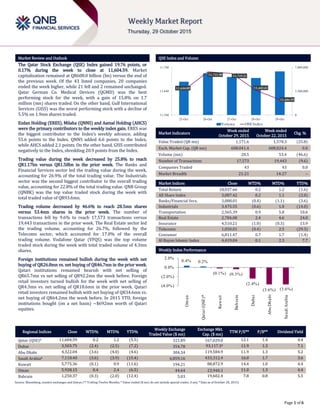
- 1. ` Page 1 of 6 Market Review and Outlook QSE Index and Volume The Qatar Stock Exchange (QSE) Index gained 19.76 points, or 0.17% during the week to close at 11,604.59. Market capitalization remained at QR608.0 billion (bn) versus the end of the previous week. Of the 43 listed companies, 20 companies ended the week higher, while 21 fell and 2 remained unchanged. Qatar German Co. Medical Devices (QGMD) was the best performing stock for the week, with a gain of 15.8% on 1.7 million (mn) shares traded. On the other hand, Gulf International Services (GISS) was the worst performing stock with a decline of 5.5% on 1.9mn shares traded. Ezdan Holding (ERES), Milaha (QNNS) and Aamal Holding (AHCS) were the primary contributors to the weekly index gain. ERES was the biggest contributor to the Index’s weekly advance, adding 55.6 points to the Index. QNNS added 6.6 points to the Index, while AHCS added 2.1 points. On the other hand, GISS contributed negatively to the Index, shredding 20.9 points from the Index. Trading value during the week decreased by 25.8% to reach QR1.17bn versus QR1.58bn in the prior week. The Banks and Financial Services sector led the trading value during the week, accounting for 26.9% of the total trading value. The Industrials sector was the second biggest contributor to the overall trading value, accounting for 22.8% of the total trading value. QNB Group (QNBK) was the top value traded stock during the week with total traded value of QR93.6mn. Trading volume decreased by 46.6% to reach 28.5mn shares versus 53.4mn shares in the prior week. The number of transactions fell by 9.6% to reach 17,573 transactions versus 19,443 transactions in the prior week. The Real Estate sector led the trading volume, accounting for 26.7%, followed by the Telecoms sector, which accounted for 17.0% of the overall trading volume. Vodafone Qatar (VFQS) was the top volume traded stock during the week with total traded volume of 4.3mn shares. Foreign institutions remained bullish during the week with net buying of QR26.8mn vs. net buying of QR46.7mn in the prior week. Qatari institutions remained bearish with net selling of QR65.7mn vs net selling of QR92.2mn the week before. Foreign retail investors turned bullish for the week with net selling of QR4.3mn vs. net selling of QR18.6mn in the prior week. Qatari retail investors remained bullish with net buying of QR34.6mn vs. net buying of QR64.2mn the week before. In 2015 YTD, foreign institutions bought (on a net basis) ~$692mn worth of Qatari equities. Market Indicators Week ended October 29, 2015 Week ended October 22, 2015 Chg. % Value Traded (QR mn) 1,171.6 1,578.3 (25.8) Exch. Market Cap. (QR mn) 608,041.4 608,024.4 0.0 Volume (mn) 28.5 53.4 (46.6) Number of Transactions 17,573 19,443 (9.6) Companies Traded 43 43 0.0 Market Breadth 21:21 14:27 – Market Indices Close WTD% MTD% YTD% Total Return 18,037.66 0.2 1.2 (1.6) All Share Index 3,087.42 0.2 1.1 (2.0) Banks/Financial Svcs. 3,088.01 (0.4) (1.1) (3.6) Industrials 3,475.55 (0.6) 1.0 (14.0) Transportation 2,565.39 0.9 5.8 10.6 Real Estate 2,784.08 2.4 4.6 24.0 Insurance 4,510.21 (1.0) (0.3) 13.9 Telecoms 1,050.01 (0.4) 2.5 (29.3) Consumer 6,811.47 0.7 1.7 (1.4) Al Rayan Islamic Index 4,419.04 0.1 2.3 7.7 Market Indices Weekly Index Performance Regional Indices Close WTD% MTD% YTD% Weekly Exchange Traded Value ($ mn) Exchange Mkt. Cap. ($ mn) TTM P/E** P/B** Dividend Yield Qatar (QSE)* 11,604.59 0.2 1.2 (5.5) 321.89 167,029.0 12.1 1.4 4.4 Dubai 3,503.75 (2.4) (2.5) (7.2) 354.78 93,117.3# 11.9 1.3 7.1 Abu Dhabi 4,322.04 (3.6) (4.0) (4.6) 304.34 119,584.9 11.9 1.3 5.2 Saudi Arabia# 7,118.40 (3.6) (3.9) (15.4) 6,859.16 433,312.4 16.0 1.7 3.6 Kuwait 5,775.36 (0.1) 0.9 (11.6) 194.21 88,872.9 14.4 1.0 4.4 Oman 5,928.15 0.4 2.4 (6.5) 44.64 23,940.3 11.0 1.3 4.4 Bahrain 1,250.37 (0.3) (2.0) (12.4) 5.03 19,602.4 7.8 0.8 5.5 Source: Bloomberg, country exchanges and Zawya (** Trailing Twelve Months; * Value traded ($ mn) do not include special trades, if any; # Data as of October 28, 2015) 11,644.09 11,721.90 11,715.21 11,643.61 11,604.59 0 3,500,000 7,000,000 11,540 11,640 11,740 25-Oct 26-Oct 27-Oct 28-Oct 29-Oct Volume QSEIndex 0.4% 0.2% (0.1%) (0.3%) (2.4%) (3.6%) (3.6%) (4.0%) (2.0%) 0.0% 2.0% Oman Qatar(QSE)* Kuwait Bahrain Dubai AbuDhabi SaudiArabia
- 2. Page 2 of 6 News Market & Corporate News Milaha bottom-line rises 7.6% QoQ in 3Q2015; in-line with our estimates – Qatar Navigation’s (Milaha) net profit rose 7.5% QoQ and 1.7% YoY in 3Q2015 to QR307.72mn, bang in-line with our estimates of QR307.58mn. Milaha Maritime & Logistics revenue grew by 35.8% YoY to QR255.67mn on the back of an increase in project and infrastructure activity in Qatar (container shipping and port volumes increased). Milaha Offshore reported revenue of QR198.36mn, growing by 12.4% YoY, mainly attributed to its diving services segment. Milaha Gas & Petrochem (MG&P) reported revenue of QR138.63mn. Revenue was driven by strong charter rates from its fully owned and operated product tankers and gas carriers. Moreover, MG&P bottom-line was aided by investments in associates. Milaha Capital’s performance was lackluster with revenue dropping by 54.8% YoY to QR87.49mn. The weak results were due subdued performance from the unit’s investment portfolio. Milaha Trading posted revenue of QR117.34mn, jumping by 19.8% YoY. The growth was driven by a pick-up in equipment sales. (QNBFS Research, QSE) DHBK net profit slides 10.6% QoQ in 3Q2015, in-line with QNBFS estimate – Doha Bank’s (DHBK) net profit slid 10.6% on a QoQ basis (-2.1% YoY) to QR340.8mn in 3Q2015, in-line with our estimate of QR354.4mn. The QoQ drop in profitability was due to a growth in provisions for credit losses and investment impairment provisions. DHBK posted net interest income of QR518.0mn (in-line with our estimate of QR496.2mn; +4.4% variation), growing by 3.5% QoQ (+6.0% YoY). Moreover, NIMs remained under pressure, dropping to 2.76% vs. 2.81% in 2Q2015 (3.0% in 3Q2015). Net loans grew by 2.6% QoQ (+12.1% YTD) to QR54.4bn, while customer deposits inched up by 0.6% QoQ (+13.3% YTD) QR52.0bn. Hence, the LDR moved up to 105% vs. 103% in 2q2015 (106% at the end of 2014). (QNBFS Research, Company financials) MARK records sequential improvement in 3Q2015 profitability, matches our estimate – Masraf Al Rayan recorded a 5.7% QoQ increase (-1.3% YoY) in 3Q2015 net profit to QR515.6mn. The bottom-line was in-line with our estimate of QR505.4mn (+2.0% diversion). The sequential growth was solely due to positive minority interest. Net interest and investment income dropped by 18.4% QoQ (down 17.6% YoY) to QR445.9mn. On the other hand, fees and F/X income gained by 5.8% QoQ (+16.7% YoY) and 23.7% QoQ (+1.3% YoY), respectively. Provisions for loans losses was negligible, which is usually the case. OPEX dropped by 9.6% QoQ (down 15.7%) to QR102.5mn. Thus MARK’s cost-to-income improved to 19.2% vs. 26.2% in 2Q2015. Net loans inched up by 0.8% QoQ (+3.6% YTD) to QR59.98bn while customer deposits contracted by 9.6% QoQ (down 15.7% YTD) to QR52.76bn. Thus MARK’s LDR jumped to 114% vs. 102% in 2Q2015 (93% at the end of 2014). Capital adequacy ratio under Basel-III standards reached 17.91% in September 2015 versus 17.79% in September 2014. The bank’s NPL ratio stood at 0.08%. (QNBFS Research, Company financials) GISS posts in-line results in 3Q2015 – Gulf International Services (GISS) registered QR216.9mn net profit in 3Q2015, in-line with our estimate of QR208.7mn (positive 3.9% variation). The net profit, down 13.1% on a sequential basis (-30.4% YoY), was majorly impacted by a 10.2% QoQ drop in 3Q2015 revenue to QR973.9mn. Further, other income (including finance income, net gains/ (loss) on financial assets at fair value through profit or loss and other income) dropped 85.6% QoQ to QR4.0mn. EPS fell to QR1.16 in 3Q2015 vs. QR1.35 in 2Q2015. (QNBFS Research, QSE) QATI bottom-line more than halves QoQ in 3Q2015 – Qatar Insurance Company’s (QATI) bottom-line declined 58.8% sequentially (-19.8% YoY) in 3Q2015 to QR115.7mn as compared to QR280.9mn in 3Q2014. Total other income (including investment income, advisory fee income, rental income & other income) played spoilsport as it dropped by 68.2% QoQ to QR87.6mn in 3Q2015. As a result, total income also fell 33.6% QoQ to QR300.2mn although net underwriting results jumped 20.1% from 2Q2015 to QR212.6mn in 3Q2015. Group President and CEO, Khalifa al-Subaey said the group’s financial results reflect increasingly competitive global (re)insurance market conditions, compounded by increased financial market volatility and the impact of falling oil prices on the Middle Eastern economies. He said that the outlook for both medical and life insurance business seems to be positive and is an area for further focused growth. He further added that on the back of new product launches that are underway and renewed focus on growth markets, QATI is confident that the book of business will continue to expand. (QNBFS Research, QSE, Gulf-Times.com) MCGS earnings drop in 3Q2015 – Medicare Group’s (MCGS) earnings declined to QR32.8mn in 3Q2015 from QR46.6mn in 2Q2015, reflecting a drop of 29.7% QoQ (-2.1% YoY). EPS amounted to QR1.17 in 3Q2015 as compared to QR1.66 in 2Q2015. (QSE, QNBFS Research) ERES net profit climbs 8.4% QoQ in 3Q2015 – Ezdan Holding Group’s (ERES) net profit expanded 8.4% QoQ (up 22.6% YoY) to QR364.0mn in 3Q2015. The bottom-line advanced on the back on around four fold jump in net gain on sale of available-for-sale financial assets to QR120.9mn in 3Q2015 from QR29.8mn in 2Q2015 while a 43.6% QoQ decline in general & administrative expenses to QR43.9mn also helped. However, share of results of equity accounted investees dropped 46.9% QoQ to QR64.3mn which impacted bottom-line negatively. The company’s rental income slipped 0.8% QoQ to QR383.6mn in 3Q2015 (up 7.7% YoY). ERES announced its intention to proceed with the implementation of its plans to achieve high growth levels through a new strategy based on the diversification of its investments through pumping revenues in different sectors across a number of promising stock exchange companies. The group through this strategy aims to achieve high return rates while minimizing risk for its core investments and ensuring their stability. Chairman of ERES, Sheikh Dr. Khalid bin Thani bin Abdullah Al Thani said the group has a number of investment plans, which will be announced once thoroughly studied. (QSE, QNBFS Research, Peninsula Qatar) UDCD profitability hit by lower revenue, drops 87.2% QoQ – United Development Company’s (UDCD) revenue recorded a 64.3% sequential decline (-52.9% YoY) in 3Q2015 to QR218.7mn. The extensive drop in revenue largely impacted the company’s net income, which amounted to QR37.9mn in 3Q2015 as compared to QR295.4mn in 2Q2015, reflecting a decrease of 87.2% QoQ (- 37.0% YoY). Chairman of UDCD, Turki Al Khater revealed that the company will soon be offering for sale residential plots at The Pearl-Qatar, which will enhance its prominent position in the real estate market. (QSE, QNBFS Research, Peninsula Qatar) BRES net income hit in 3Q2015 on impairment charges – Barwa Real Estate Company’s (BRES) net income shrank 34.8% QoQ (down 72.1% YoY) to QR125.9mn. The company booked QR19.9mn as net impairment losses in 3Q2015, which primarily dented the bottom-line. Further, net consulting income fell 14.5% QoQ to QR44.6mn while net rental & finance lease income slipped 2.5% sequentially to QR248.5mn. (QSE, QNBFS Research)
- 3. Page 3 of 6 Qatar Stock Exchange Top Gainers Top Decliners Source: Qatar Stock Exchange (QSE) Source: Qatar Stock Exchange (QSE) Most Active Shares by Value (QR Million) Most Active Shares by Volume (Million) Source: Qatar Stock Exchange (QSE) Source: Qatar Stock Exchange (QSE) Investor Trading Percentage to Total Value Traded Net Traded Value by Nationality (QR Million) Source: Qatar Stock Exchange (QSE) Source: Qatar Stock Exchange (QSE) 15.8% 3.7% 3.2% 3.1% 3.1% 0.0% 6.0% 12.0% 18.0% Qatar German Co. for Medical Devices Ezdan Real Estate Dlala Holding Islamic Holding Group Qatar Fuel -5.5% -5.1% -3.9% -3.8% -3.5% -6.0% -4.0% -2.0% 0.0% Gulf International Services Al Ahli Bank Qatar & Oman Investment Al Meera Consumer Goods National Leasing 126.6 93.6 90.8 84.4 84.2 0.0 50.0 100.0 150.0 Gulf International Services QNB Group Barwa Real Estate Qatar Gas Transport (Nakilat) Industries Qatar 4.3 3.4 2.6 2.0 1.9 0.0 2.0 4.0 6.0 Vodafone Qatar Qatar Gas Transport (Nakilat) Ezdan Real Estate Barwa Real Estate Gulf International Services 0% 20% 40% 60% 80% 100% Buy Sell 36.32% 33.37% 19.18% 24.79% 14.27% 13.90% 30.23% 27.94% Qatari Individuals Qatari Institutions Non-Qatari Individuals Non-Qatari Institutions 650 521 681 490 (31) 31 (100) - 100 200 300 400 500 600 700 800 Qatari Non- Qatari Net Investment Total Sold Total Bought
- 4. Page 4 of 6 TECHNICAL ANALYSIS OF THE QSE INDEX Source: Bloomberg The QSE Index moved marginally up by 0.17% vs the previous week; it is still moving in a short-term trading range. Uncertainty prevailed in the market as seen by the neutrality of movement and the low trading volumes. In turn, technical indicators were inactive and showed no signs of a projected move into one direction or the other. Weekly support and resistance levels remain around the 11,000 level and the 12,000 level, respectively. DEFINITIONS OF KEY TERMS USED IN TECHNICAL ANALYSIS RSI (Relative Strength Index) indicator – RSI is a momentum oscillator that measures the speed and change of price movements. The RSI oscillates between 0 to 100. The index is deemed to be overbought once the RSI approaches the 70 level, indicating that a correction is likely. On the other hand, if the RSI approaches 30, it is an indication that the index may be getting oversold and therefore likely to bounce back. MACD (Moving Average Convergence Divergence) indicator – The indicator consists of the MACD line and a signal line. The divergence or the convergence of the MACD line with the signal line indicates the strength in the momentum during the uptrend or downtrend, as the case may be. When the MACD crosses the signal line from below and trades above it, it gives a positive indication. The reverse is the situation for a bearish trend. Candlestick chart – A candlestick chart is a price chart that displays the high, low, open, and close for a security. The ‘body’ of the chart is portion between the open and close price, while the high and low intraday movements form the ‘shadow’. The candlestick may represent any time frame. We use a one-day candlestick chart (every candlestick represents one trading day) in our analysis. Doji candlestick pattern – A Doji candlestick is formed when a security's open and close are practically equal. The pattern indicates indecisiveness, and based on preceding price actions and future confirmation, may indicate a bullish or bearish trend reversal. Shooting Star/Inverted Hammer candlestick patterns – These candlestick patterns have a small real body (open price and close price are near to each other), and a long upper shadow (large intraday movement on the upside). The Shooting Star is a bearish reversal pattern that forms after a rally. The Inverted Hammer looks exactly like a Shooting Star, but forms after a downtrend. Inverted Hammers represent a potential bullish trend reversal.
- 5. Page 5 of 6 Source: Bloomberg Company Name Price (Oct 29) % Change WTD % Change YTD Market Cap. QR Million TTM P/E P/B Div. Yield Qatar National Bank 182.50 0.27 (14.28) 127,701 11.4 2.3 4.1 Qatar Islamic Bank 118.20 (0.34) 15.66 27,930 15.0 1.9 3.6 Commercial Bank of Qatar 53.20 (2.92) (14.57) 17,377 10.4 1.0 6.0 Doha Bank 49.50 0.00 (13.16) 12,789 9.4 1.0 8.1 Al Ahli Bank 47.00 (5.05) (5.31) 8,541 13.2 N/A 2.9 Qatar International Islamic Bank 74.90 (1.45) (8.32) 11,338 13.2 2.3 5.3 Masraf Al Rayan 43.20 (0.46) (2.26) 32,400 15.5 0.6 4.1 Al Khaliji Bank 21.40 (0.47) (2.95) 7,704 12.3 1.3 4.7 National Leasing 17.35 (3.50) (13.25) 858 N/A 0.7 4.9 Dlala Holding 21.65 3.19 (35.25) 615 N/A 1.7 N/A Qatar & Oman Investment 13.73 (3.92) (10.84) 432 6.7 1.2 5.8 Islamic Holding Group 102.60 3.12 (17.59) 410 41.7 6.6 2.9 Banking and Financial Services 248,095 Zad Holding 91.00 (0.55) 8.33 1,190 6.6 1.5 4.3 Qatar German Co. for Medical Devices 16.68 15.83 64.33 193 N/A 1.2 N/A Salam International Investment 12.81 (0.16) (19.18) 1,464 19.2 0.9 4.7 Medicare Group 164.80 (1.32) 40.85 4,638 23.7 5.1 1.1 Qatar Cinema & Film Distribution 38.00 0.00 (5.00) 239 18.4 1.7 2.4 Qatar Fuel 162.50 3.11 (20.46) 13,725 11.8 2.1 5.5 Widam Food Co. 52.60 0.19 (12.91) 947 14.0 3.7 4.8 Al Meera Consumer Goods 234.40 (3.82) 17.20 4,688 23.1 3.5 3.8 Consumer Goods and Services 27,084 Qatar Industrial Manufacturing 42.80 0.23 (1.27) 2,034 13.2 1.4 7.0 Qatar National Cement 106.00 (1.94) (11.67) 5,725 12.8 2.2 3.4 Industries Qatar 123.00 0.08 (26.79) 74,415 13.7 2.3 5.7 Qatari Investors Group 46.60 (0.85) 12.56 5,794 24.1 2.5 1.6 Qatar Electricity and Water 212.60 0.76 13.39 23,386 15.5 3.3 3.5 Mannai Corp. 98.60 0.10 (9.54) 4,498 8.5 2.0 6.1 Aamal 14.50 2.11 0.23 9,135 14.4 1.3 6.6 Gulf International Services 64.10 (5.46) (33.99) 11,912 8.2 3.0 8.6 Mesaieed Petrochemical Holding 21.00 (1.41) -28.8 26,383 21.9 1.9 5.2 Industrials 163,282 Qatar Insurance 93.00 (1.06) 18.05 17,170 18.8 3.1 2.3 Doha Insurance 23.10 (0.26) (20.34) 1,155 13.9 1.1 4.3 Qatar General Insurance & Reinsurance 55.60 (1.59) 8.37 4,423 5.0 0.8 3.1 Al Khaleej Takaful Insurance 33.65 1.97 (23.82) 859 17.6 1.4 3.9 Qatar Islamic Insurance 73.80 0.41 (6.58) 1,107 14.8 3.6 5.4 Insurance 24,714 United Development 24.57 0.29 4.15 8,700 13.1 0.8 5.1 Barw a Real Estate 44.90 0.34 7.16 17,472 2.9 1.0 4.9 Ezdan Real Estate 19.50 3.67 30.70 51,724 32.5 1.7 2.1 Mazaya Qatar Real Estate Development 16.28 0.18 (10.74) 1,709 9.9 1.3 1.8 Real Estate 79,605 Ooredoo 77.80 0.78 (37.21) 24,921 13.8 1.2 5.1 Vodafone Qatar 14.45 (3.34) (12.16) 12,216 N/A 2.3 1.5 Telecoms 37,137 Qatar Navigation (Milaha) 99.10 1.95 (0.40) 11,349 9.5 0.8 5.5 Gulf Warehousing 62.60 2.12 21.60 2,977 18.8 3.5 2.2 Qatar Gas Transport (Nakilat) 24.64 (0.08) 6.67 13,798 14.2 3.7 4.9 Transportation 28,125 Qatar Exchange 608,041
- 6. Contacts Saugata Sarkar Sahbi Kasraoui QNB Financial Services SPC Head of Research Head of HNI Contact Center: (+974) 4476 6666 Tel: (+974) 4476 6534 Tel: (+974) 4476 6544 PO Box 24025 saugata.sarkar@qnbfs.com.qa sahbi.alkasraoui@qnbfs.com.qa Doha, Qatar Disclaimer and Copyright Notice: This publication has been prepared by QNB Financial Services SPC (“QNBFS”) a wholly-owned subsidiary of QNB SAQ (“QNB”). QNBFS is regulated by the Qatar Financial Markets Authority and the Qatar Exchange QNB SAQ is regulated by the Qatar Central Bank. This publication expresses the views and opinions of QNBFS at a given time only. It is not an offer, promotion or recommendation to buy or sell securities or other investments, nor is it intended to constitute legal, tax, accounting, or financial advice. QNBFS accepts no liability whatsoever for any direct or indirect losses arising from use of this report. Any investment decision should depend on the individual circumstances of the investor and be based on specifically engaged investment advice. We therefore strongly advise potential investors to seek independent professional advice before making any investment decision. Although the information in this report has been obtained from sources that QNBFS believes to be reliable, we have not independently verified such information and it may not be accurate or complete. QNBFS does not make any representations or warranties as to the accuracy and completeness of the information it may contain, and declines any liability in that respect. For reports dealing with Technical Analysis, expressed opinions and/or recommendations may be different or contrary to the opinions/recommendations of QNBFS Fundamental Research as a result of depending solely on the historical technical data (price and volume). QNBFS reserves the right to amend the views and opinions expressed in this publication at any time. It may also express viewpoints or make investment decisions that differ significantly from, or even contradict, the views and opinions included in this report. This report may not be reproduced in whole or in part without permission from QNBFS COPYRIGHT: No part of this document may be reproduced without the explicit written permission of QNBFS. Page 6 of 6