QNBFS Weekly Market Report September 02, 2021
•
0 likes•157 views

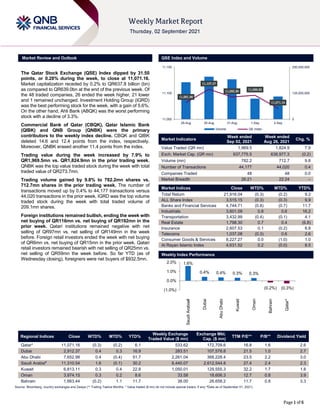
The Qatar Stock Exchange (QSE) Index dipped by 31.50 points, or 0.28% during the week, to close at 11,071.16.

Recommended
More Related Content
What's hot
What's hot (20)
Similar to QNBFS Weekly Market Report September 02, 2021
Similar to QNBFS Weekly Market Report September 02, 2021 (20)
More from QNB Group
More from QNB Group (20)
Recently uploaded
Recently uploaded (20)
QNBFS Weekly Market Report September 02, 2021
- 1. ``````` Page 1 of 6 Market Review and Outlook QSE Index and Volume The Qatar Stock Exchange (QSE) Index dipped by 31.50 points, or 0.28% during the week, to close at 11,071.16. Market capitalization receded by 0.2% to QR637.8 billion (bn) as compared to QR639.0bn at the end of the previous week. Of the 48 traded companies, 26 ended the week higher, 21 lower and 1 remained unchanged. Investment Holding Group (IGRD) was the best performing stock for the week, with a gain of 5.6%. On the other hand, Ahli Bank (ABQK) was the worst performing stock with a decline of 3.3%. Commercial Bank of Qatar (CBQK), Qatar Islamic Bank (QIBK) and QNB Group (QNBK) were the primary contributors to the weekly index decline. CBQK and QIBK deleted 14.6 and 12.4 points from the index, respectively. Moreover, QNBK erased another 11.4 points from the index. Trading value during the week increased by 7.9% to QR1,969.5mn vs. QR1,824.9mn in the prior trading week. QNBK was the top value traded stock during the week with total traded value of QR273.7mn. Trading volume gained by 9.8% to 782.2mn shares vs. 712.7mn shares in the prior trading week. The number of transactions moved up by 0.4% to 44,177 transactions versus 44,020 transactions in the prior week. IGRD was the top volume traded stock during the week with total traded volume of 209.1mn shares. Foreign institutions remained bullish, ending the week with net buying of QR116mn vs. net buying of QR192mn in the prior week. Qatari institutions remained negative with net selling of QR97mn vs. net selling of QR149mn in the week before. Foreign retail investors ended the week with net buying of QR6mn vs. net buying of QR15mn in the prior week. Qatari retail investors remained bearish with net selling of QR25mn vs. net selling of QR59mn the week before. So far YTD (as of Wednesday closing), foreigners were net buyers of $932.5mn. Market Indicators Week ended Sep 02, 2021 Week ended Aug 26, 2021 Chg. % Value Traded (QR mn) 1,969.5 1,824.9 7.9 Exch. Market Cap. (QR mn) 637,775.5 638,977.3 (0.2) Volume (mn) 782.2 712.7 9.8 Number of Transactions 44,177 44,020 0.4 Companies Traded 48 48 0.0 Market Breadth 26:21 22:24 – Market Indices Close WTD% MTD% YTD% Total Return 21,916.04 (0.3) (0.2) 9.2 ALL Share Index 3,515.15 (0.3) (0.3) 9.9 Banks and Financial Services 4,744.71 (0.8) (0.7) 11.7 Industrials 3,601.09 0.8 0.6 16.2 Transportation 3,432.99 (0.4) (0.1) 4.1 Real Estate 1,798.30 0.7 0.4 (6.8) Insurance 2,607.53 0.1 (0.2) 8.8 Telecoms 1,037.08 (0.3) 0.6 2.6 Consumer Goods & Services 8,227.27 0.0 (1.0) 1.0 Al Rayan Islamic Index 4,631.52 0.2 (0.0) 8.5 Weekly Index Performance Regional Indices Close WTD% MTD% YTD% Weekly Exchange Traded Value ($ mn) Exchange Mkt. Cap. ($ mn) TTM P/E** P/B** Dividend Yield Qatar* 11,071.16 (0.3) (0.2) 6.1 533.62 172,709.6 16.8 1.6 2.6 Dubai 2,912.37 0.4 0.3 16.9 283.51 107,578.8 21.5 1.0 2.7 Abu Dhabi 7,652.98 0.4 (0.4) 51.7 2,261.04 368,228.4 23.5 2.2 3.0 Saudi Arabia# 11,310.54 1.6 (0.1) 30.2 8,440.07 2,612,544.8 27.4 2.4 2.3 Kuwait 6,813.11 0.3 0.4 22.8 1,050.01 129,555.3 32.2 1.7 1.8 Oman 3,974.15 0.3 0.2 8.6 33.58 18,606.3 12.7 0.8 3.9 Bahrain 1,663.44 (0.2) 1.1 11.7 38.00 26,658.2 11.7 0.8 3.3 Source: Bloomberg, country exchanges and Zawya (** Trailing Twelve Months; * Value traded ($ mn) do not include special trades, if any; #Data as of September 01, 2021) 11,081.98 11,107.57 11,092.90 11,096.02 11,071.16 0 125,000,000 250,000,000 11,050 11,100 11,150 29-Aug 30-Aug 31-Aug 1-Sep 2-Sep Volume QE Index 1.6% 0.4% 0.4% 0.3% 0.3% (0.2%) (0.3%) (1.0%) 0.0% 1.0% 2.0% Saudi Arabia# Dubai Abu Dhabi Kuwait Oman Bahrain Qatar*
- 2. Page 2 of 6 Economic, Market & Company News Qatar and Saudi Arabia set up coordination council – On August 25th Saudi Arabia's minister of state, Musaed bin Mohammed Al-Aiban, and Qatar's Deputy Prime minister and Minister of Foreign Affairs, Sheikh Mohammed bin Abdulrahman Al-Thani, signed a protocol amendment for the establishment of the Qatari-Saudi Coordination Council. The signing of the agreement came as the two ministers met in the Saudi city of Neom to discuss measures to strengthen relations between the two countries. Saudi Arabia, the initiator of the rapprochement process with Qatar, has continued to take the lead in reconciling with Qatar, following the signing of the Al Ula agreement in January to restore trade, travel and diplomatic ties. Relations between Qatar and Saudi Arabia were restored quickly and have continuously improved since then. Qatar appointed an ambassador to Saudi Arabia at the beginning of August, and the two countries have now agreed to set up Qatari-Saudi Coordination Council to boost cooperation and consolidate their relations. The establishment of the co-ordination council supports The Economist Intelligence Unit's forecast that Qatar will continue to improve relations with Saudi Arabia, with Gulf reconciliation driven mainly by the prospect of expanded trade and investment ties. (Bloomberg) New bond issue: QNB Group issued international bonds (XS2382173008) with a 1.13% coupon maturing in 2024 – QNB Group issued international bonds (XS2382173008) with a 1.13% maturing in 2024. The bookrunner is HSBC. (Bloomberg) MARK: Amending the timing of the EGM – In reference to the invitation extended to our shareholders to attend Masraf Al Rayan (MARK) Extraordinary General Assembly Meeting (to be held virtually in Dukhan Hall - Sheraton Doha Hotel, through ZOOM platform, on September 08, 2021, and on September 28, 2021 (if the quorum is not reached in the first meeting). We would like to inform our shareholders that the time of the meeting has changed to start at 4:30 pm instead of 5:30 pm. (QSE) Qatar-issued green bonds, sukuk and ESG funds to be launched soon – Qatar green bonds, sukuk and ESG (environment, social and governance) funds are soon expected to be in place as the country is “primed” to take advantage of the trend of carbon target, according to a senior official of the Qatar Financial Centre (QFC) "With Qatar Petroleum's (QP) aggressive green investments, the Qatar Stock Exchange’s guidance on ESG reporting, and QFC’s institutional backing, there is a strong likelihood Qatar-issued green bonds, sukuks and ESG funds will be launched shortly," Senior Advisor for Economics and Research, QFC Authority, Thaddeus Malesa wrote in an article. With the country foreseen to run a substantial budget surplus starting this year, times of capital accumulation have returned, he said, adding the outlook for sustained financial surpluses is well defined. Whereas Qatar is set to earn more export revenue from the outlined energy investments, its imports are growing at a far lesser rate – enabling aggregate excess returns to be invested through the QFC institutions, according to him. Concurrently, the array of QFC financial institutions continues to grow as specialist funds, wealth managers and re- insurance firms join to provide services to and from Qatar, Malesa said. (Gulf-Times.com) QFBQ plans to raise capital by 60% via rights issue – Qatar First Bank (QFBQ) seeks shareholder approval to raise capital to QR1.12bn from QR700mn. At par value of QR1 with an additional premium per share is to be determined by the Chairman. (Bloomberg) Kamco Invest: Qatar banks display lowest NPLs, highest ROE in 2Q2021 – Qatari banks had the lowest bad loans on their books as well as the highest provision cover and return on equity (ROE) among the Gulf Cooperation Council (GCC) lenders during the second quarter (2Q 2021), according to Kamco Invest, a Kuwait-based non-banking financial powerhouse. The Qatari banks' Stage 3 impaired loans stood at 2.5% (of the gross loans) at the end of 2Q2021, a slight jump from 2.4% in the first quarter (1Q2021); even as the average share of bad loans (Stage 3 loans) on the GCC banks’ loan books remained stable quarter- on-quarter at 4.2%. The non-performing loans (NPLs) for the UAE banks continued to remain the highest in the GCC at 6.1% at the end of 2Q2021, in line with 1Q2021 share. In the case of Bahrain banks, it was 4.7%, Oman (4.1%) and Kuwait (2.7%). The report found that the aggregate provision cover (excluding Saudi Arabian banks) that GCC banks made against Stage 3 bad loans stood at 66.4% at the end of 2Q2021. The provision cover has increased "consistently" since last year when it stood at 64.7% (excluding Saudi Arabian banks) and in 1Q2021 at 65.4%. Qatari banks were found to have the highest cover against Stage 3 bad loans in the GCC during the quarter at 91.4%, slightly lower than the 1Q2021 cover of 91.9%. Bahraini banks were next at 69.1%, followed by Omani and Kuwaiti banks at 61.8% and 60.3% respectively. The UAE banks reported the lowest Stage 3 provision cover of 58.8%. (Gulf-Times.com) Qatar’s auto sector maintains bullish trend in July – Qatar's automobile sector maintained a bullish trend MoM this July, mainly on the back of a robust double-digit growth in the registration of new vehicles, especially for private use and heavy equipment, according to the official statistics. The new vehicle registration stood at 5,440; representing a 4% MoM growth but was down 2.5% YoY in the review period. The registration of private vehicles stood at 3,337, which registered a 10.6% and 2.2% increase MoM and YoY respectively in July 2021. Such vehicles constituted more than 61% of the total new vehicles registered in the country in the review period. Of the new 5,440 vehicles registered this July, the registration of new private transport vehicles stood at 1,456; which constituted 27% of the total new vehicles. Such registrations saw 0.8% and 9.3% jump on monthly and yearly basis respectively in July 2021. According to the Qatar Central Bank data, auto loans to Qataris and non- Qataris were seen declining 29.88% and 19.23% YoY respectively to QR1.15bn and QR0.21bn this July. The personal loans to Qataris reported 18.71% shrinkage YoY to QR48.54bn and those to non-Qataris by 16.32% to QR8.1bn in the review period. The overall consumption credit to nationals grew 10.9% YoY to QR141.23bn; while that to non-Qataris shrank 12.83% to QR11.48bn in July this year. (Gulf-Times.com)
- 3. Page 3 of 6 Qatar Stock Exchange Top Gainers Top Decliners Source: Qatar Stock Exchange (QSE) Source: Qatar Stock Exchange (QSE) Most Active Shares by Value (QR Million) Most Active Shares by Volume (Million) Source: Qatar Stock Exchange (QSE) Source: Qatar Stock Exchange (QSE) Investor Trading Percentage to Total Value Traded Net Traded Value by Nationality (QR Million) Source: Qatar Stock Exchange (QSE) Source: Qatar Stock Exchange (QSE) 5.6% 4.0% 3.6% 3.5% 3.2% 0.0% 2.0% 4.0% 6.0% Investment Holding Group Al Khaleej Takaful Insurance Company Qatari German Company for Medical Devices Mannai Corporation Widam Food Company -3.3% -2.5% -2.0% -1.6% -1.6% -4.5% -3.0% -1.5% 0.0% Ahli Bank Zad Holding Company Qatari Investors Group Medicare Group The Commercial Bank 273.7 259.1 139.6 127.1 124.5 0.0 100.0 200.0 300.0 QNB Group Investment Holding Group Masraf Al Rayan Industries Qatar Qatar Islamic Bank 209.1 91.8 69.3 51.3 43.0 0.0 80.0 160.0 240.0 Investment Holding Group Salam International Investment Limited Qatar Aluminium Manufacturing Company Baladna Gulf International Services 0% 20% 40% 60% 80% 100% Buy Sell 37.43% 38.68% 17.51% 22.46% 14.38% 14.06% 30.68% 24.80% Qatari Individuals Qatari Institutions Non-Qatari Individuals Non-Qatari Institutions 1,082 887 1,204 765 -122 122 -500 0 500 1,000 1,500 Qatari Non-Qatari Net Investment Total Sold Total Bought
- 4. Page 4 of 6 TECHNICAL ANALYSIS OF THE QSE INDEX Source: Bloomberg The QSE Index was last closed at 11,071.16, recording a 0.28% decline than the previous week. The Index has currently been facing pullback after reaching all-time highs level and thus remains in corrective pressure. Still, the moving averages are positively stacked, due to which we can expect the index to test the strength of its near term resistance. We can also expect the index to remain volatile until a clear breakout can be observed. Our projected resistance level remains at the 11,500 points and the support level at the 10,500 points. DEFINITIONS OF KEY TERMS USED IN TECHNICAL ANALYSIS RSI (Relative Strength Index) indicator – RSI is a momentum oscillator that measures the speed and change of price movements. The RSI oscillates between 0 to 100. The index is deemed to be overbought once the RSI approaches the 70 level, indicating that a correction is likely. On the other hand, if the RSI approaches 30, it is an indication that the index may be getting oversold and therefore likely to bounce back. MACD (Moving Average Convergence Divergence) indicator – The indicator consists of the MACD line and a signal line. The divergence or the convergence of the MACD line with the signal line indicates the strength in the momentum during the uptrend or downtrend, as the case may be. When the MACD crosses the signal line from below and trades above it, it gives a positive indication. The reverse is the situation for a bearish trend. Candlestick chart – A candlestick chart is a price chart that displays the high, low, open, and close for a security. The ‘body’ of the chart is portion between the open and close price, while the high and low intraday movements form the ‘shadow’. The candlestick may represent any time frame. We use a one-day candlestick chart (every candlestick represents one trading day) in our analysis. Doji candlestick pattern – A Doji candlestick is formed when a security's open and close are practically equal. The pattern indicates indecisiveness, and based on preceding price actions and future confirmation, may indicate a bullish or bearish trend reversal. Shooting Star/Inverted Hammer candlestick patterns – These candlestick patterns have a small real body (open price and close price are near to each other), and a long upper shadow (large intraday movement on the upside). The Shooting Star is a bearish reversal pattern that forms after a rally. The Inverted Hammer looks exactly like a Shooting Star, but forms after a downtrend. Inverted Hammers represent a potential bullish trend reversal.
- 5. Page 5 of 6 Source: Bloomberg Company Name Price September 02 % Change WTD % Change YTD Market Cap. QR Million TTM P/E P/B Div. Yield Qatar National Bank 18.94 (0.99) 6.23 174,938 15.3 2.3 2.4 Qatar Islamic Bank 18.30 (0.76) 6.95 43,242 14.3 2.3 2.2 Commercial Bank of Qatar 6.00 (1.64) 36.25 24,263 16.2 1.3 1.7 Doha Bank 2.84 2.42 19.77 8,790 14.0 0.9 2.6 Al Ahli Bank 3.82 (3.29) 10.82 9,281 13.4 1.5 3.9 Qatar International Islamic Bank 9.67 (0.33) 6.81 14,634 17.0 2.4 3.4 Masraf Al Rayan 4.52 (0.92) (0.20) 33,908 15.1 2.4 3.8 Al Khaliji Bank 2.25 (0.40) 22.42 8,100 13.0 1.2 2.5 Qatar First Bank 1.80 (0.28) 4.59 1,260 18.2 2.4 N/A National Leasing 1.04 0.48 (16.17) 516 11.5 0.8 2.4 Dlala Holding 1.55 1.77 (13.70) 440 29.7 2.0 N/A Qatar & Oman Investment 0.95 1.50 7.10 299 30.3 1.0 N/A Islamic Holding Group 5.01 0.26 (2.05) 284 40.8 2.0 1.0 Banking and Financial Services 319,955 Zad Holding 15.80 (2.53) 16.57 4,119 21.3 2.8 4.0 Qatar German Co. for Medical Devices 2.96 3.64 32.41 342 407.5 10.9 N/A Salam International Investment 0.94 1.51 44.70 1,077 N/A 0.7 N/A Baladna 1.62 1.00 (9.50) 3,080 N/A 1.4 3.3 Medicare Group 8.45 (1.64) (4.42) 2,378 27.1 2.4 21.3 Qatar Cinema & Film Distribution 3.98 0.03 (0.40) 250 66.9 1.8 2.5 Qatar Fuel 17.98 0.28 (3.75) 17,877 19.0 2.2 2.6 Qatar Meat and Livestock 4.16 3.23 (34.20) 749 44.5 2.1 2.4 Mannai Corp. 4.02 3.51 33.87 1,832 5.5 0.9 0.2 Al Meera Consumer Goods 19.93 (0.25) (3.77) 3,986 21.4 2.7 4.5 Consumer Goods and Services 35,689 Qatar Industrial Manufacturing 2.95 2.72 (8.13) 1,401 13.0 0.9 3.4 Qatar National Cement 5.00 (0.54) 20.48 3,268 18.6 N/A 4.0 Industries Qatar 13.00 0.93 19.60 78,650 15.7 2.2 2.5 Qatari Investors Group 2.56 (1.99) 41.36 3,183 28.0 1.1 2.3 Qatar Electricity and Water 16.72 0.12 (6.33) 18,392 14.3 1.8 3.8 Aamal 0.98 (0.71) 14.62 6,174 26.4 0.8 4.1 Gulf International Services 1.51 1.01 (12.24) 2,797 N/A 0.9 N/A Mesaieed Petrochemical Holding 2.00 0.45 (2.54) 25,064 19.2 1.6 2.0 Invesment Holding Group 1.23 5.59 105.01 1,019 48.5 1.2 N/A Qatar Aluminum Manufacturing 1.62 3.12 67.53 9,040 24.6 1.6 2.2 Industrials 148,987 Qatar Insurance 2.47 (0.36) 4.57 8,067 19.4 1.0 N/A QLM Life & Medical Insurance 4.83 (0.72) N/A 1,690 N/A 3.1 N/A Doha Insurance 1.88 (1.05) 35.06 940 13.4 0.8 5.3 Qatar General Insurance & Reinsurance 2.10 0.00 (21.05) 1,838 10.7 0.4 N/A Al Khaleej Takaful Insurance 4.59 3.96 142.04 1,173 25.5 2.4 1.1 Qatar Islamic Insurance 7.90 1.28 14.49 1,185 15.8 3.1 4.1 Insurance 14,892 United Development 1.52 0.20 (8.28) 5,375 19.6 0.5 3.3 Barw a Real Estate 3.11 0.52 (8.67) 12,086 10.4 0.6 4.0 Ezdan Real Estate 1.58 1.87 (11.09) 41,883 116.5 1.3 N/A Mazaya Qatar Real Estate Development 1.04 1.56 (17.34) 1,209 41.7 1.0 2.9 Real Estate 60,553 Ooredoo 6.95 (0.94) (7.58) 22,262 N/A 1.1 3.6 Vodafone Qatar 1.60 1.07 19.42 6,759 28.2 1.5 3.1 Telecoms 29,021 Qatar Navigation (Milaha) 7.50 (0.24) 5.74 8,589 43.7 0.6 4.0 Gulf Warehousing 5.07 (1.21) (0.59) 297 13.0 1.5 2.0 Qatar Gas Transport (Nakilat) 3.09 (0.32) (2.83) 17,119 13.6 2.2 3.6 Transportation 26,006 Qatar Exchange 637,776
- 6. Contacts QNB Financial Services Co. W.L.L. Contact Center: (+974) 4476 6666 info@qnbfs.com.qa Doha, Qatar Saugata Sarkar, CFA, CAIA Shahan Keushgerian Mehmet Aksoy, PhD Head of Research Senior Research Analyst Senior Research Analyst saugata.sarkar@qnbfs.com.qa shahan.keushgerian@qnbfs.com.qa mehmet.aksoy@qnbfs.com.qa Disclaimer and Copyright Notice: This publication has been prepared by QNB Financial Services Co. W.L.L. (“QNBFS”) a wholly-owned subsidiary of Qatar National Bank (Q.P.S.C.). QNB FS is regulated by the Qatar Financial Markets Authority and the Qatar Exchange. Qatar National Bank (Q.P.S.C.) is regulated by the Qatar Central Bank. This publication expresses the views and opinions of QNBFS at a given time only. It is not an offer, promotion or recommendation to buy or sell securities or other investments, nor is it intended to constitute legal, tax, accounting, or financial advice. QNBFS accepts no liability whatsoever for any direct or indirect losses arising from use of this report. Any investment decision should depend on the individual circumstances of the investor and be based on specifically engaged investment advice. We therefore strongly advise potential investors to seek independent professional advice before making any investment decision. Although the information in this report has been obtained from sources that QNBFS believes to be reliable, we have not independently verified such information and it may not be accurate or complete. QNBFS does not make any representations or warranties as to the accuracy and completeness of the information it may contain, and declines any liability in that respect. For reports dealing with Technical Analysis, expressed opinions and/or recommendations may be different or contrary to the opinions/recommendations of QNBFS Fundamental Research as a result of depending solely on the historical technical data (price and volume). QNBFS reserves the right to amend the views and opinions expressed in this publication at any time. It may also express viewpoints or make investment decisions that differ significantly from, or even contradict, the views and opinions included in this report. This report may not be reproduced in whole or in part without permission from QNBFS. COPYRIGHT: No part of this document may be reproduced without the explicit written permission of QNBFS. Page 6 of 6